Cardano, Shiba Inu, MANA Price Analysis: 19 November

While the crypto market cap has yet again hit a $2.6T-mark, altcoins like Cardano and Shiba Inu hit their weekly lows over the past three days. Their near-term technicals confirmed a bearish inclination but showed slight recovery signs.
On the contrary, MANA was on an uptrend since last week by registering over 48% weekly ROI.
Cardano (ADA)
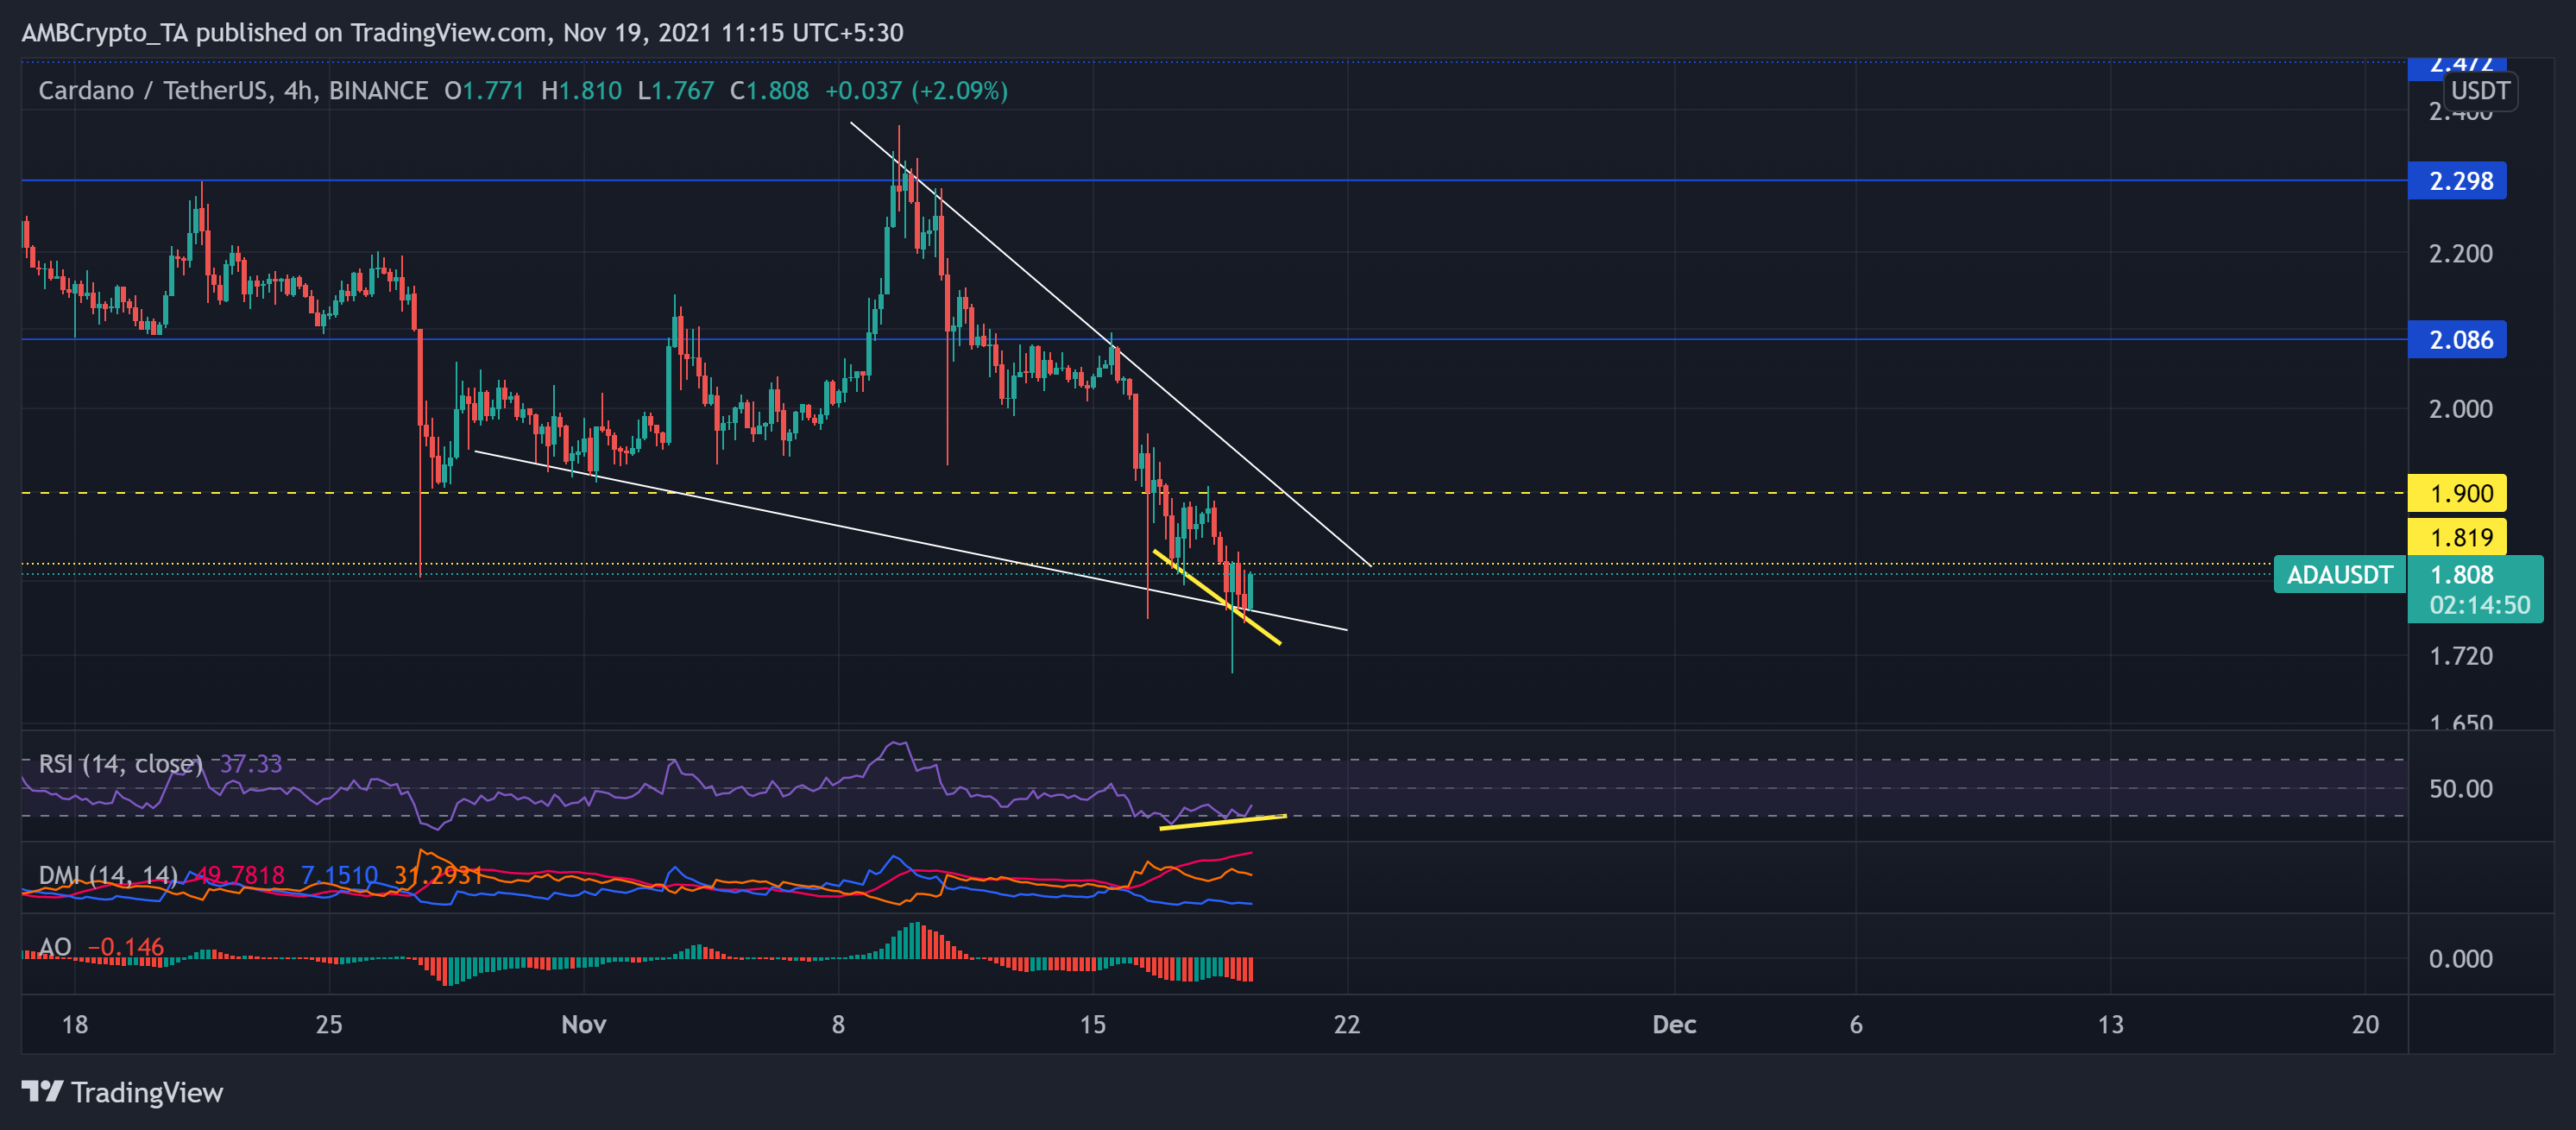
Since early September, the alt registered a 41.34% decline until it hit its 11-week low on 27 October. After which, the bulls triggered an uptrend to hit its one-month high on 9 November.
However, they struggled to find their ground and counter the sell-off as the price further dipped by 28.28% from 9 to 18 November. Consequently, the price poked its 14-week low on 18 November. While the bears ruthlessly breached the immediate resistance at the $1.8-mark, the bulls showed opposition at the lower trendline.
At press time, ADA was trading at $1.808. The RSI undoubtedly preferred the sellers but showed some recovery signs by plunging 12 points over two days. Besides, a bullish divergence (yellow trendline) along the RSI and price action pointed at a near-term revival. On the other hand, AO and DMI continue to display a bearish preference.
Shiba Inu (SHIB)
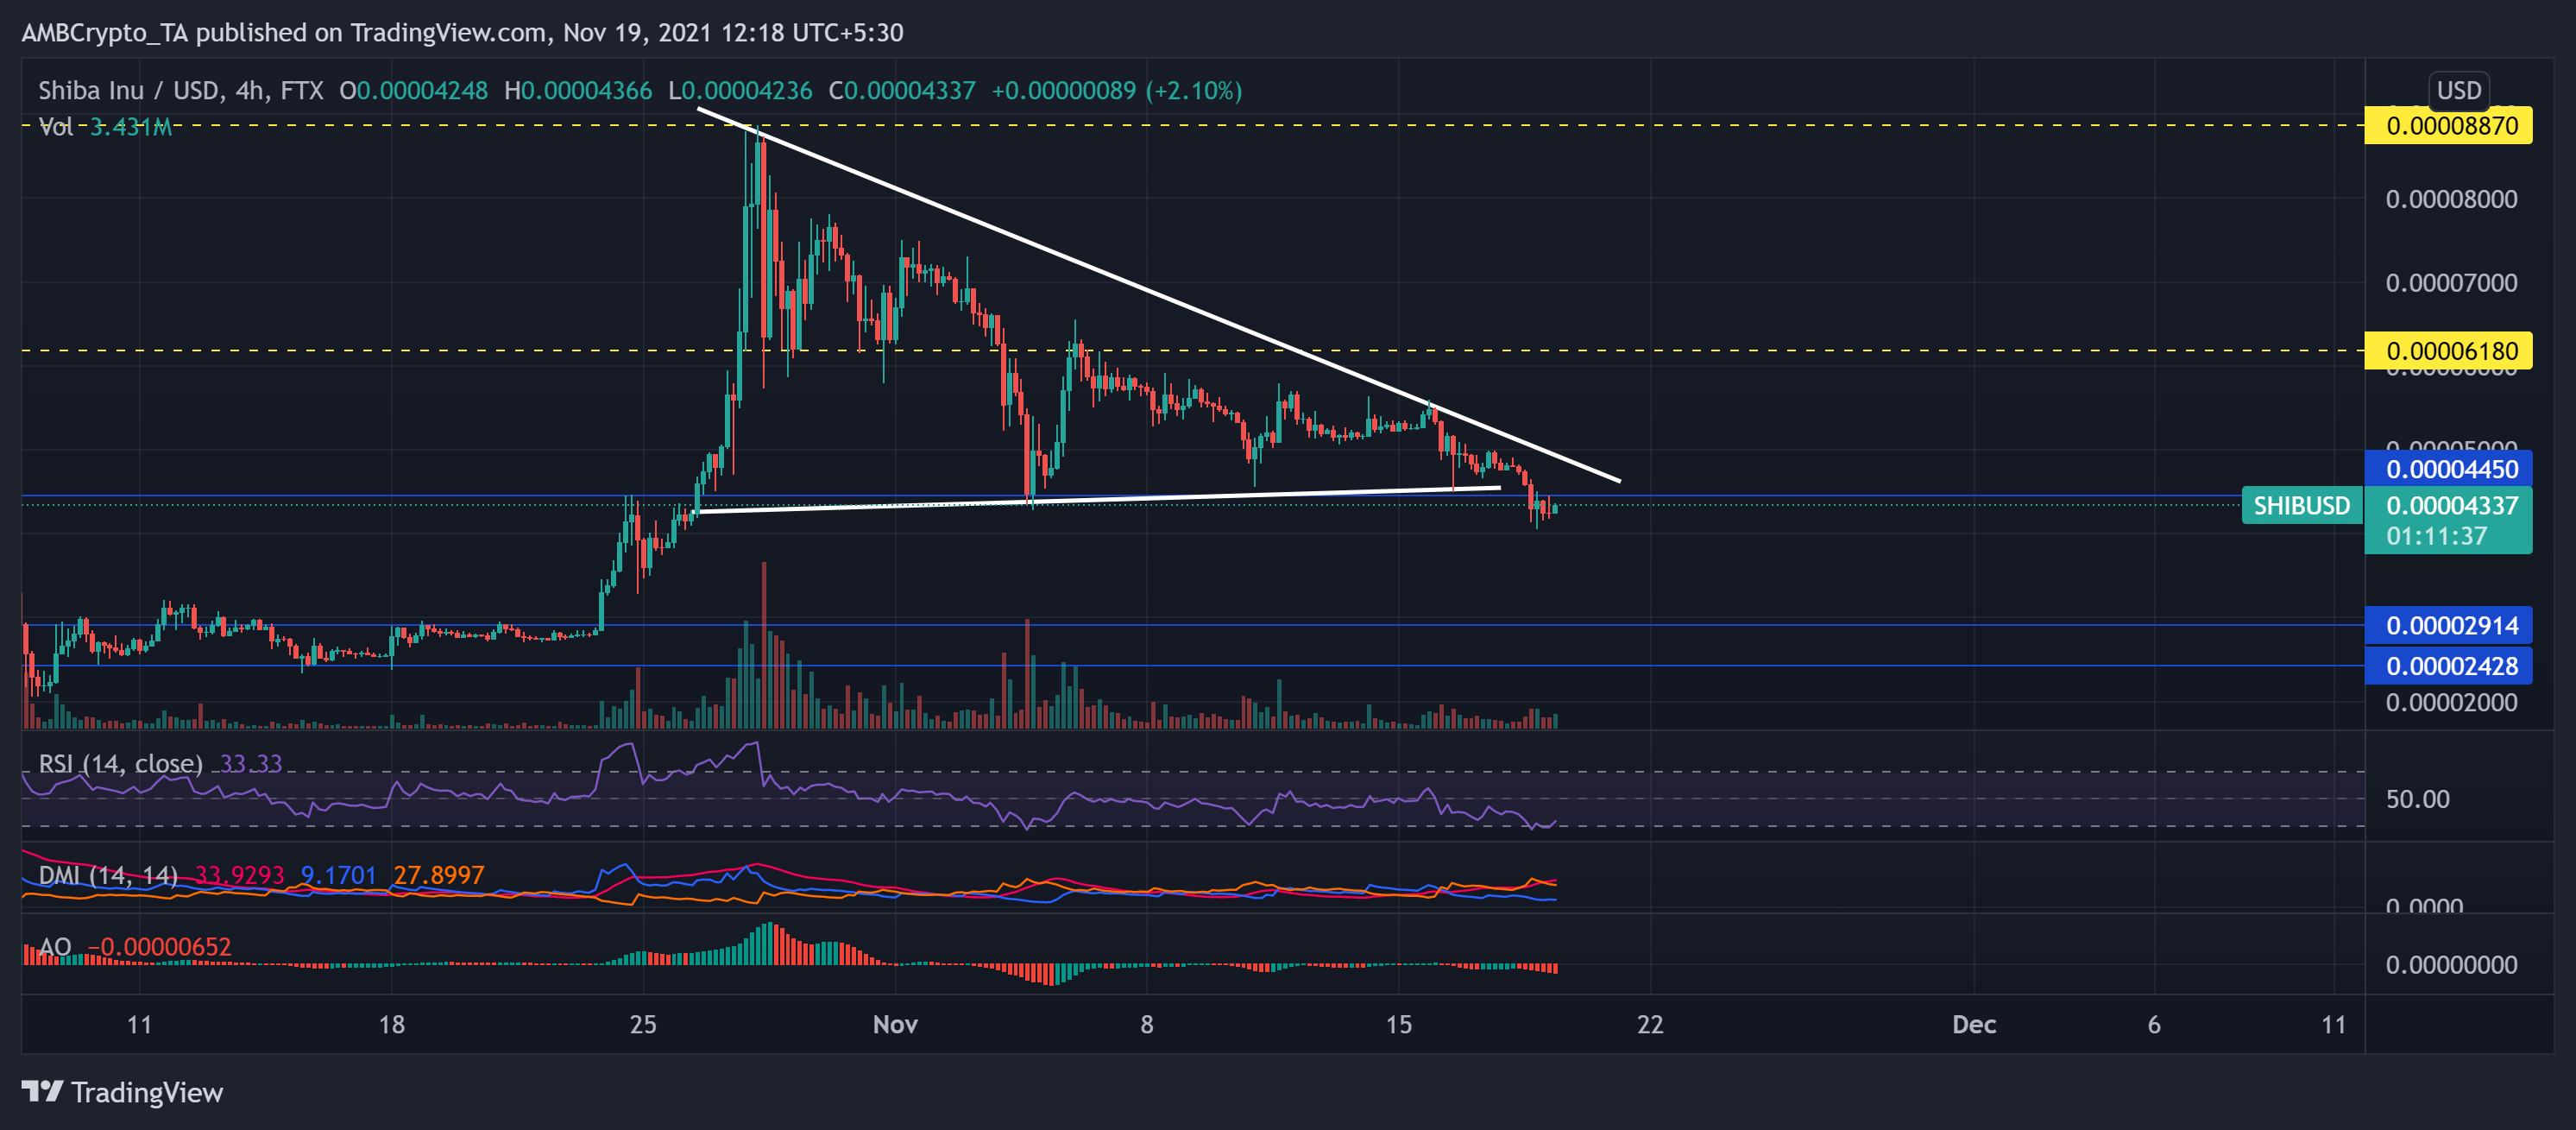
The altcoin was on a constant pullback after touching its ATH on 28 October. Since then, the price persistently reversed in a descending triangle during the correction phase. Consequently, SHIB lost over half of its value in the next 22 days until 19 November. During this phase, the price hit its three-week low on 16 November.
Further, the bulls failed to keep up the $0.0000445-mark and found immediate support at $0.00002914. At press time, SHIB traded at $0.00004337.
The RSI was essentially below or near the midline for the past 19 days. However, it showed some revival signs after a slight plunge from the oversold region. Moreover, the DMI and AO visibly reaffirm the selling strength.
Decentraland (MANA)
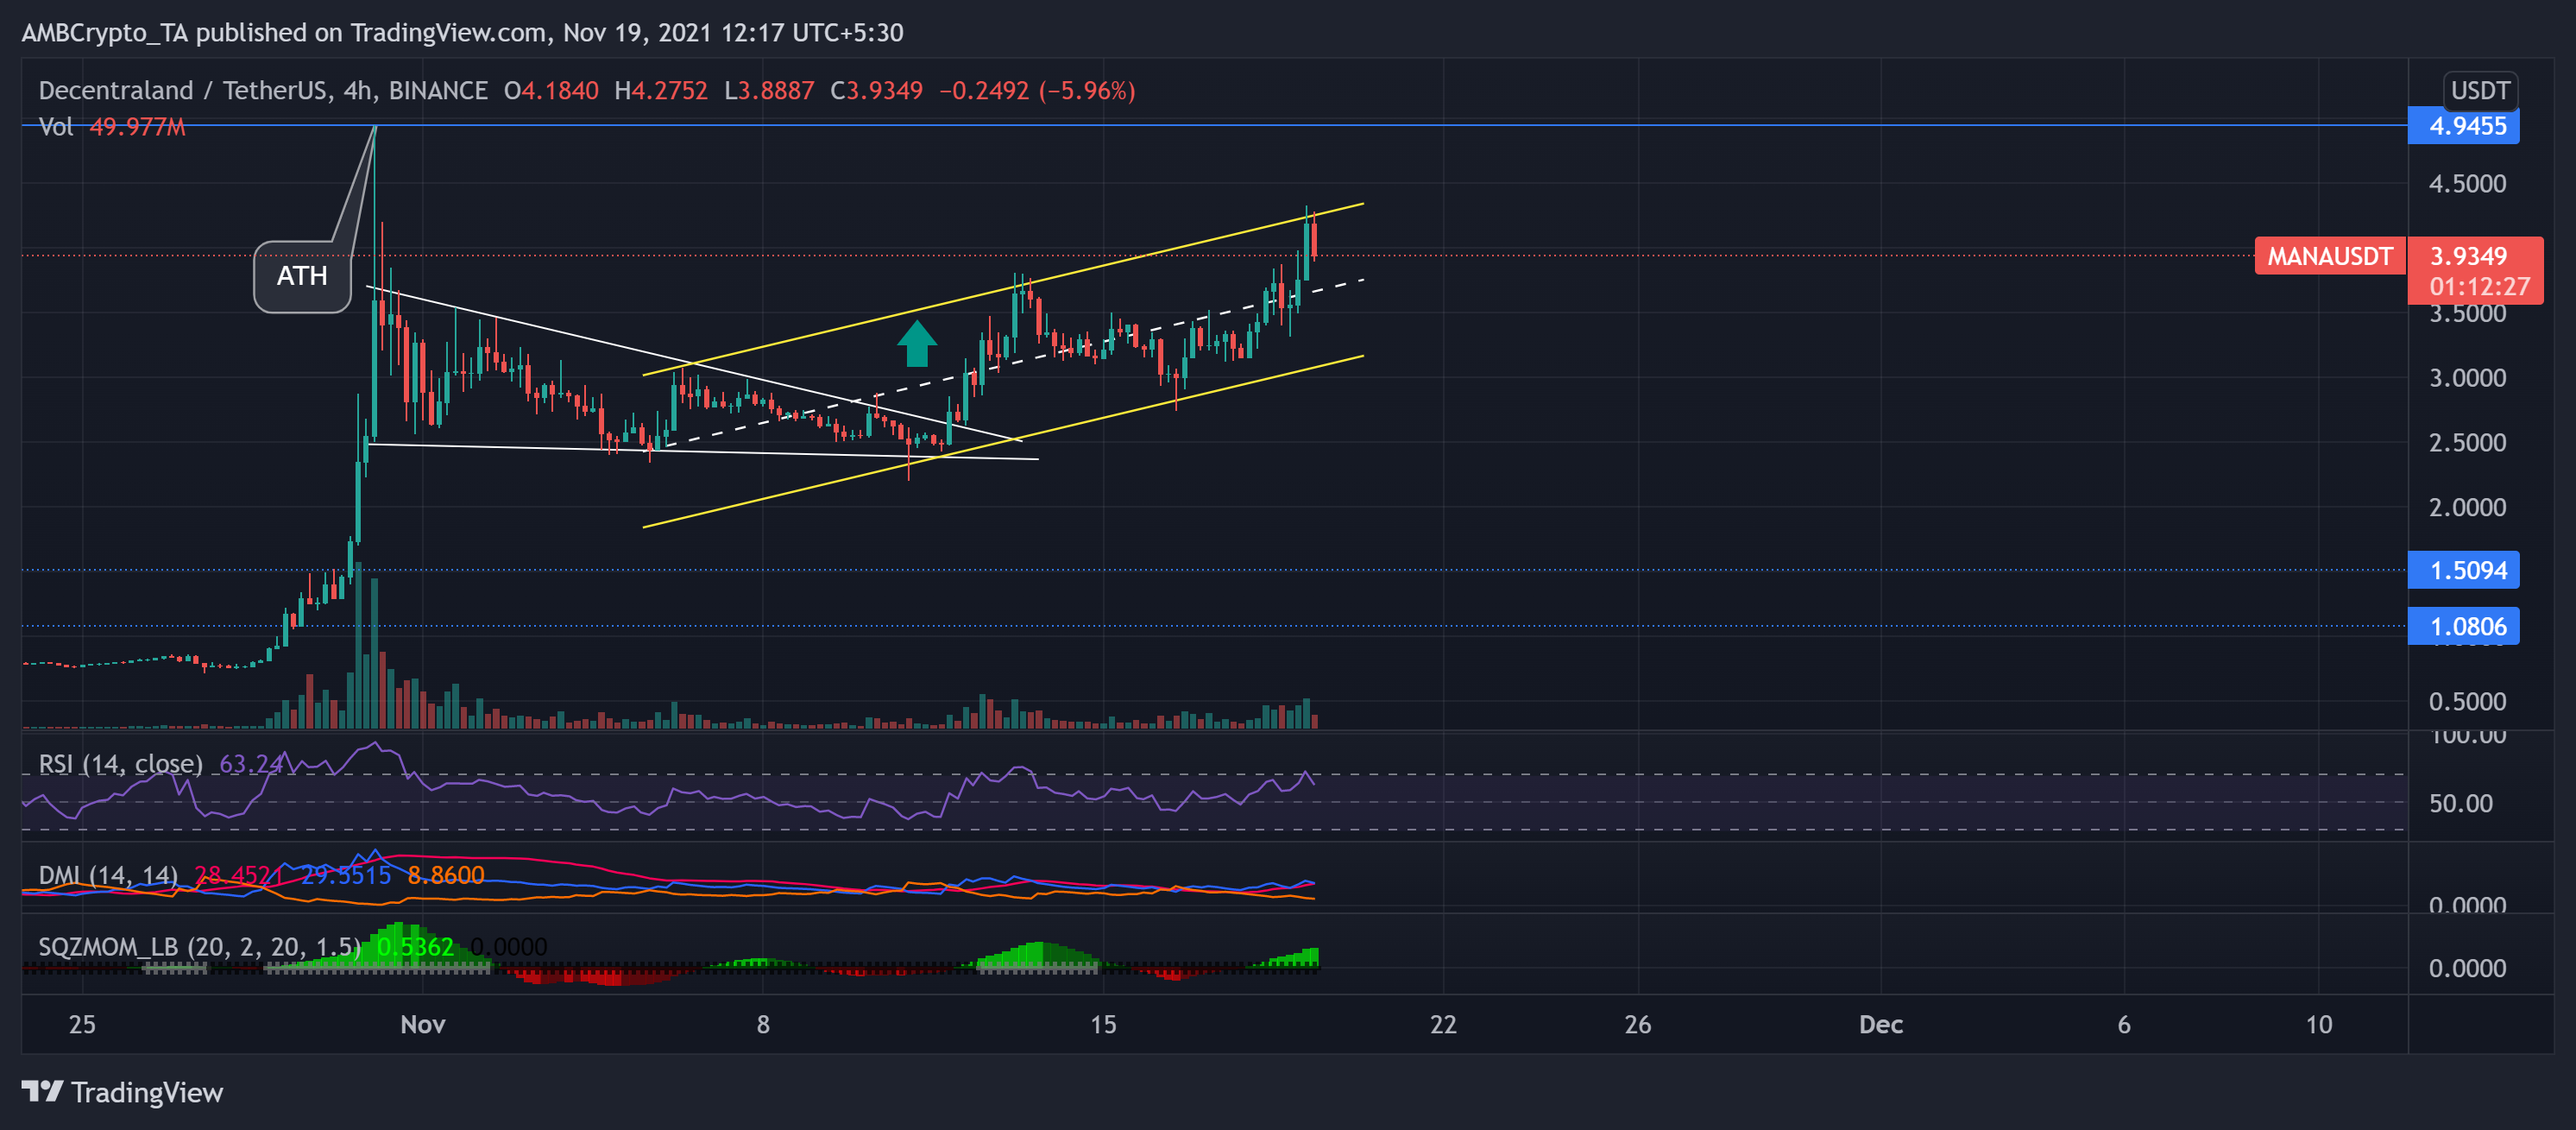
Since 28 October, MANA saw over 500% gains over the next three days and encountered its ATH on 31 October. After which, MANA price action saw a downfall. The withdrawal resulted in nearly 45% retracement until the bulls took over on 11 November. Consequently, the metaverse alt has registered a 48.6% weekly ROI.
This bullish revival caused a descending wedge breakout and transposed into parallel channels heading north. Moreover, after the price hit the $4.3-mark on 19 November, it bounced back from the upper trendline (yellow).
Over the last day, MANA saw a 12.2% increase as the near-term technicals showed a bullish bias. At press time, MANA traded at $3.9349.
The RSI over the last week swayed above or near the midline, presenting a bullish sentiment. Further, the DMI confirmed the RSI’s conclusion. Nevertheless, Squeeze Momentum Indicator displayed black dots, hinting at a squeeze phase with low volatility.