
As the recovery phase kicked in, the bulls triggered an upswing but could not match up the losses in the previous sell-off. While the broader bearish trend continued, the near-term technical indications of Cardano, Shiba Inu and VeChain hinted at a slim bullish revival.
Given the overall sentiment, the bulls could not gather enough volumes to signal a healthy trend in their favor.
Cardano (ADA)
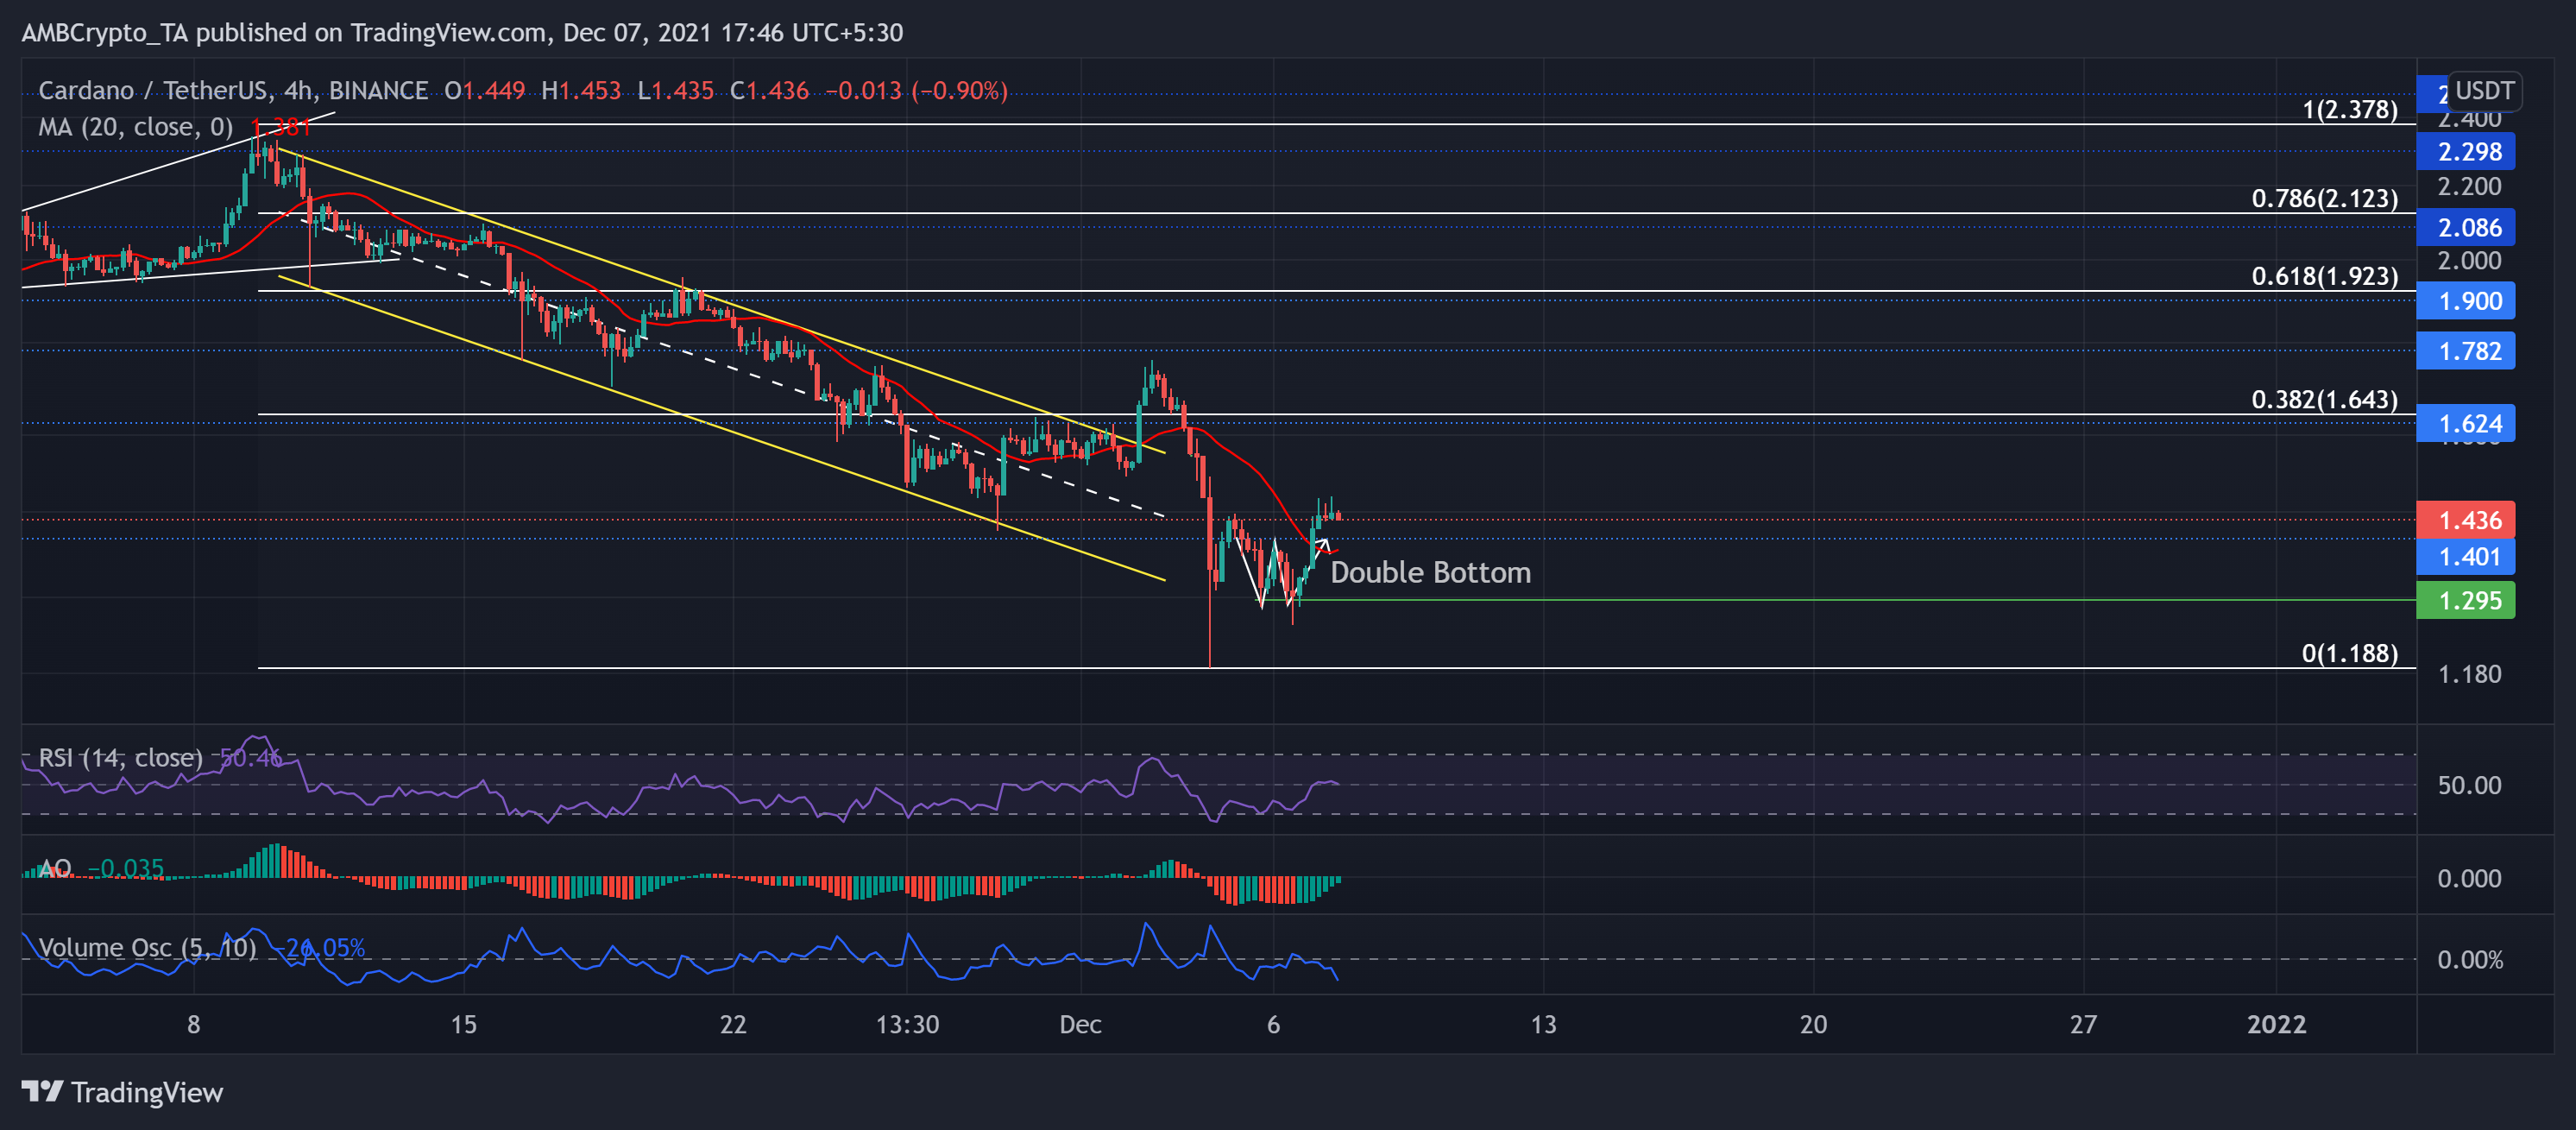
TradingView, ADA/USDT
Over the past two days, ADA managed to form a double bottom on its 4-hour chart having the neckline at the $1.4-mark.
The alt performed quite poorly as it saw an ascending broadening wedge breakdown after hitting its one-month high on 9 November. Since then, ADA lost nearly half of its value as the price poked its 19-week low on 3 December.
After retesting the 38.2% Fibonacci resistance thrice, bulls breached it for a brief time but could not sustain their pressure. As a result, the price action broke down below the 16-week resistance at the $1.4-mark.
At press time, ADA traded at $1.436 after noting a 10.1% 24-hour gain. Consequently, the price moved above the 20-SMA (red). The RSI was in an uptrend after slightly preferring the bulls. Also, the AO confirmed this by approaching the zero line. However, the recent surge occurred on rather decreasing trading volumes, depicting a weak bullish move.
Shiba Inu (SHIB)
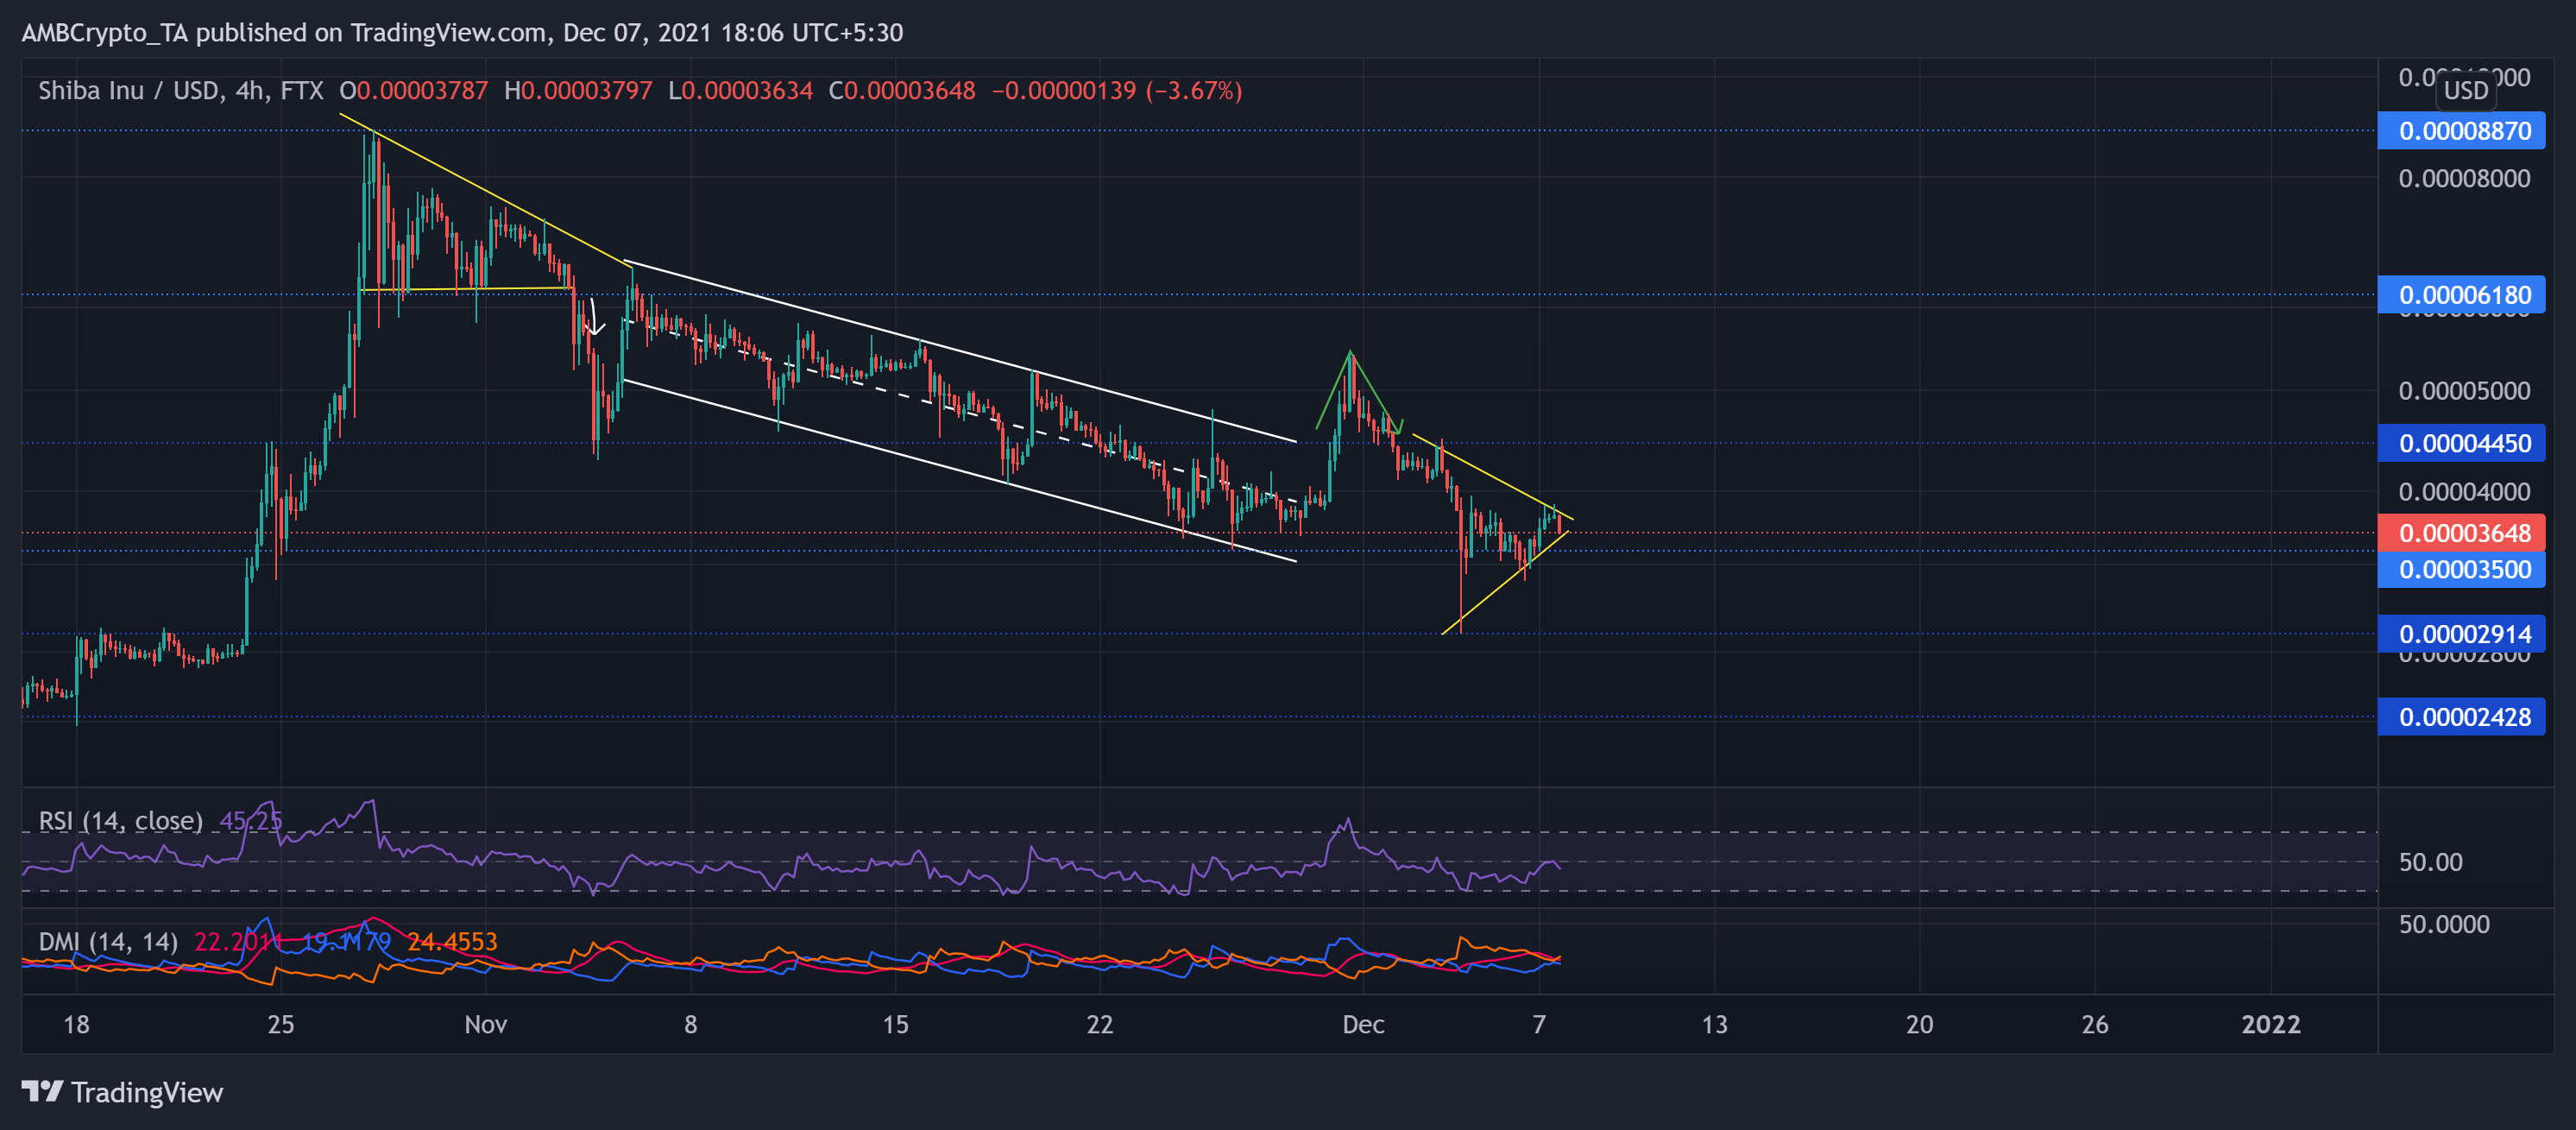
TradingView, SHIB/USD
SHIB formed a Symmetrical triangle post a V-top breakdown over the past four days. After striking its ATH on 28 October, the meme token persistently slackened in a down-channel after a descending triangle breakdown on its 4-hour chart.
After the bulls struggled to uphold the one-month support level at the $0.000035-mark, the price action poked its six-week low on 3 December. Although they dwindled, they ensured the $0.00002914-mark support. Consequently, SHIB traded at $0.00003648 after noting a nearly 8.16% 24-hour gain.
Over the past day, the RSI saw a jump but failed to cross the mid-line and seemed to head south. Also, the DMI slightly preferred the sellers. However, the ADX depicted a weak directional trend.
VeChain (VET)
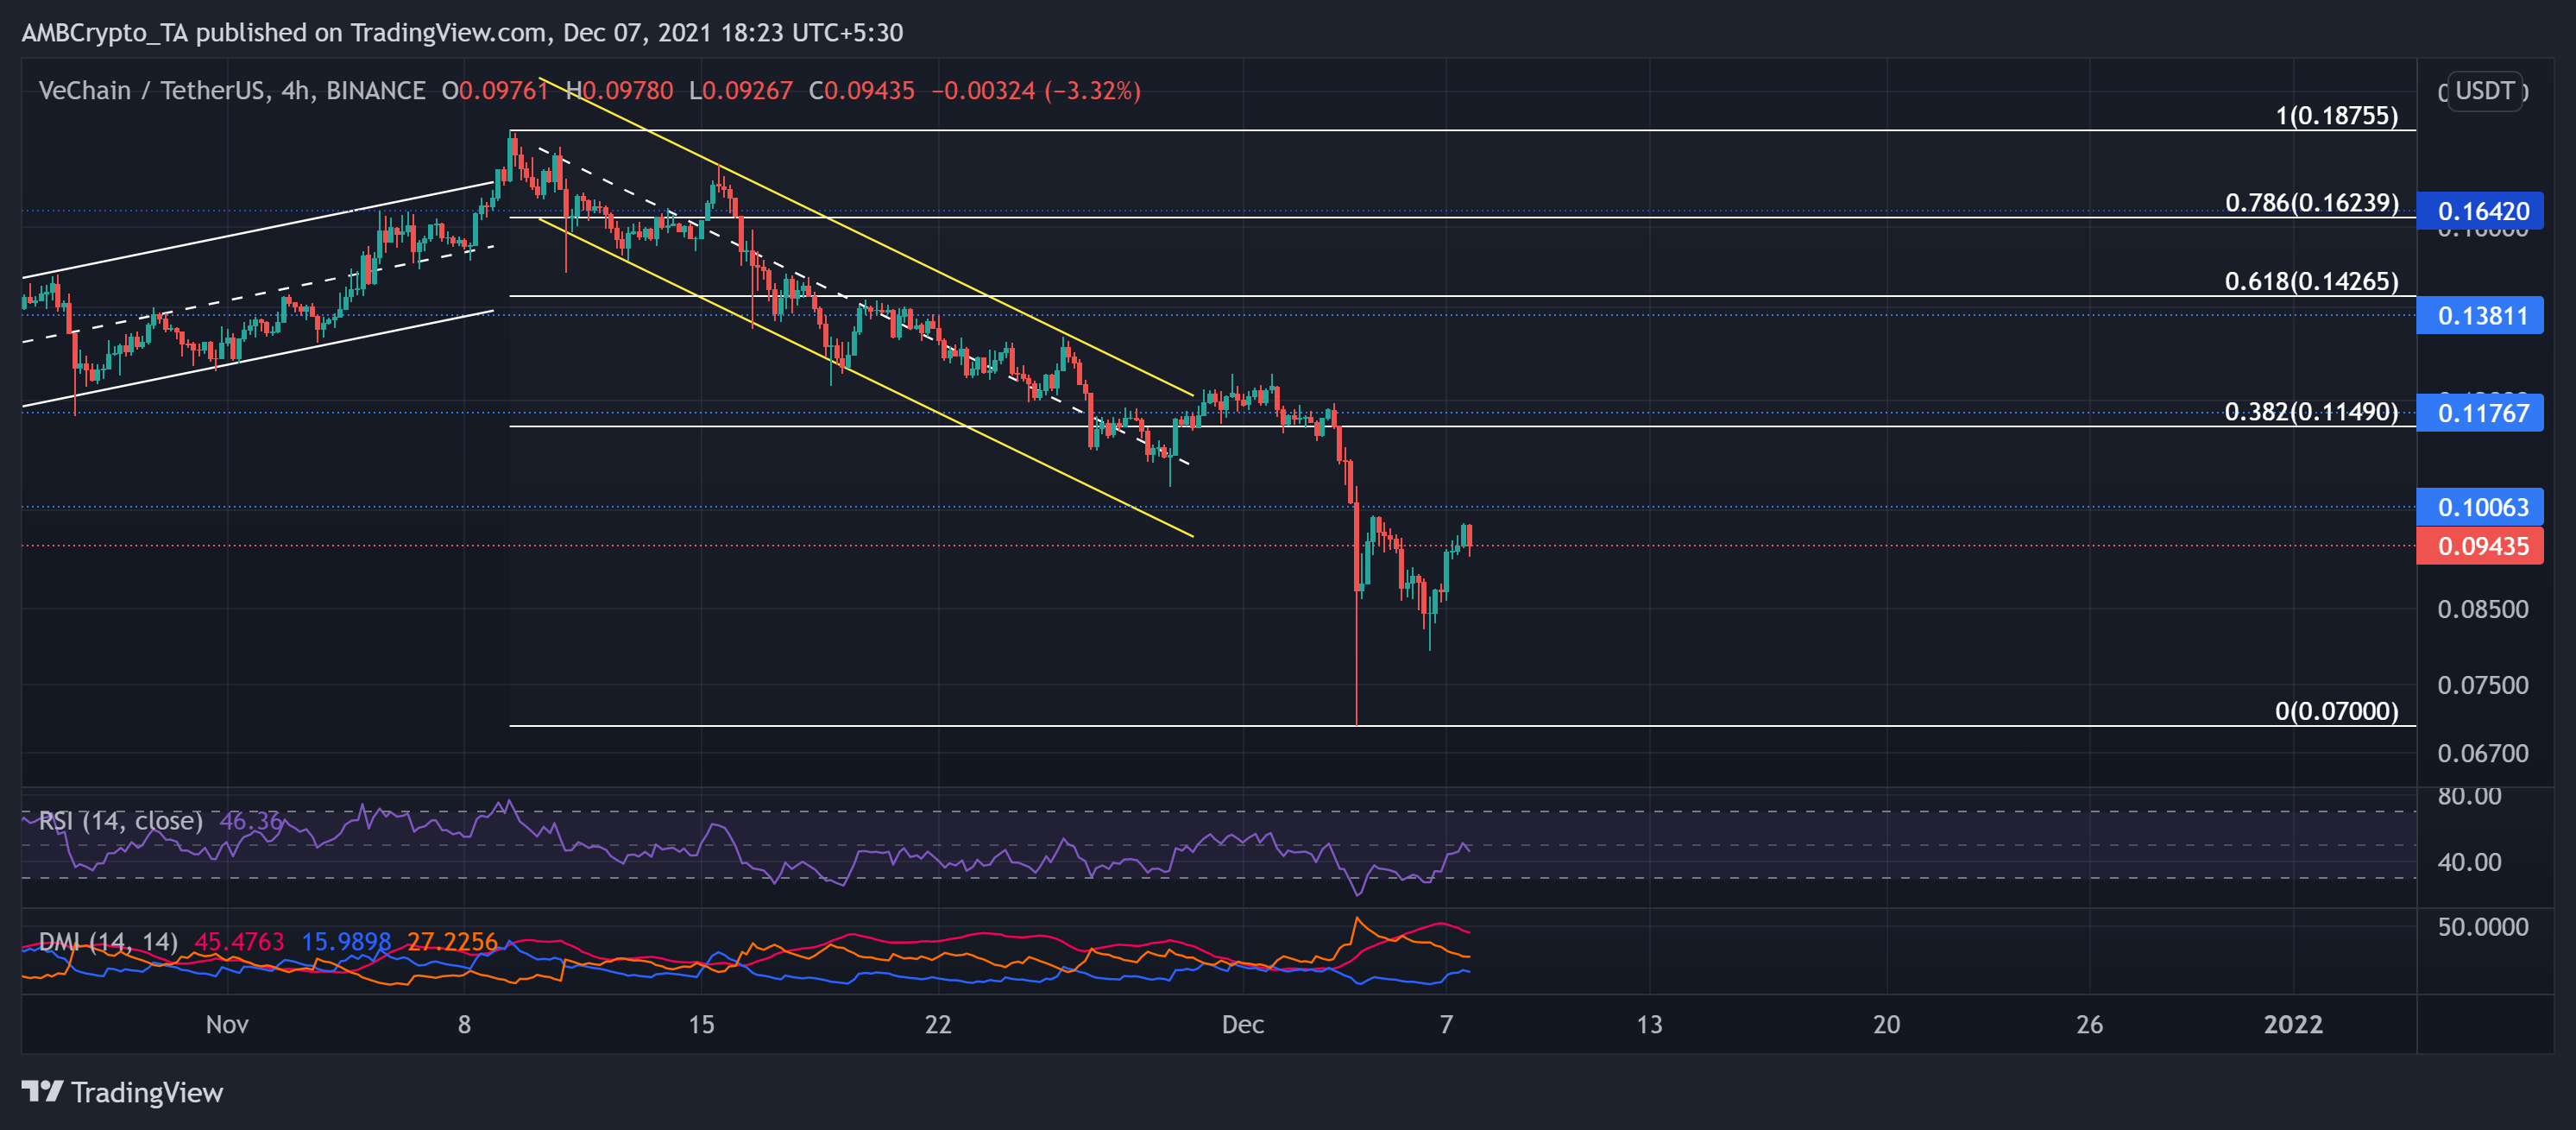
TradingView, VET/USDT
VET invalidated its long-term bullish trend (since July) after an abrupt fall that poked its four-month low on 3 December. The bulls lost their edge after the price touched its six-month high on 9 November.
After retesting the upper channel twice, the bulls finally initiated an 18.13 rally from 28 November to 1 December. This upturn led to a down-channel breakout, but the bears ensured the $0.117-mark seven-week resistance. Consequent to a broader sell-off, the price action moved below the 38.2% Fibonacci level.
At press time, VET traded at $0.09435 after noting a 9.9% 24 hour gain. After a monstrous plunge toward the half-line, the RSI was southbound after failing to cross the equilibrium. Also, the DMI preferred the bears with a high directional trend.