Cardano, Solana, Shiba Inu Price Analysis: 18 December

Cardano found strong support at $1.2, while Solana also saw demand at the $168-$170 area. However, if Bitcoin slides towards the $42k pocket over the next few days, most altcoins can expect to see heavy red. Shiba Inu also faced strong selling pressure.
Cardano [ADA]
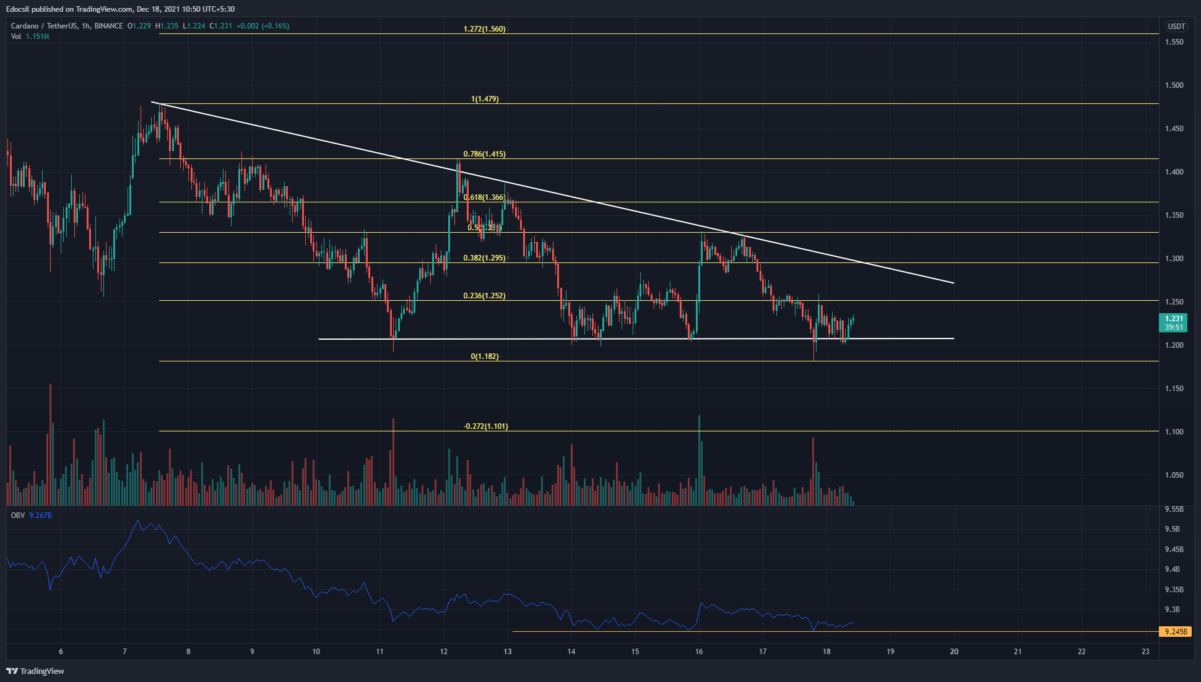
ADA formed a descending triangle pattern on the hourly chart. The Fibonacci retracement levels appeared to be respected by the price, as these levels coincided with a series of lower highs in the past two weeks following the 4 December selloff.
An hourly or 4-hour session candle close outside the triangle pattern is necessary to determine ADA’s short-term trajectory. The OBV held tenuously on to support and showed buyers losing strength on each bounce, off the $1.2 level. This meant that a close beneath $1.2 is likely to see ADA seek $1.1 as support.
Solana [SOL]
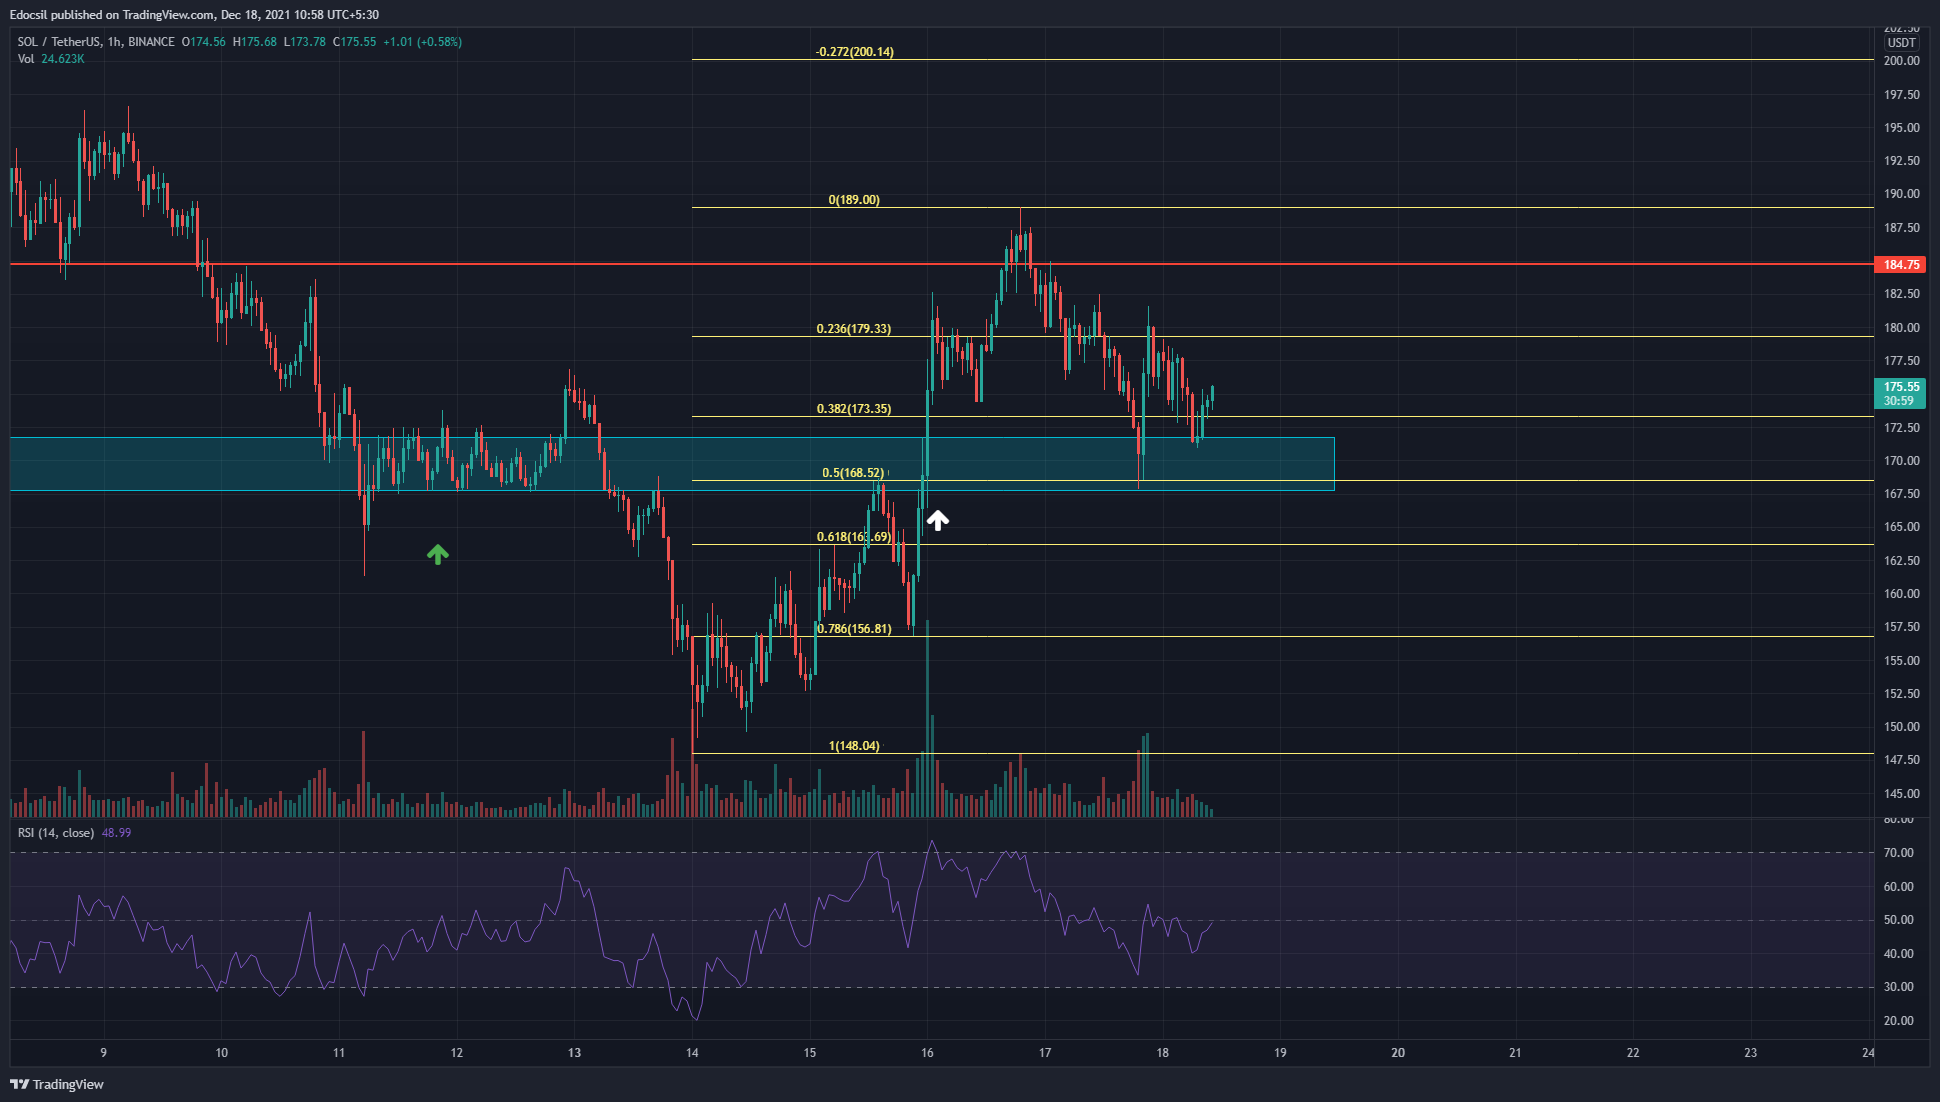
Solana had strong demand in the $168 area. The green arrow shows price compression in this area, a deviation to the upside to draw liquidity, and a move south to $148 lows before recovery began.
The cyan area was cleanly broken through (white arrow), but the move failed to breach the $184 resistance and stalled at $189. As indicated by the RSI, momentum had been bearish the previous day and neutral at the time of writing.
Using the Fibonacci retracement tool for this low timeframe move, alongside liquidity pockets, $179 is the resistance to beat for bulls while losing $168 could see SOL revisit $150 quickly.
Shiba Inu [SHIB]
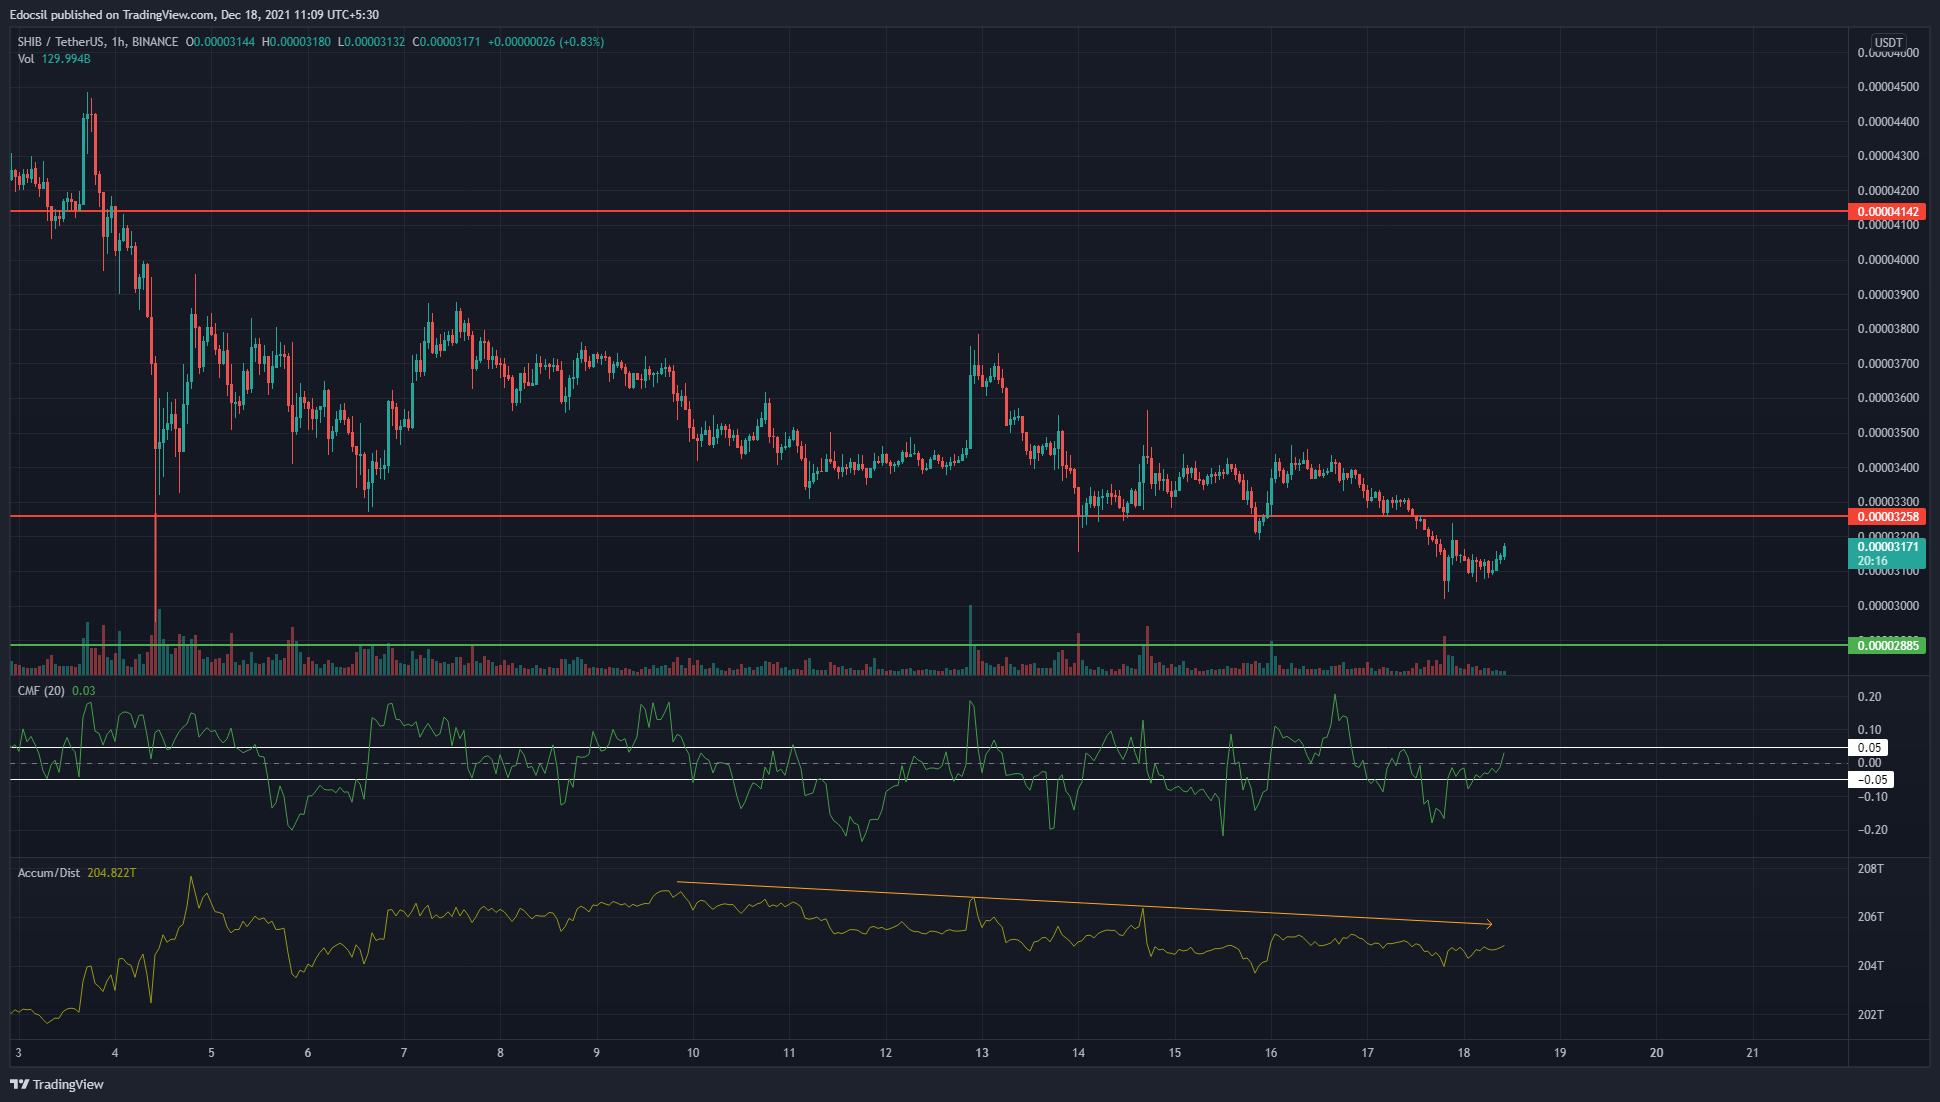
Note: SHIB prices are written as ‘price x 1000’ to avoid too many decimal places.
The support and resistance lines plotted are high timeframe levels, and hence significant. SHIB lost the $0.0325 (price x 1000) level of support in the past 24 hours.
The A/D indicator was in a steady decline, while the CMF indicator climbed toward +0.05 but did not show capital inflow into the markets. Overall, the SHIB/USDT market was dominated by sellers.