Cardano: This new bullish pattern holds big promise for a recovery to $1
Cardano price shows signs of coming around after months of downtrend. The four-hour chart shows that ADA has formed a bottom reversal pattern suggesting a reversal in trend.
Therefore, investors need to pay close attention to how this formation resolves and translates into a higher time frame.
A full 180 for ADA holders
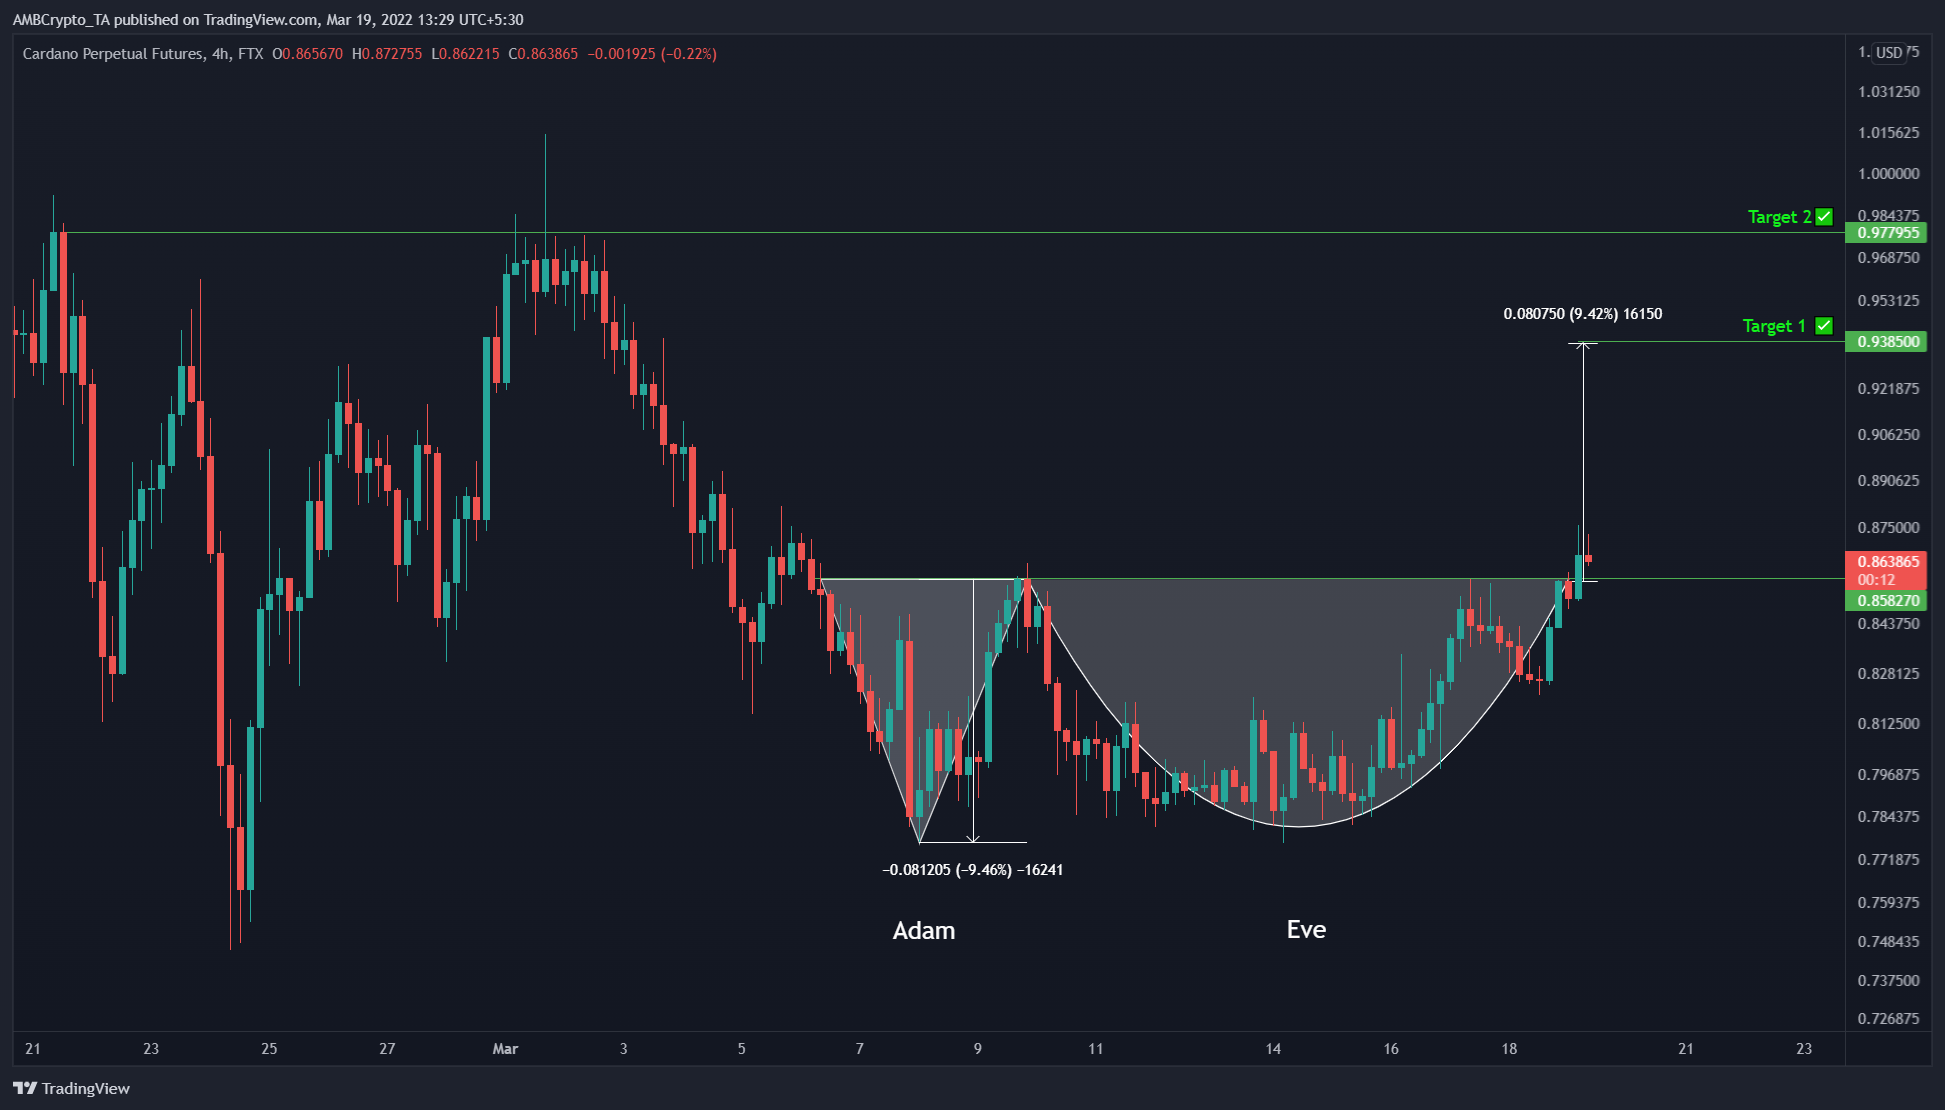
Cardano price formed the Adam and Eve pattern on the four-hour chart, hinting at a reversal. This technical formation contains a sharp valley followed by a rounded bottom, both trapped below a horizontal resistance barrier.
For ADA, the valley was a result of the 10% downswing. The recovery from this downswing was also met with a selling pressure leading to the formation of a rounded bottom. ADA faced selling pressure around $0.858 and failed to move past it thrice, making it a vital resistance barrier.
This technical formation forecasts a 10% upswing, determined by adding the distance between the highest peak and lowest valley to the breakout point at $0.858.
Doing so reveals a target at $0.938. While theoretically, this target makes sense, investors need to look beyond to find a more apt place where buyers would form a local top. The $0.977 is one such level since Cardano price formed multiple local tops around this barrier since 21 February.
Therefore, the market makers are likely to propel ADA beyond $0.938 to sweep the liquidity resting above $0.977. Hence, investors can expect Cardano price to retest the $1 psychological level soon.
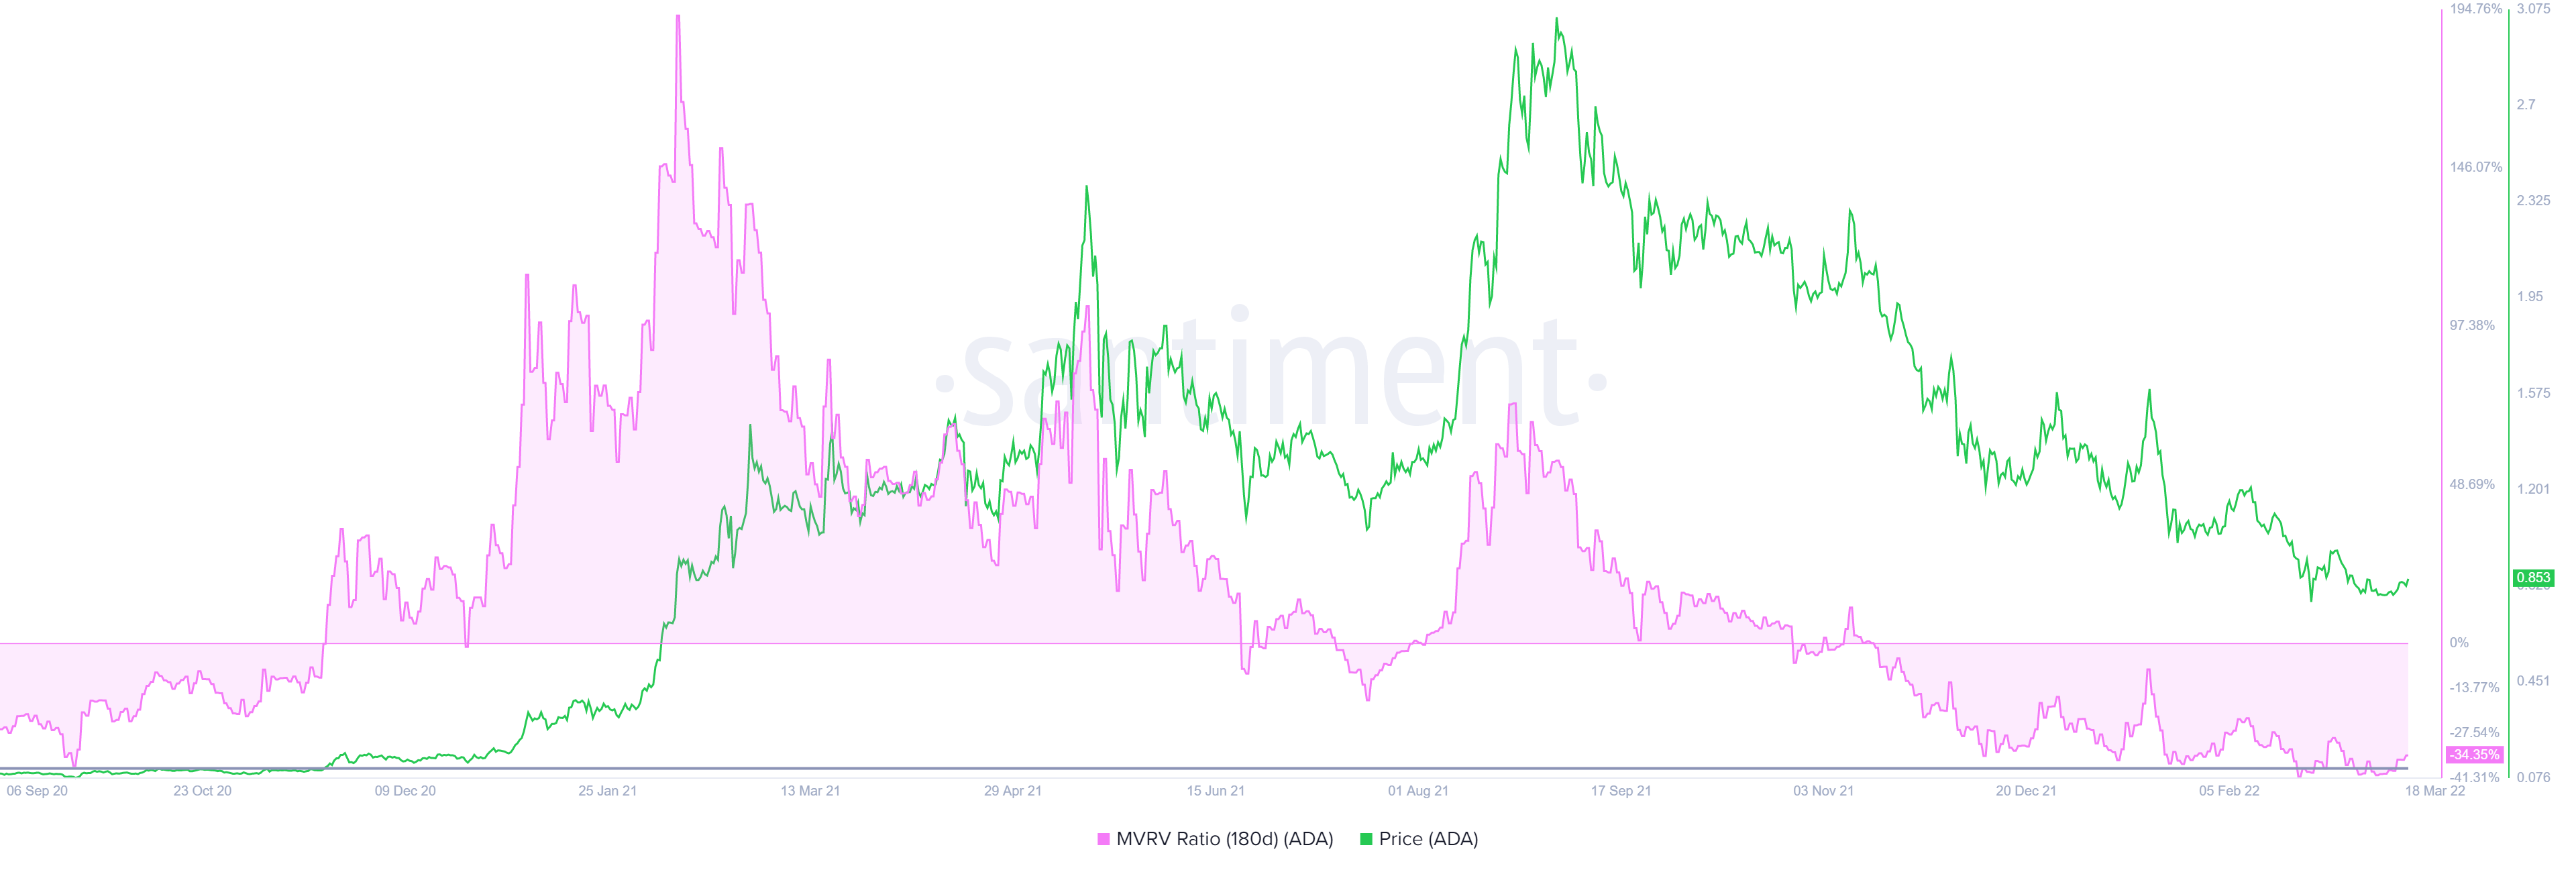
Supporting this outlook for ADA is the 180-day Market Value to Realized Value (MVRV) model. This indicator is used to assess the average profit/loss of investors that purchased ADA tokens over the six months.
A negative value below 10% indicates that short-term holders are at a loss and is typically where long-term holders tend to accumulate. Therefore, a value below -10% is often referred to as an “opportunity zone.”
For ADA the 180-day MVRV is hovering around -34%, which indicates an oversold market condition. Additionally, this level was last seen in September 2020, which marked the beginning of a bull run for Cardano price that netted a total gain of 4,147% in under a year.
Additionally, if the ADA price fails to hold above $0.825, it will create a lower low and invalidate the bullish thesis. This development could see Cardano price crash lower to find a stable support level.