Cardano, Tron, Axie Infinity Price Analysis: 24 January

As the ‘fear’ sentiment got worse, Bitcoin lost over 8% of its value in a few hours. Consequently, Tron and Axie Infinity managed to hit new lows on 24 January. Also, these bearish candlesticks accompanied high volumes, hinting at a strong bear move.
The bulls visibly failed to counter the selling pressure. But, is that it?
Cardano (ADA)

Over the past two months, the sellers have shown up at the $1.59-mark and halted the bullish rallies. Thus, the recent up-channel saw a breakdown from the aforementioned mark. The alt registered a 44.29% decline (from 18 January) and hit its nine-month low on 22 January.
This fall proved menacing for the bulls as ADA fell below its EMA ribbons and even lost the vital $1.02-mark. Now, any possible recoveries would find resistance at the 20-EMA near the $1.12-level. And, further pullbacks to find a testing ground at the $0.91-mark.
At press time, ADA was trading at $0.97. The falling wedge breakout tested the 44-mark RSI but yet again hovered around the oversold region. Furthermore, the Volume Oscillator saw a sudden spike during the last few candlesticks, hinting at a strong bear move.
Tron (TRX)
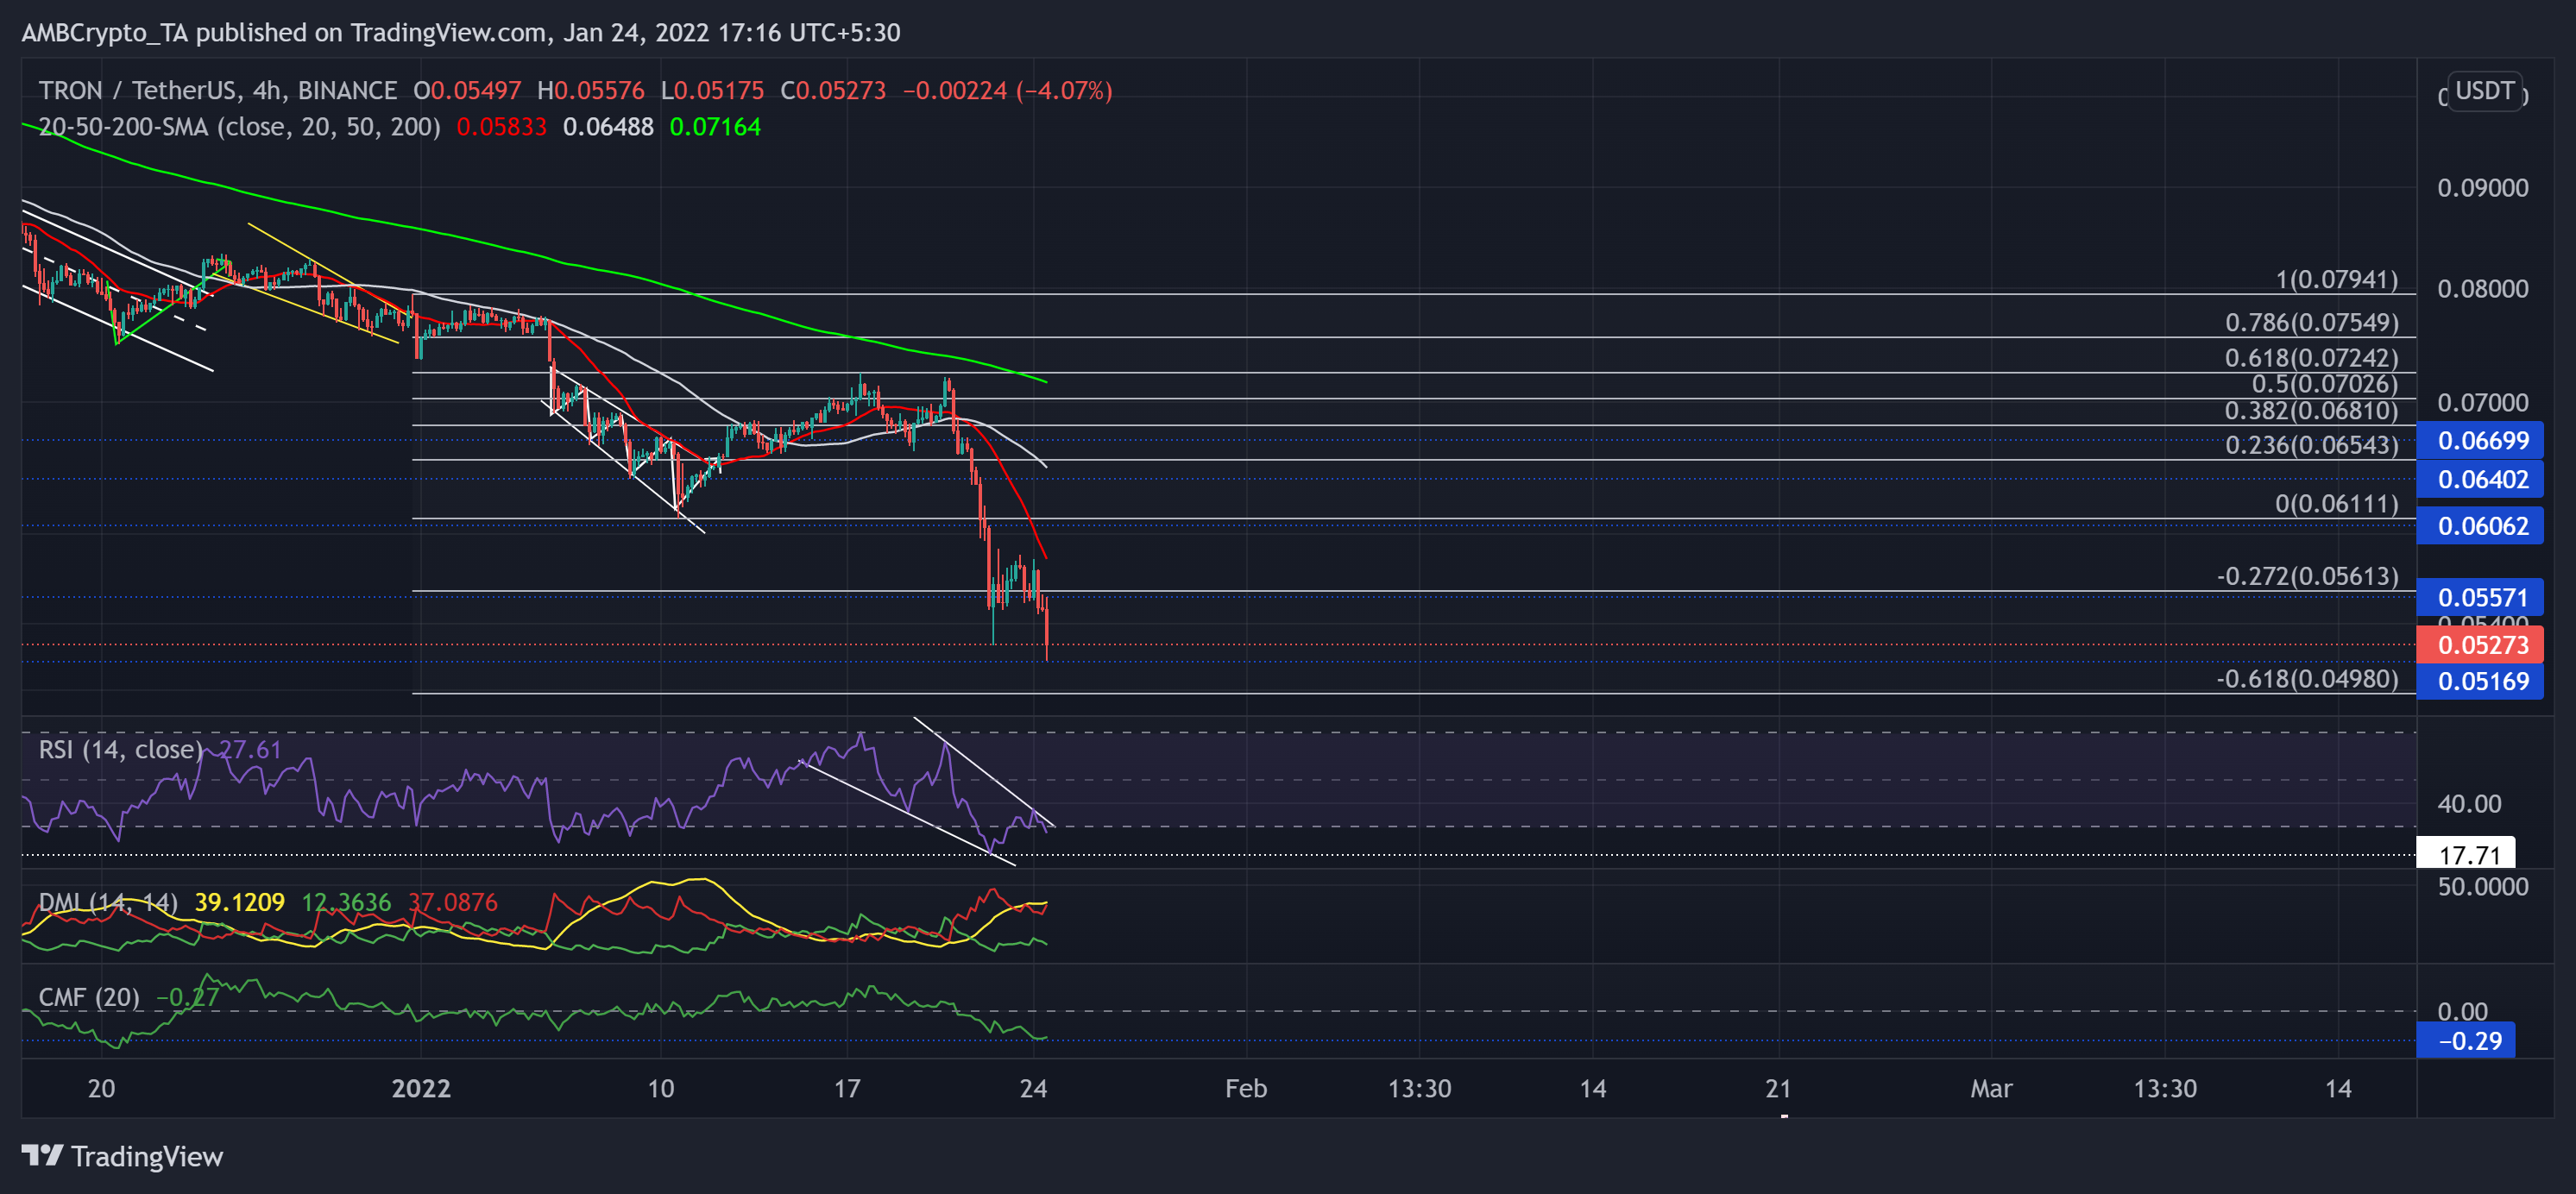
After reversing from the 61.8% Fibonacci resistance on 20 January, TRX correlated with the broader trajectory and saw red candlesticks until press time. The crypto registered a 28.2% decline in just four days and touched its six-month low mark on 24 January.
As the gap between the 20-SMA (red) and the 50 SMA (grey) widened, the selling influence increased. Now, the immediate testing point for the bears stood at $0.0516-mark.
At press time, TRX was trading at $0.05273. The RSI was on a solid downturn and now eyed to retest the oversold territory. Also, with the +DI looking south, the near-term momentum rested with the bears. While the CMF corresponded with the recent plunge, it maintained its one-month support.
Axie Infinity (AXS)
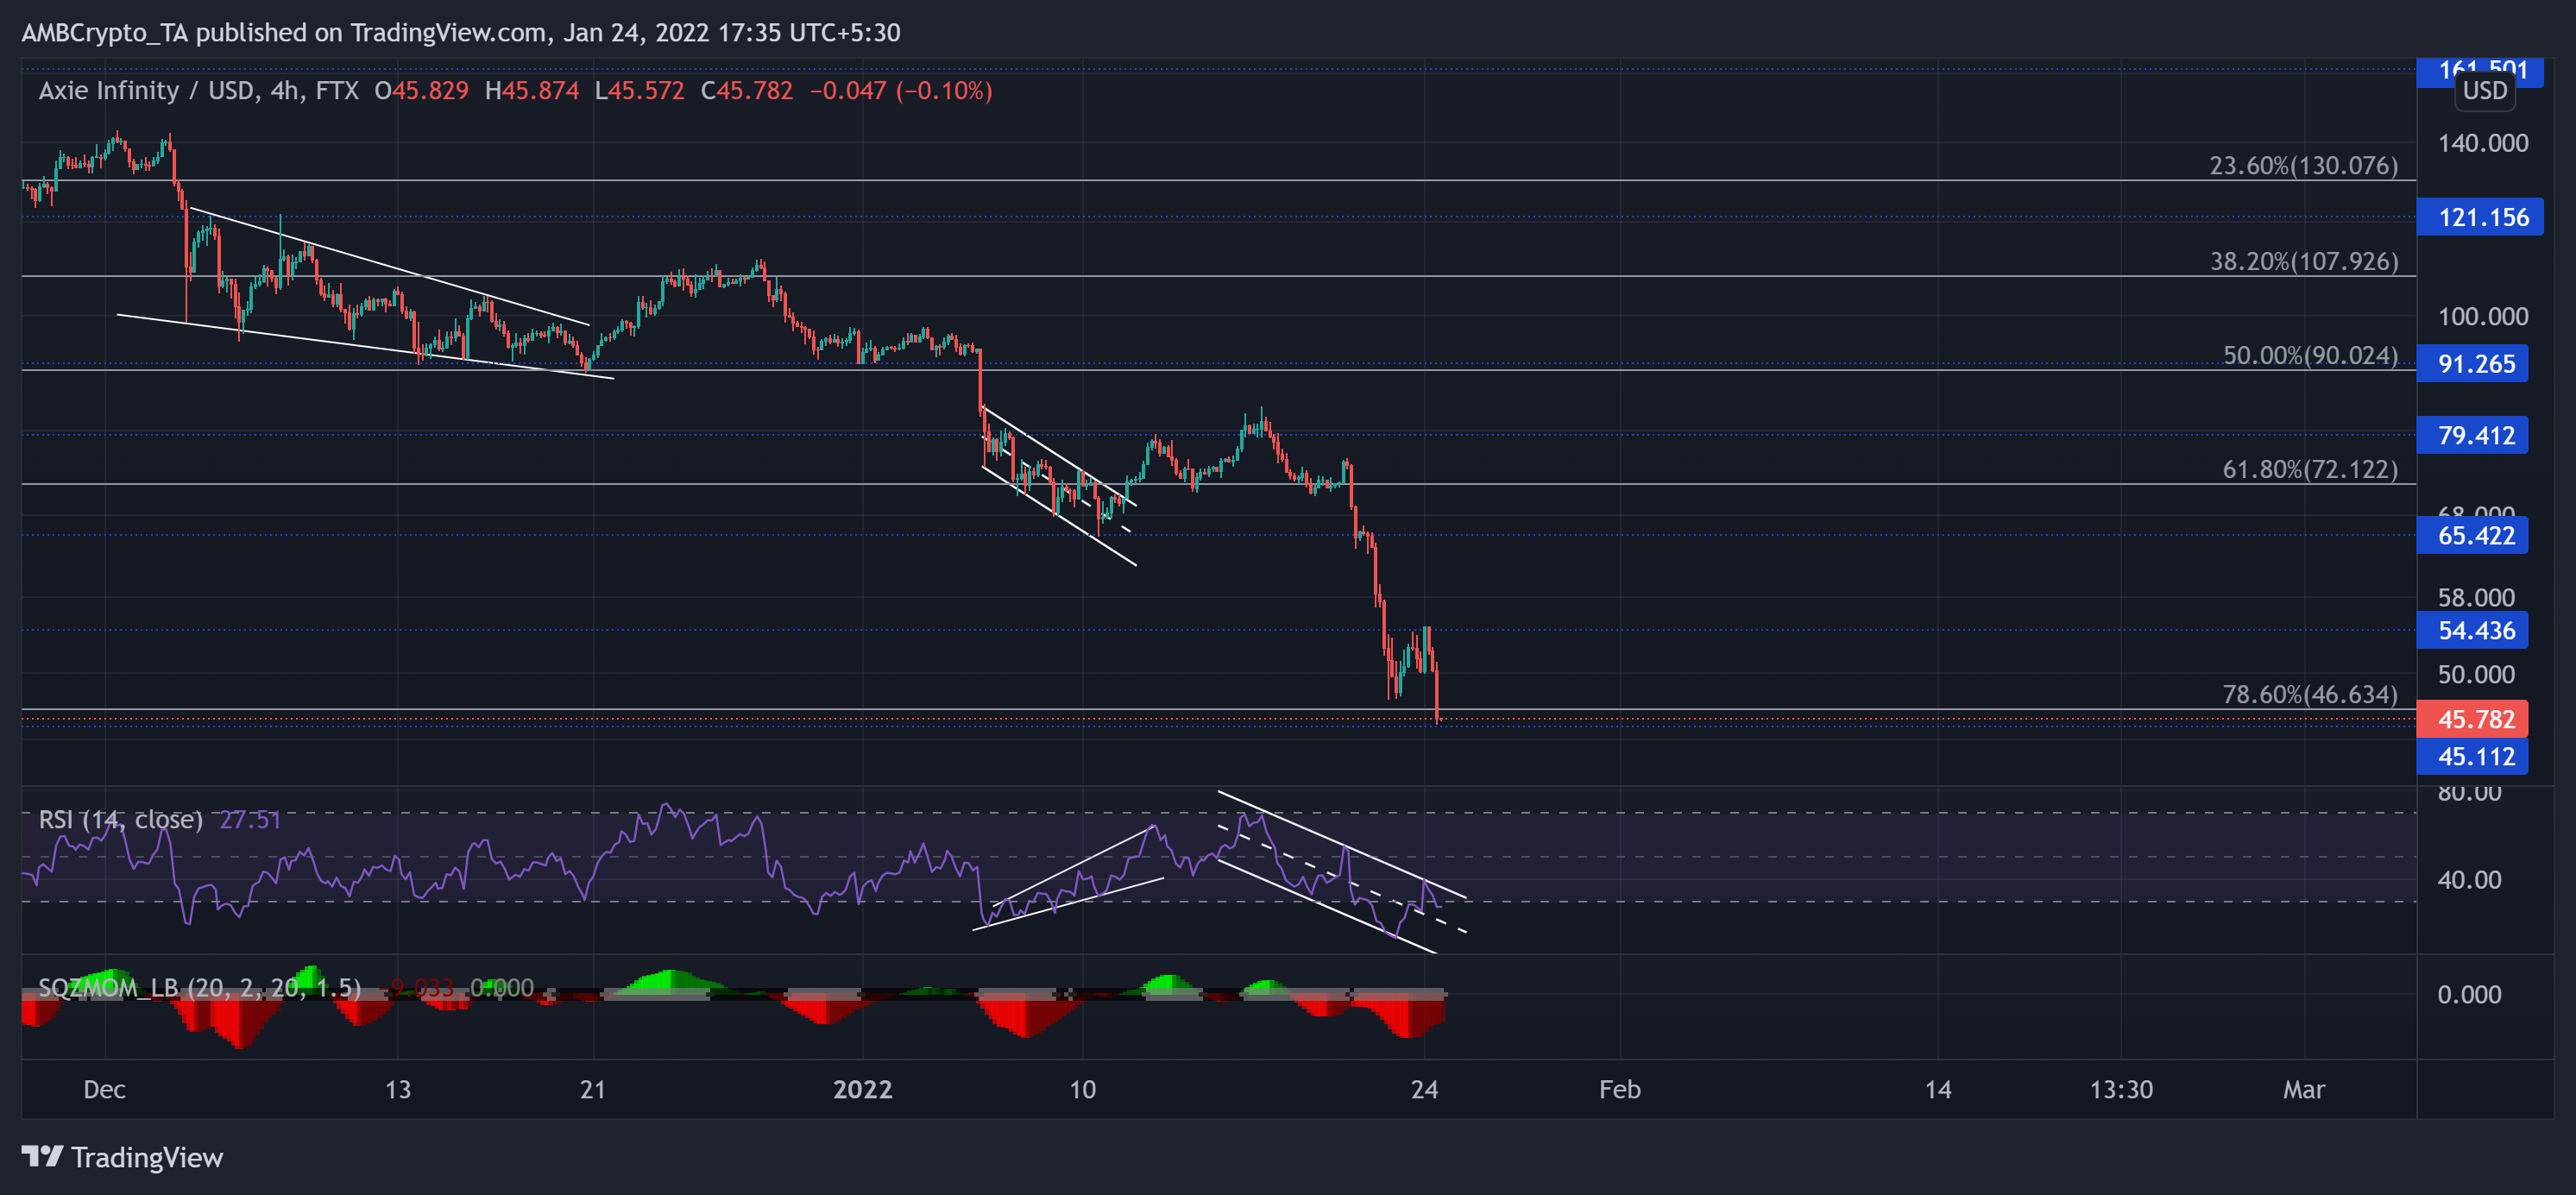
The altcoin noted a 12.16% loss on its charts in the last 24 hours. Since striking its ATH on 6 November, AXS has steadily declined and lost multiple resistance levels over the past month. The alt lost more than half of its value (since 5 January) as it rushed south to touch its five-month low on 24 January.
After the down-channel (white) breakout, the sellers stepped in at the $79-zone and tested the long-term 61.8% Fibonacci support twice in the past ten days. Then, after losing the above support, the $45-mark support now becomes a key level for the buyers to show up.
At press time, AXS was at $45.782. The RSI was on a down-channel trajectory and displayed a one-sided bearish edge. Also, the Squeeze Momentum Indicator continued to flash grey dots, hinting at a high volatility phase in the near term.