Cardano, Tron, NEAR Price Analysis: 08 May

As the broader market crumbled all the way down to the $1.6T-mark at press time, the long-term HODLers have been trying to stall the boosted sell-off situation. Consequently, Cardano and NEAR fell below their 20/50/200 EMA while poking their multi-month lows on 8 May.
On the other hand, Tron’s 4-hour RSI, unlike its peer alts, swayed above the midline as the alt entered into a low volatility phase.
Cardano (ADA)
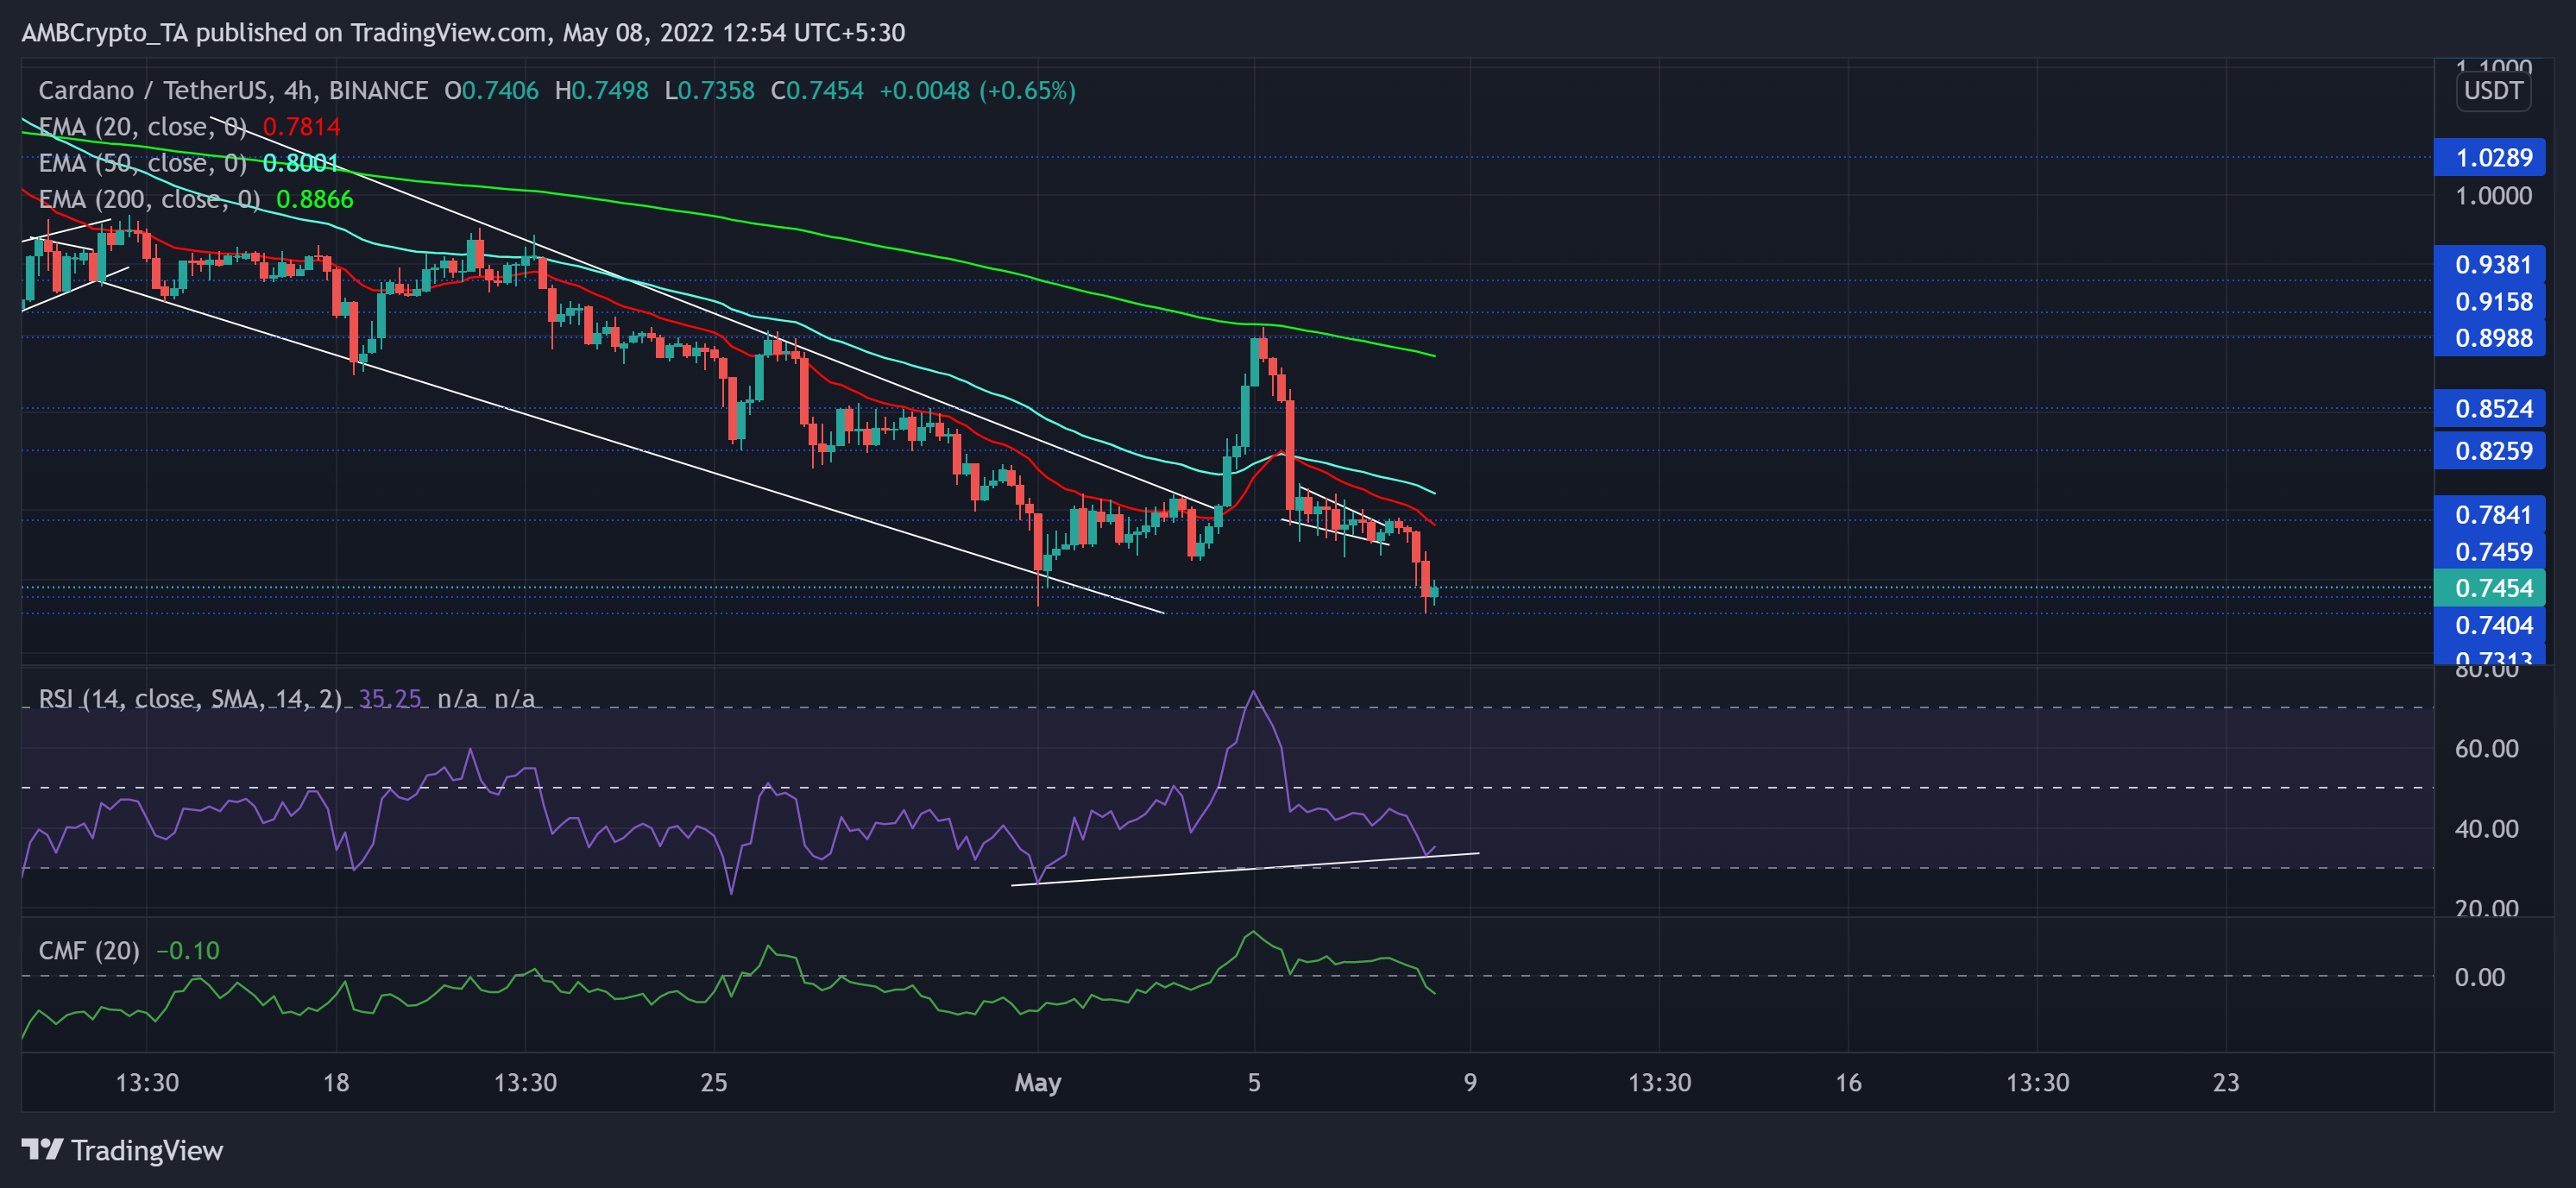
After the bears found renewed selling pressure at the $1.1-$1.2 resistance range, ADA restored its slump phase and dropped below its 4-hour 20/50/200 EMA. Meanwhile, this descent chalked out a 41.07% retracement over the last 33 days.
The 5 May sell-off spurred a series of bearish engulfing candlesticks that pulled ADA down to its 15-month low on 8 May. While the sellers assumed immediate control of the trend, the bulls needed to scale up their efforts to soar the trading volumes.
At press time, ADA traded at $0.7454. The RSI has been on a steep downtrend over the last three days. Its week-long troughs revealed a bullish divergence with price. Thus, a revival from its current levels was plausible in the coming times. But with the CMF diving below the zero-mark, the buyers had to up their game substantially to alter the current bearish outlook.
Tron (TRX)
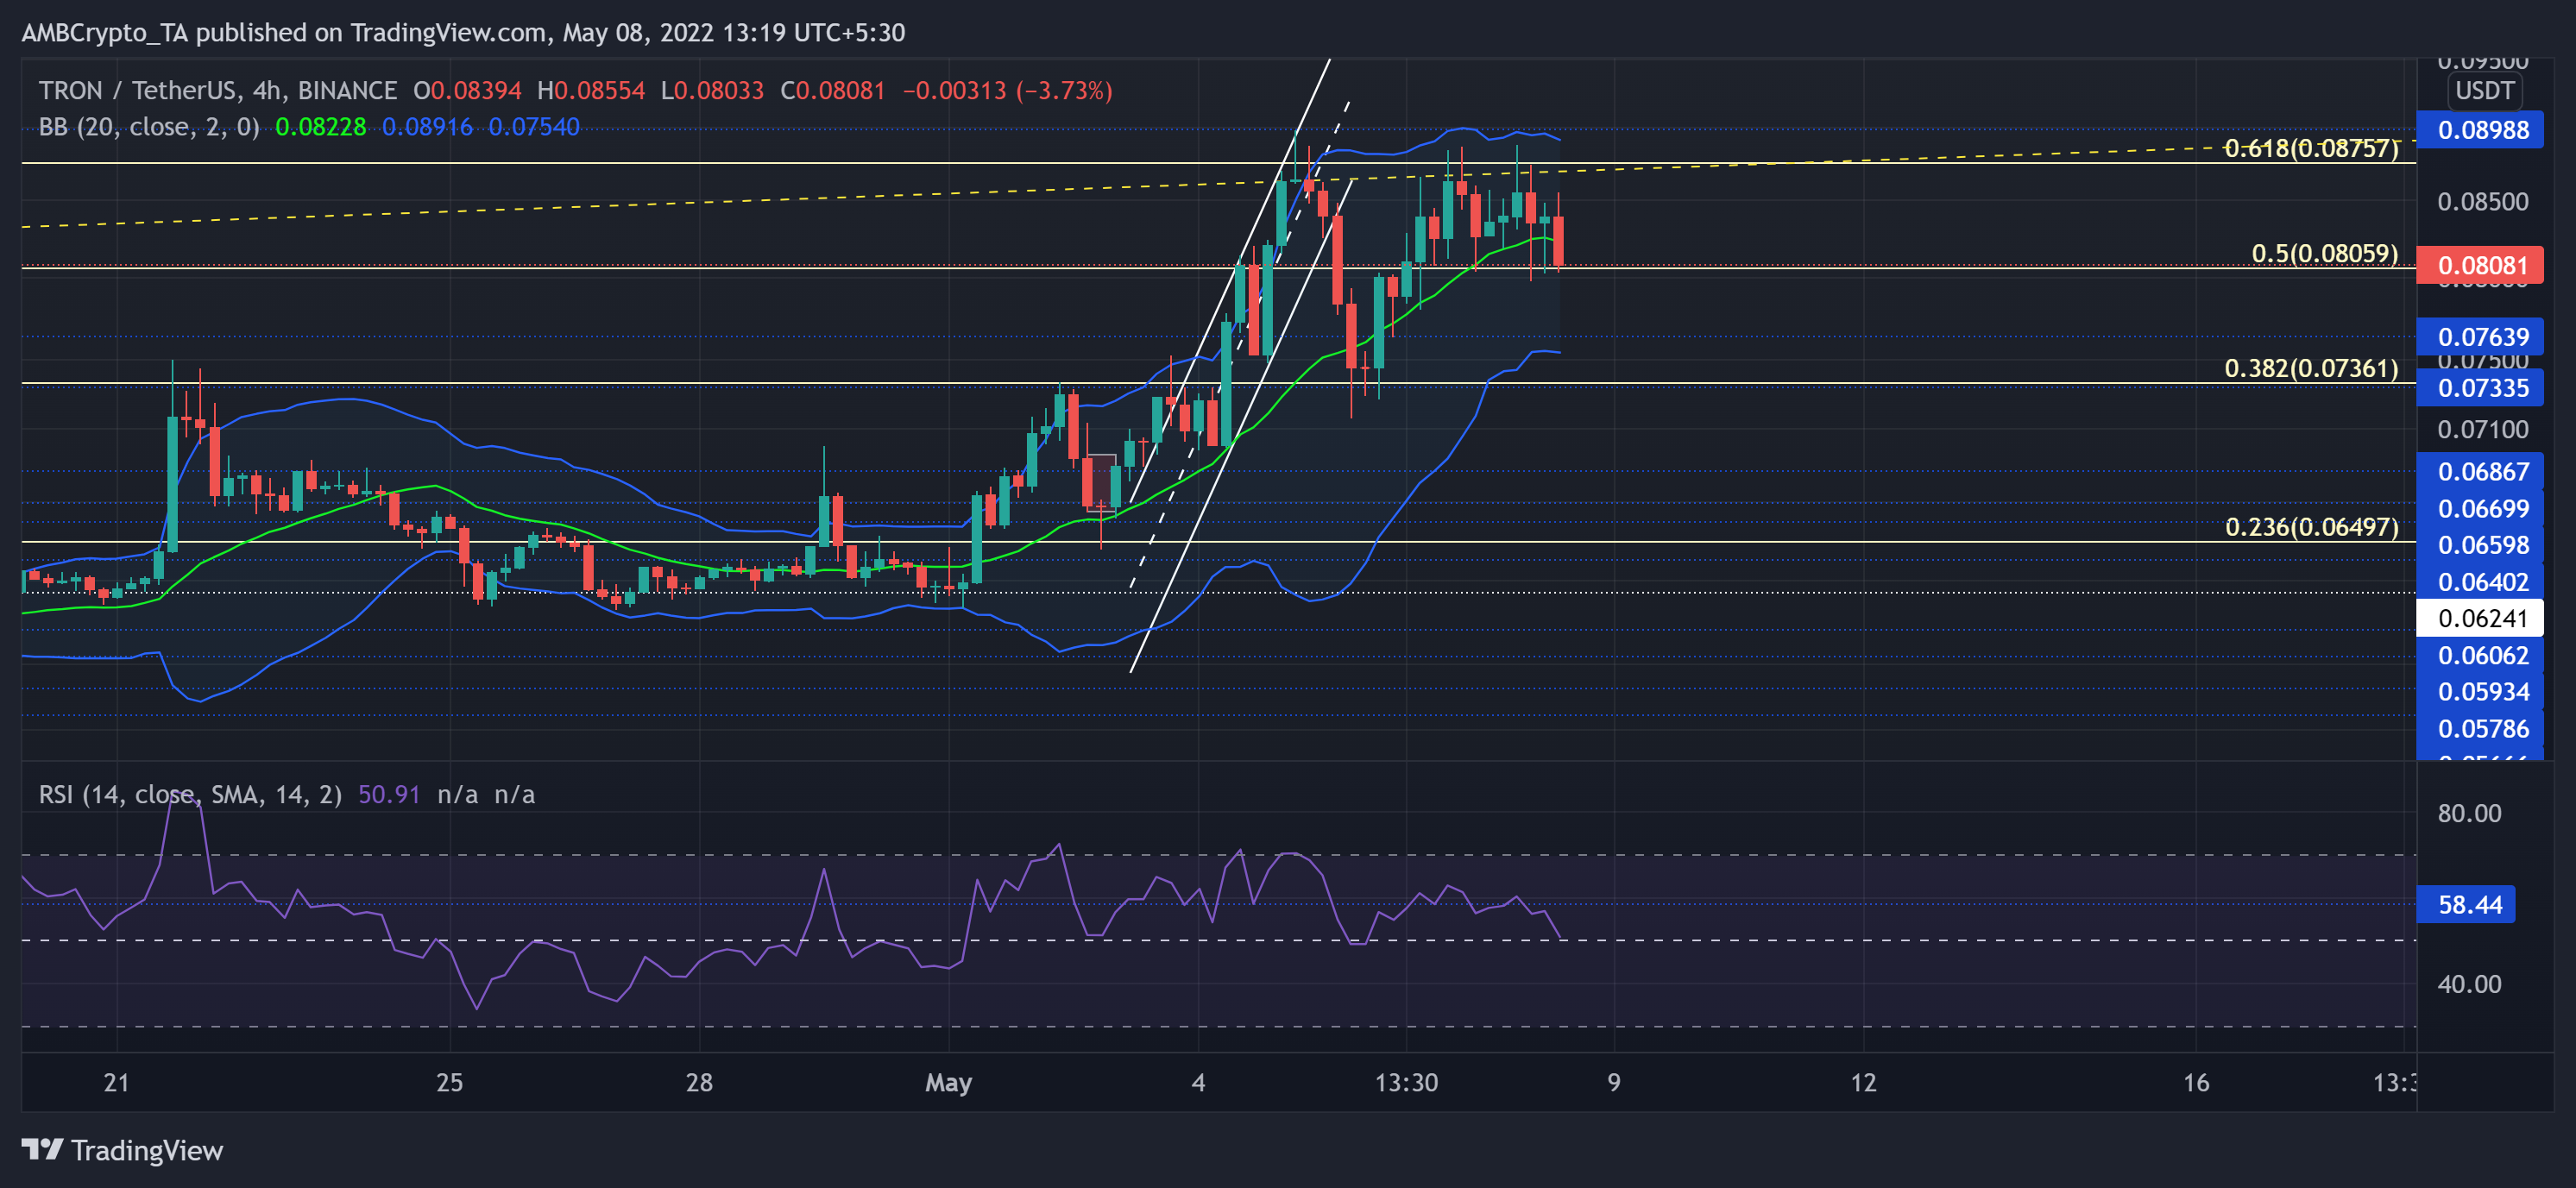
After lifting off from the $0.06-support, TRX made impressive progress on its chart. Higher lows alongside enduring highs beyond the 38.2% and 50% Fibonacci level fetched well-needed gains for the alt.
Then, as the price approached its multi-week trendline resistance (yellow, dashed), the alt quickly turned its back on it while breaking down from the up-channel. With the 61.8% level standing sturdy, TRX faced difficulties in prolonging its upswing. Now, as the price dropped from the upper band of the Bollinger Bands, the alt lost its basis line (green) support as the sellers reclaim their edge.
Near Protocol (NEAR)
As the ongoing narrative for NEAR visibly skewed in favor of bears, the sellers found fresher grounds to rest on over the last few weeks.
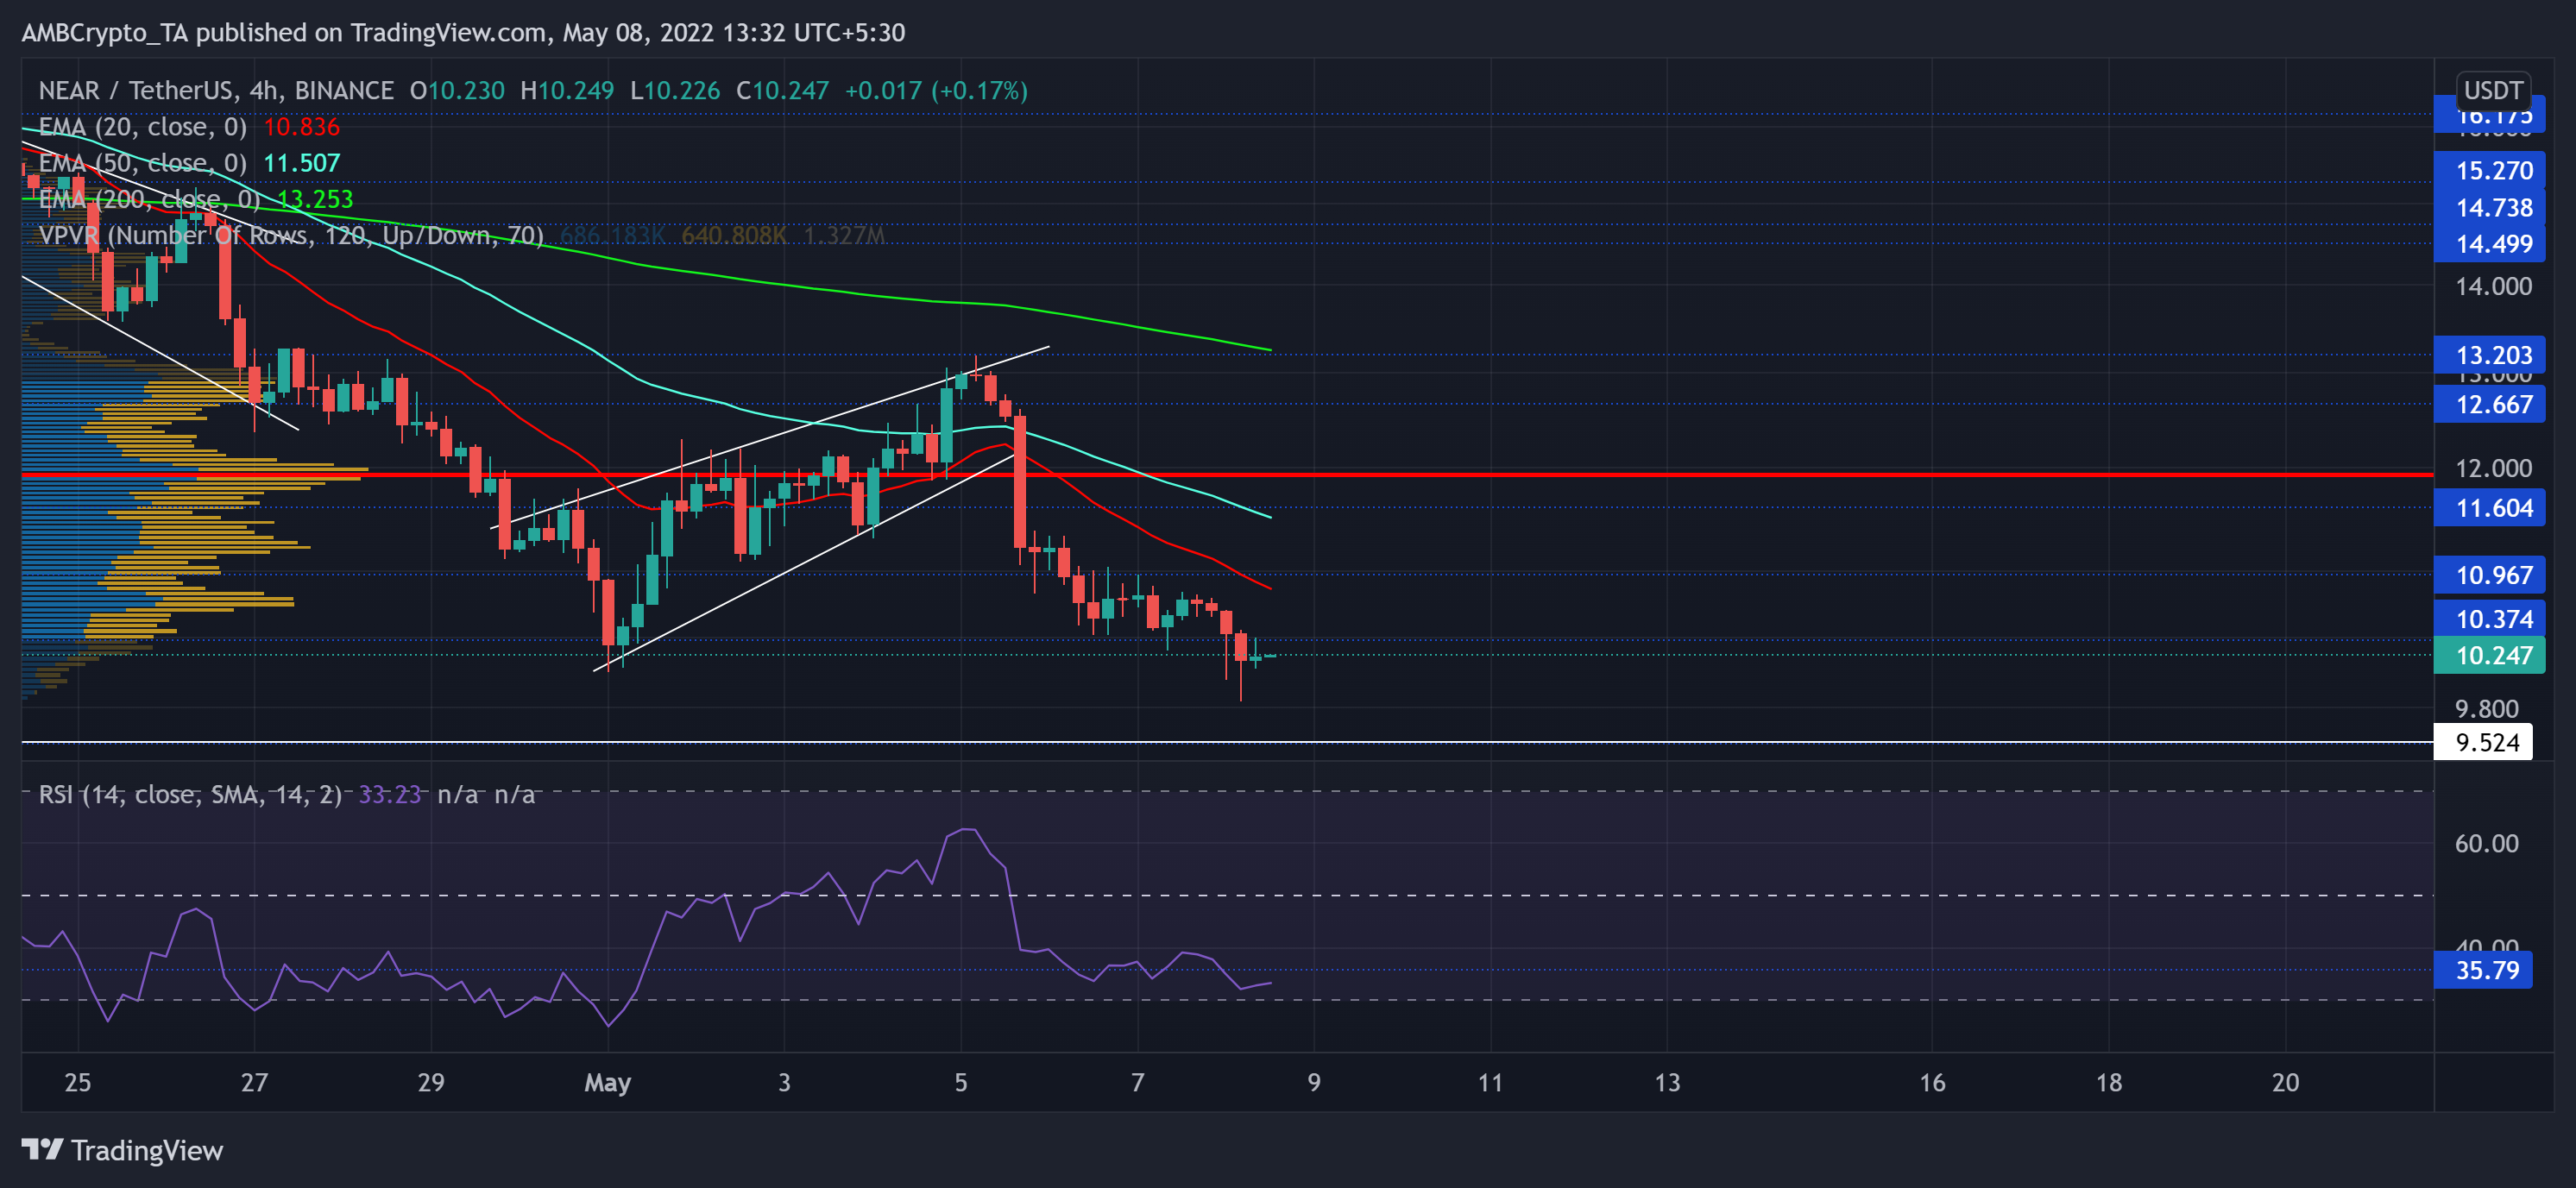
With the bears keeping a regular check on the alt’s peaks and lows, NEAR lost nearly half its value from its multi-week April highs. With the 20 EMA continuing its southbound trajectory, NEAR found it tough to uphold the vital Point of Control (red).
At press time, NEAR was trading at $10.247. Echoing with other alts, NEAR’s RSI saw slight improvements after drifting in the oversold region. From hereon, a close above the 35-mark would expose the alt to a stronger comeback.


