Cardano, Tron, VeChain Price Analysis: 29 December

After Bitcoin breached the $27,000 resistance, a minor correction soon followed. However, the pullback was not enough to deter Cardano and VeChain from rising higher on the charts. As ADA and VET scaled past several milestones, Tron moved in the opposite direction and registered a drop in price.
Cardano [ADA]
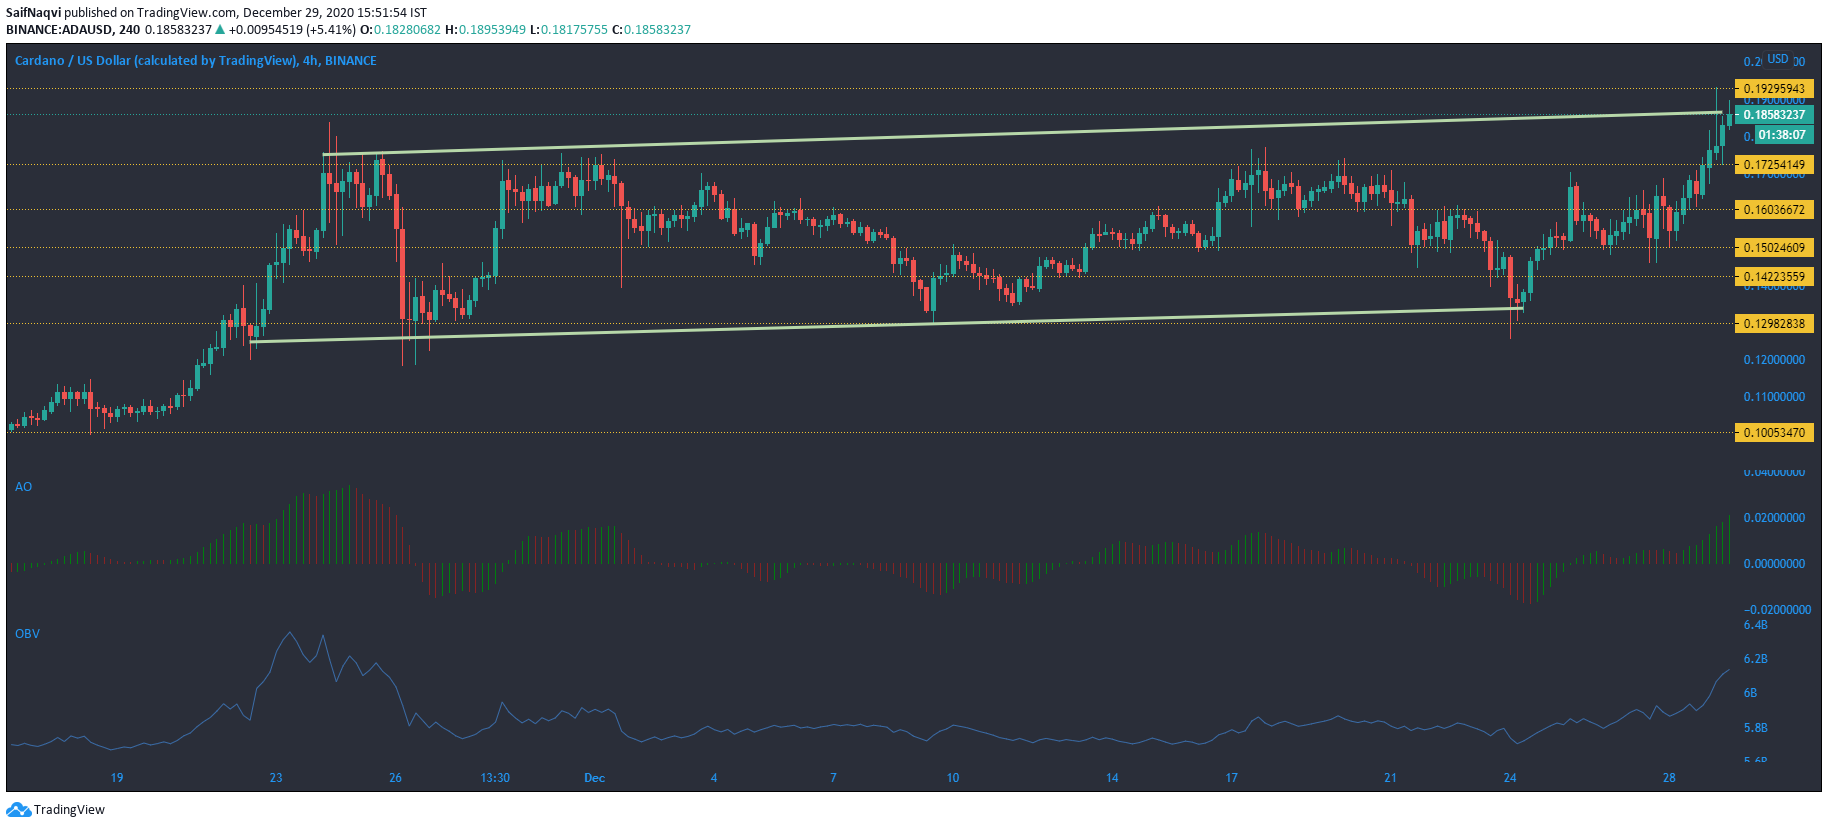
Resistance at $0.172 has been a key point for Cardano throughout the month of December. Despite multiple attempts, prices have been unable to go past this barrier as selling pressure pushed prices lower. Yesterday, however, was a turning point for the crypto asset, as prices surged above the stubborn resistance. At the time of writing, ADA was trading at $0.185, up 12.4% over the past 24 hours, and showed no signs of slowing down.
The Awesome Oscillator showed that the surge in price was backed by buying pressure. The green candles were indicative of the fact that bullish momentum was rising on the charts.
The On Balance Volume also registered an uptick, suggesting that the buyers in the market were pushing prices higher.
VeChain [VET]
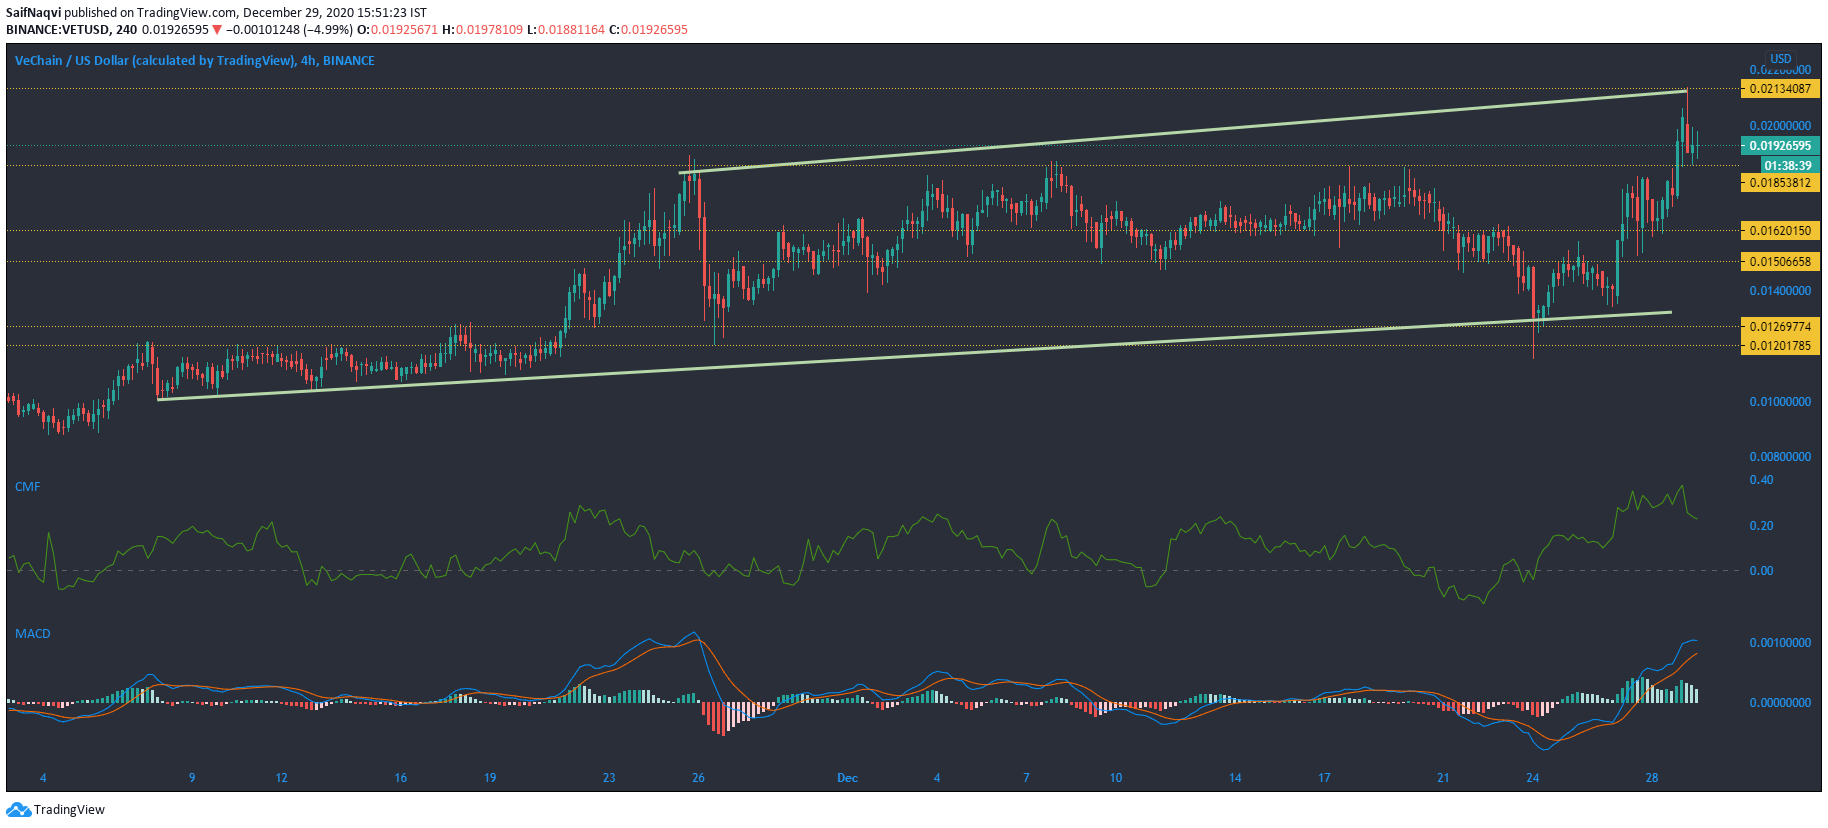
VeChain seems to have been one of the biggest beneficiaries of Bitcoin’s recent price surge. In the past two days, VeChain’s price has skyrocketed by over 50%, placing it among the biggest weekly gainers among the top 25 coins by market cap. The indicators also suggested that the bulls were in firm control of the market, which could be optimistic for the price moving forward.
The MACD indicated that bullish momentum was rising, with the fast-moving line moving well above the signal line.
Lastly, the Chaikin Money Flow suggested that capital inflows were pushing prices to higher levels, as the index rose in tandem with the candlesticks.
Tron [TRX]
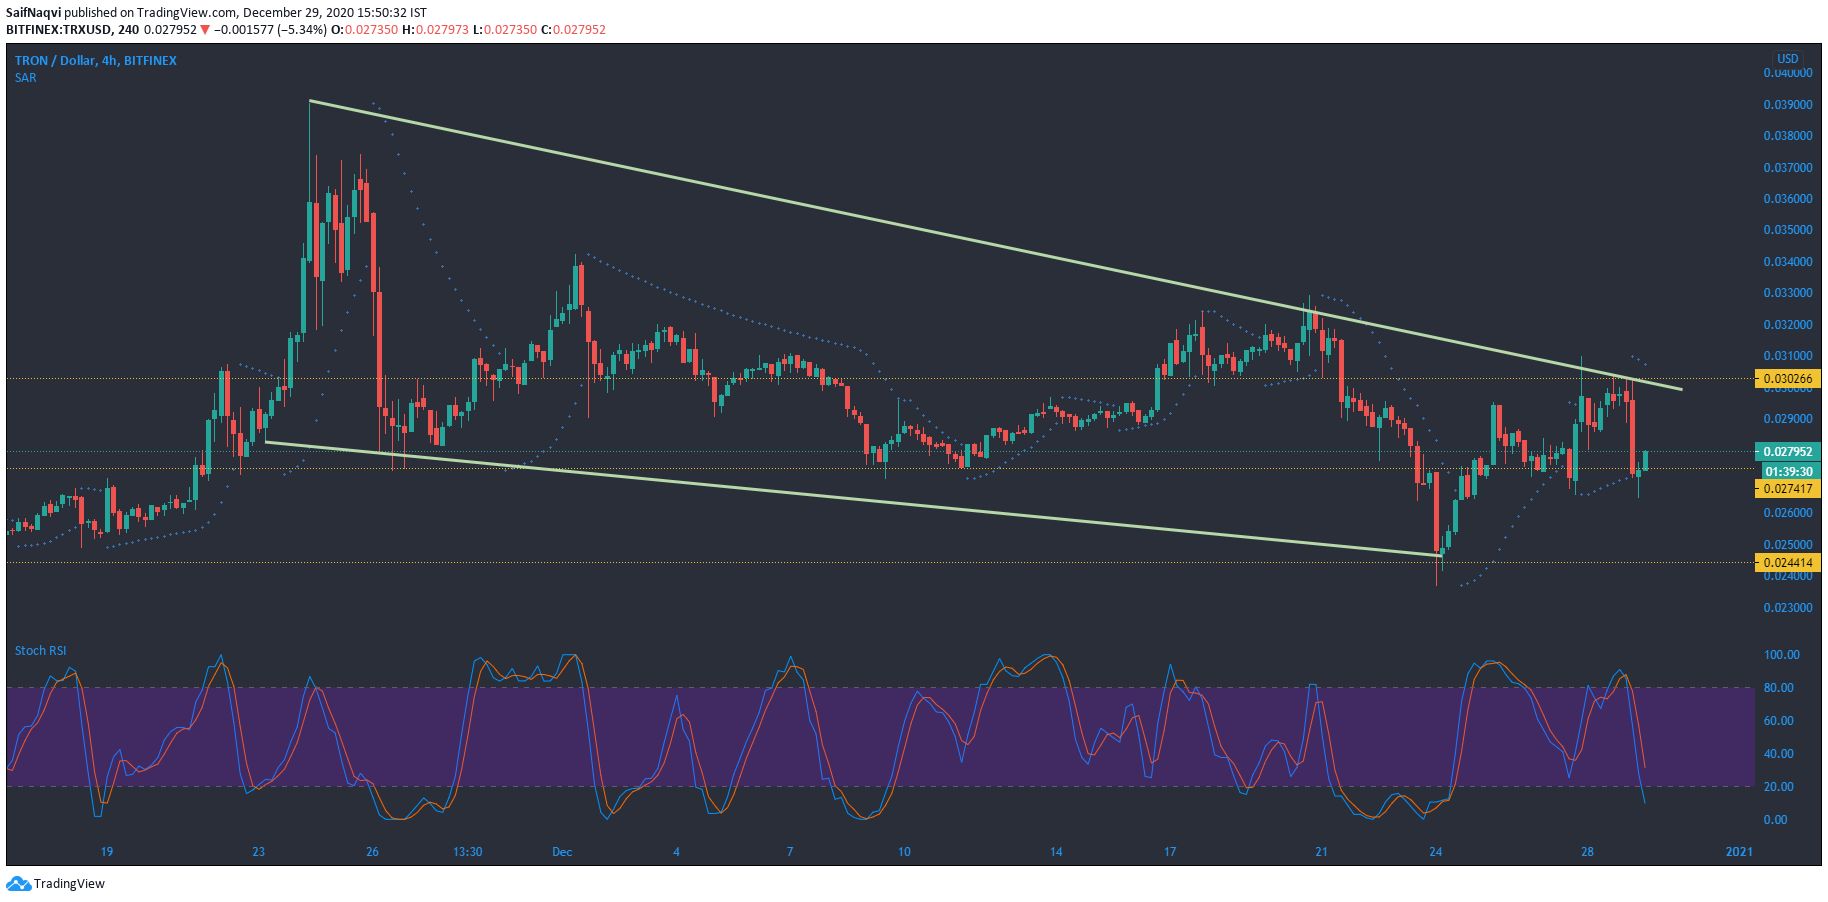
While Tron looked to have regained some of its lost momentum over the last week, prices reversed once again after meeting resistance at $0.03. During press time, the Ethereum rival was trading at $0.027, down by 5% in the past 24 hours. Certain indicators also reflected this price movement and gave the impression that the market bears could continue to drive prices lower on the charts.
The Parabolic SAR was dotted above the candlesticks and suggested bearishness for the crypto asset.
The Stochastic RSI also suggested the same bearishness as the prices were trading in the oversold zone. While a bounce back from this bearish region could be on the cards, prices could continue to trade in this territory over the next few sessions, before rising.


