Cardano: Where ADA’s price could head next after reaching its long-term support

Disclaimer: The findings of the following analysis are the sole opinions of the writer and should not be considered investment advice.
As anticipated in the previous article, Cardano’s [ADA] near-term revival saw a drawdown from its immediate supply zone near the $0.63-level. After jumping above key levels, the recent losses have pulled ADA below the resistance of its 20 EMA (red).
The ongoing trajectory would likely favor the sellers in the coming days. But an opportunity along the OBV could open a short trading window for the bulls.
At press time, ADA traded at $0.5145, down by nearly 10.34% in the last 24 hours.
ADA Daily Chart
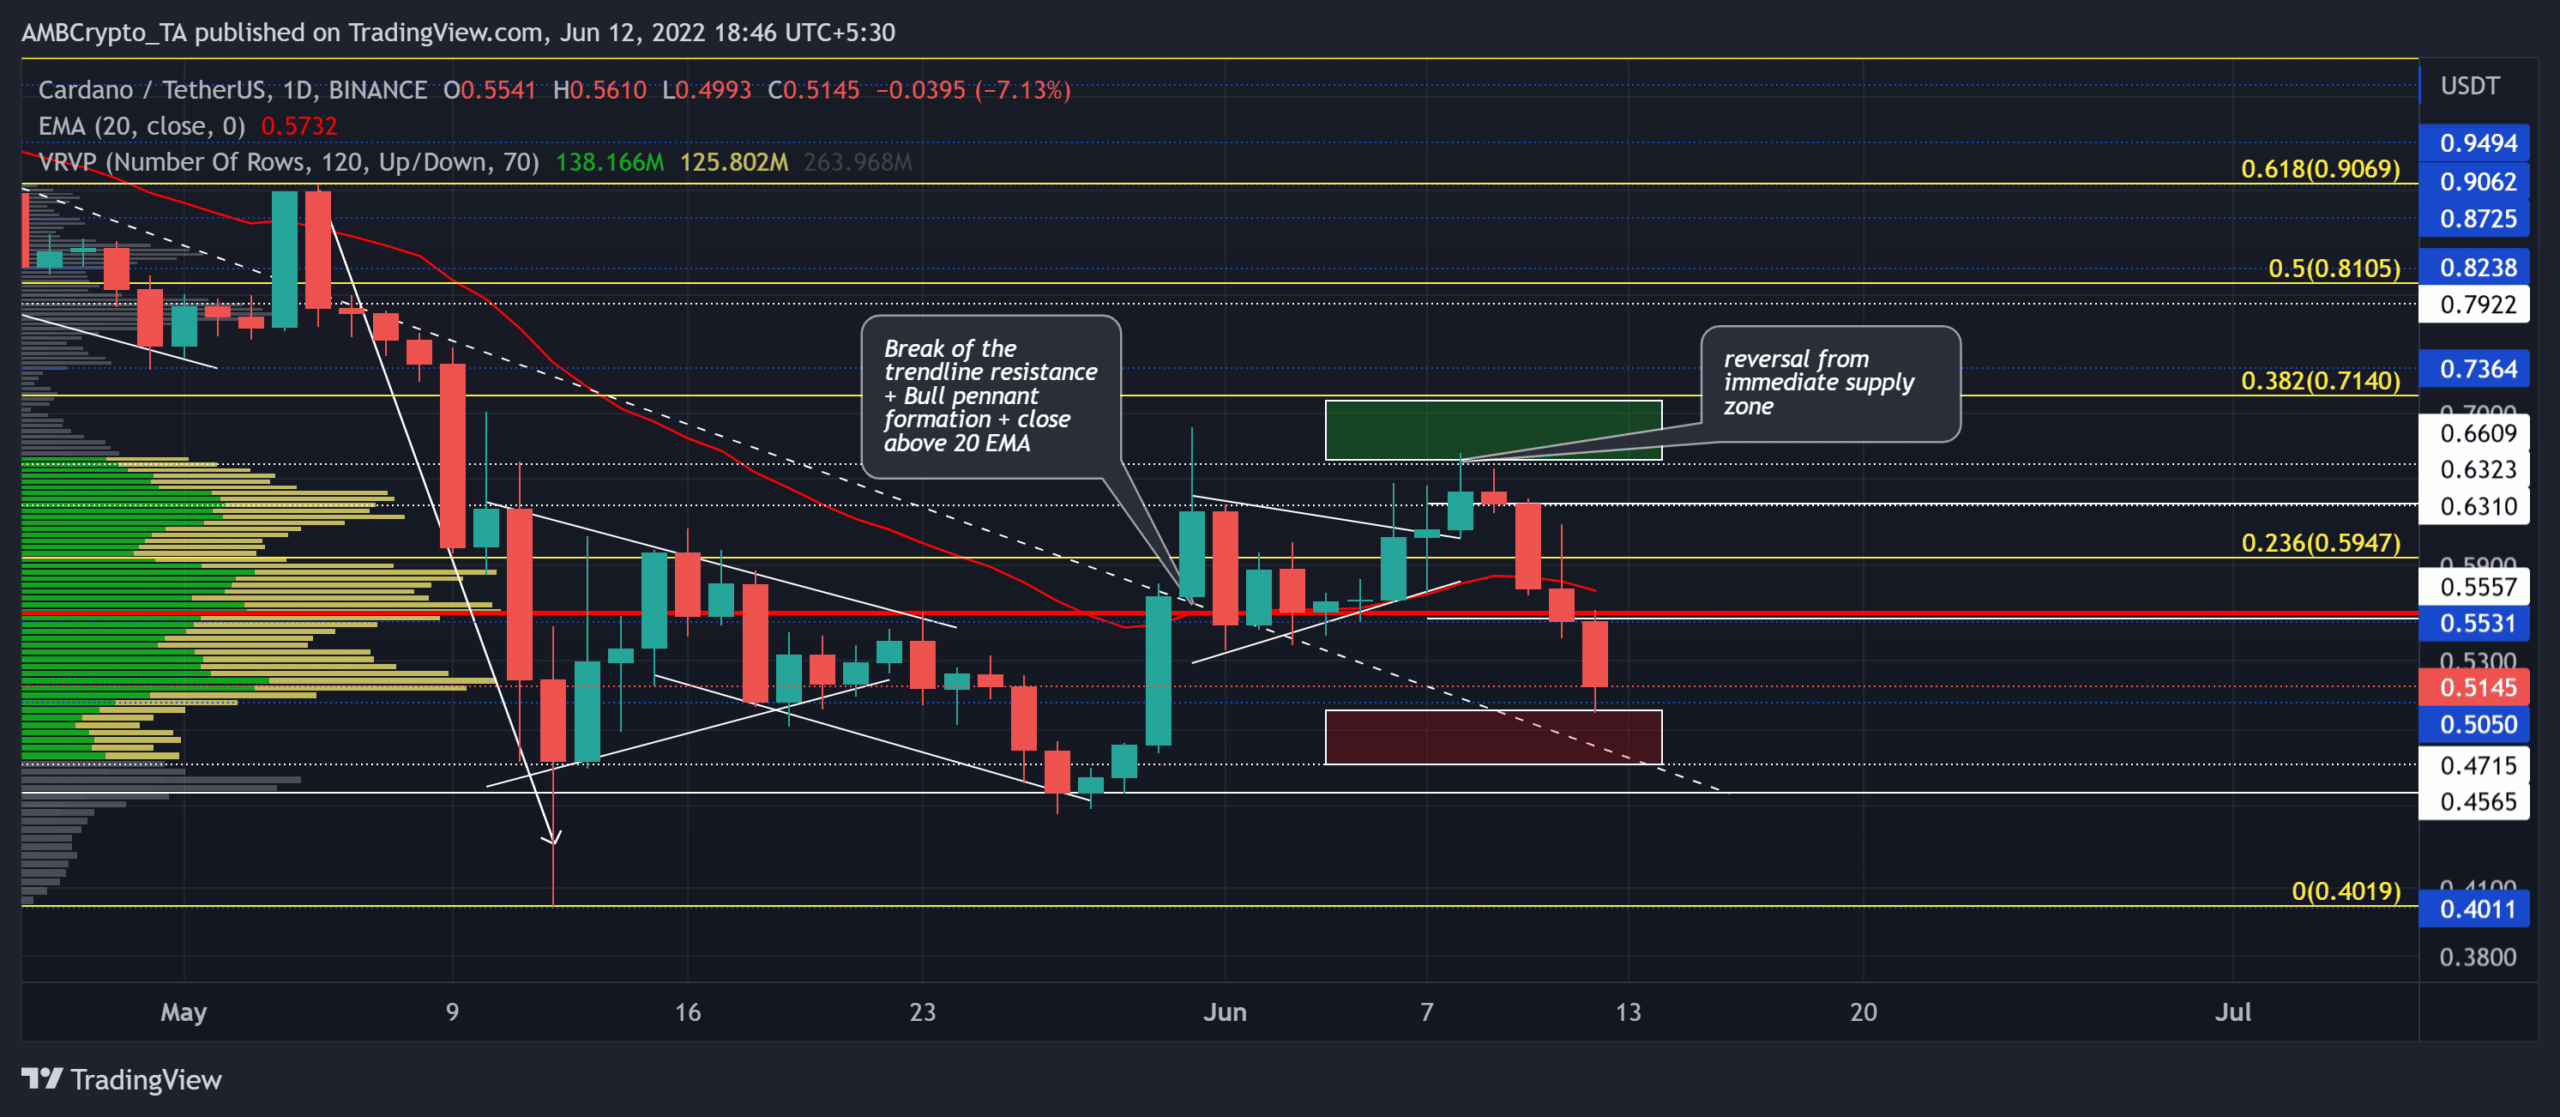
With the price action swopping below the 20 EMA, the short-term narrative for ADA flipped back toward the bearish side. The previous bullish efforts saw a decent effort saw a strong rejection of higher prices as the selling volumes registered a spike.
The bearish engulfing candlesticks alongside the south-looking 20 EMA have given the bears an added thrust to impede the buying efforts.
As the price action approaches its 16-month support in the $0.47-$5 range, any revival could open doorways for a recovery toward the Point of Control (POC, red). Looking at the current buying volumes, the bears could continue to assume control over the trend near the POC.
The two-month trendline support (white, dashed) coincided with the immediate demand zone to potentially provide a reliable testing range before a rebound.
Rationale

The Relative Strength Index (RSI) took a relatively bearish stance while aiming to test the 38-mark support. The investors/traders must watch for either a bounce-back or breach of this mark before placing bets.
Further, the OBV saw a bullish divergence after the indicator’s higher troughs over the last 12 days. A resurgence from its immediate trendline support could help buyers defend the immediate demand zone on the chart.
Conclusion
While the indicators tilted toward the bearish side, ADA could see a near-term revival from its demand zone. The POC level would likely help the bears maintain their edge in the coming sessions.
At last, traders/investors should keep a close watch on Bitcoin’s movement and its effects on the wider market to make a profitable move.


