CASHCAT surges 15%, but sellers lurk: What are the next key levels?
CashCat indicators show weak buying pressure as perpetual market capital shrinks.



Cash Cat [CASHCAT] has been on the rise in the past day, as the asset surged by 15%, a gain that came as the broader cryptocurrency market capitalization climbed within the same period.
A gain of this scale often indicates growing interest and the possibility that more capital is rotating into the asset. Yet, AMBCrypto’s analysis shows that Cash Cat’s recent gain could be a bull trap, and a reversal could follow.
Cash Cat rallies as volume surges
Strong momentum, tracked through trading volume, has pushed Cash Cat significantly higher in the past day.
Volume across the Spot and perpetual markets surged by more than 100% in the past day, crossing $63.96 million, according to CoinGlass.
On the chart, this pushed the asset above the resistance level of a descending triangle channel, a breakout that could support a further price increase.
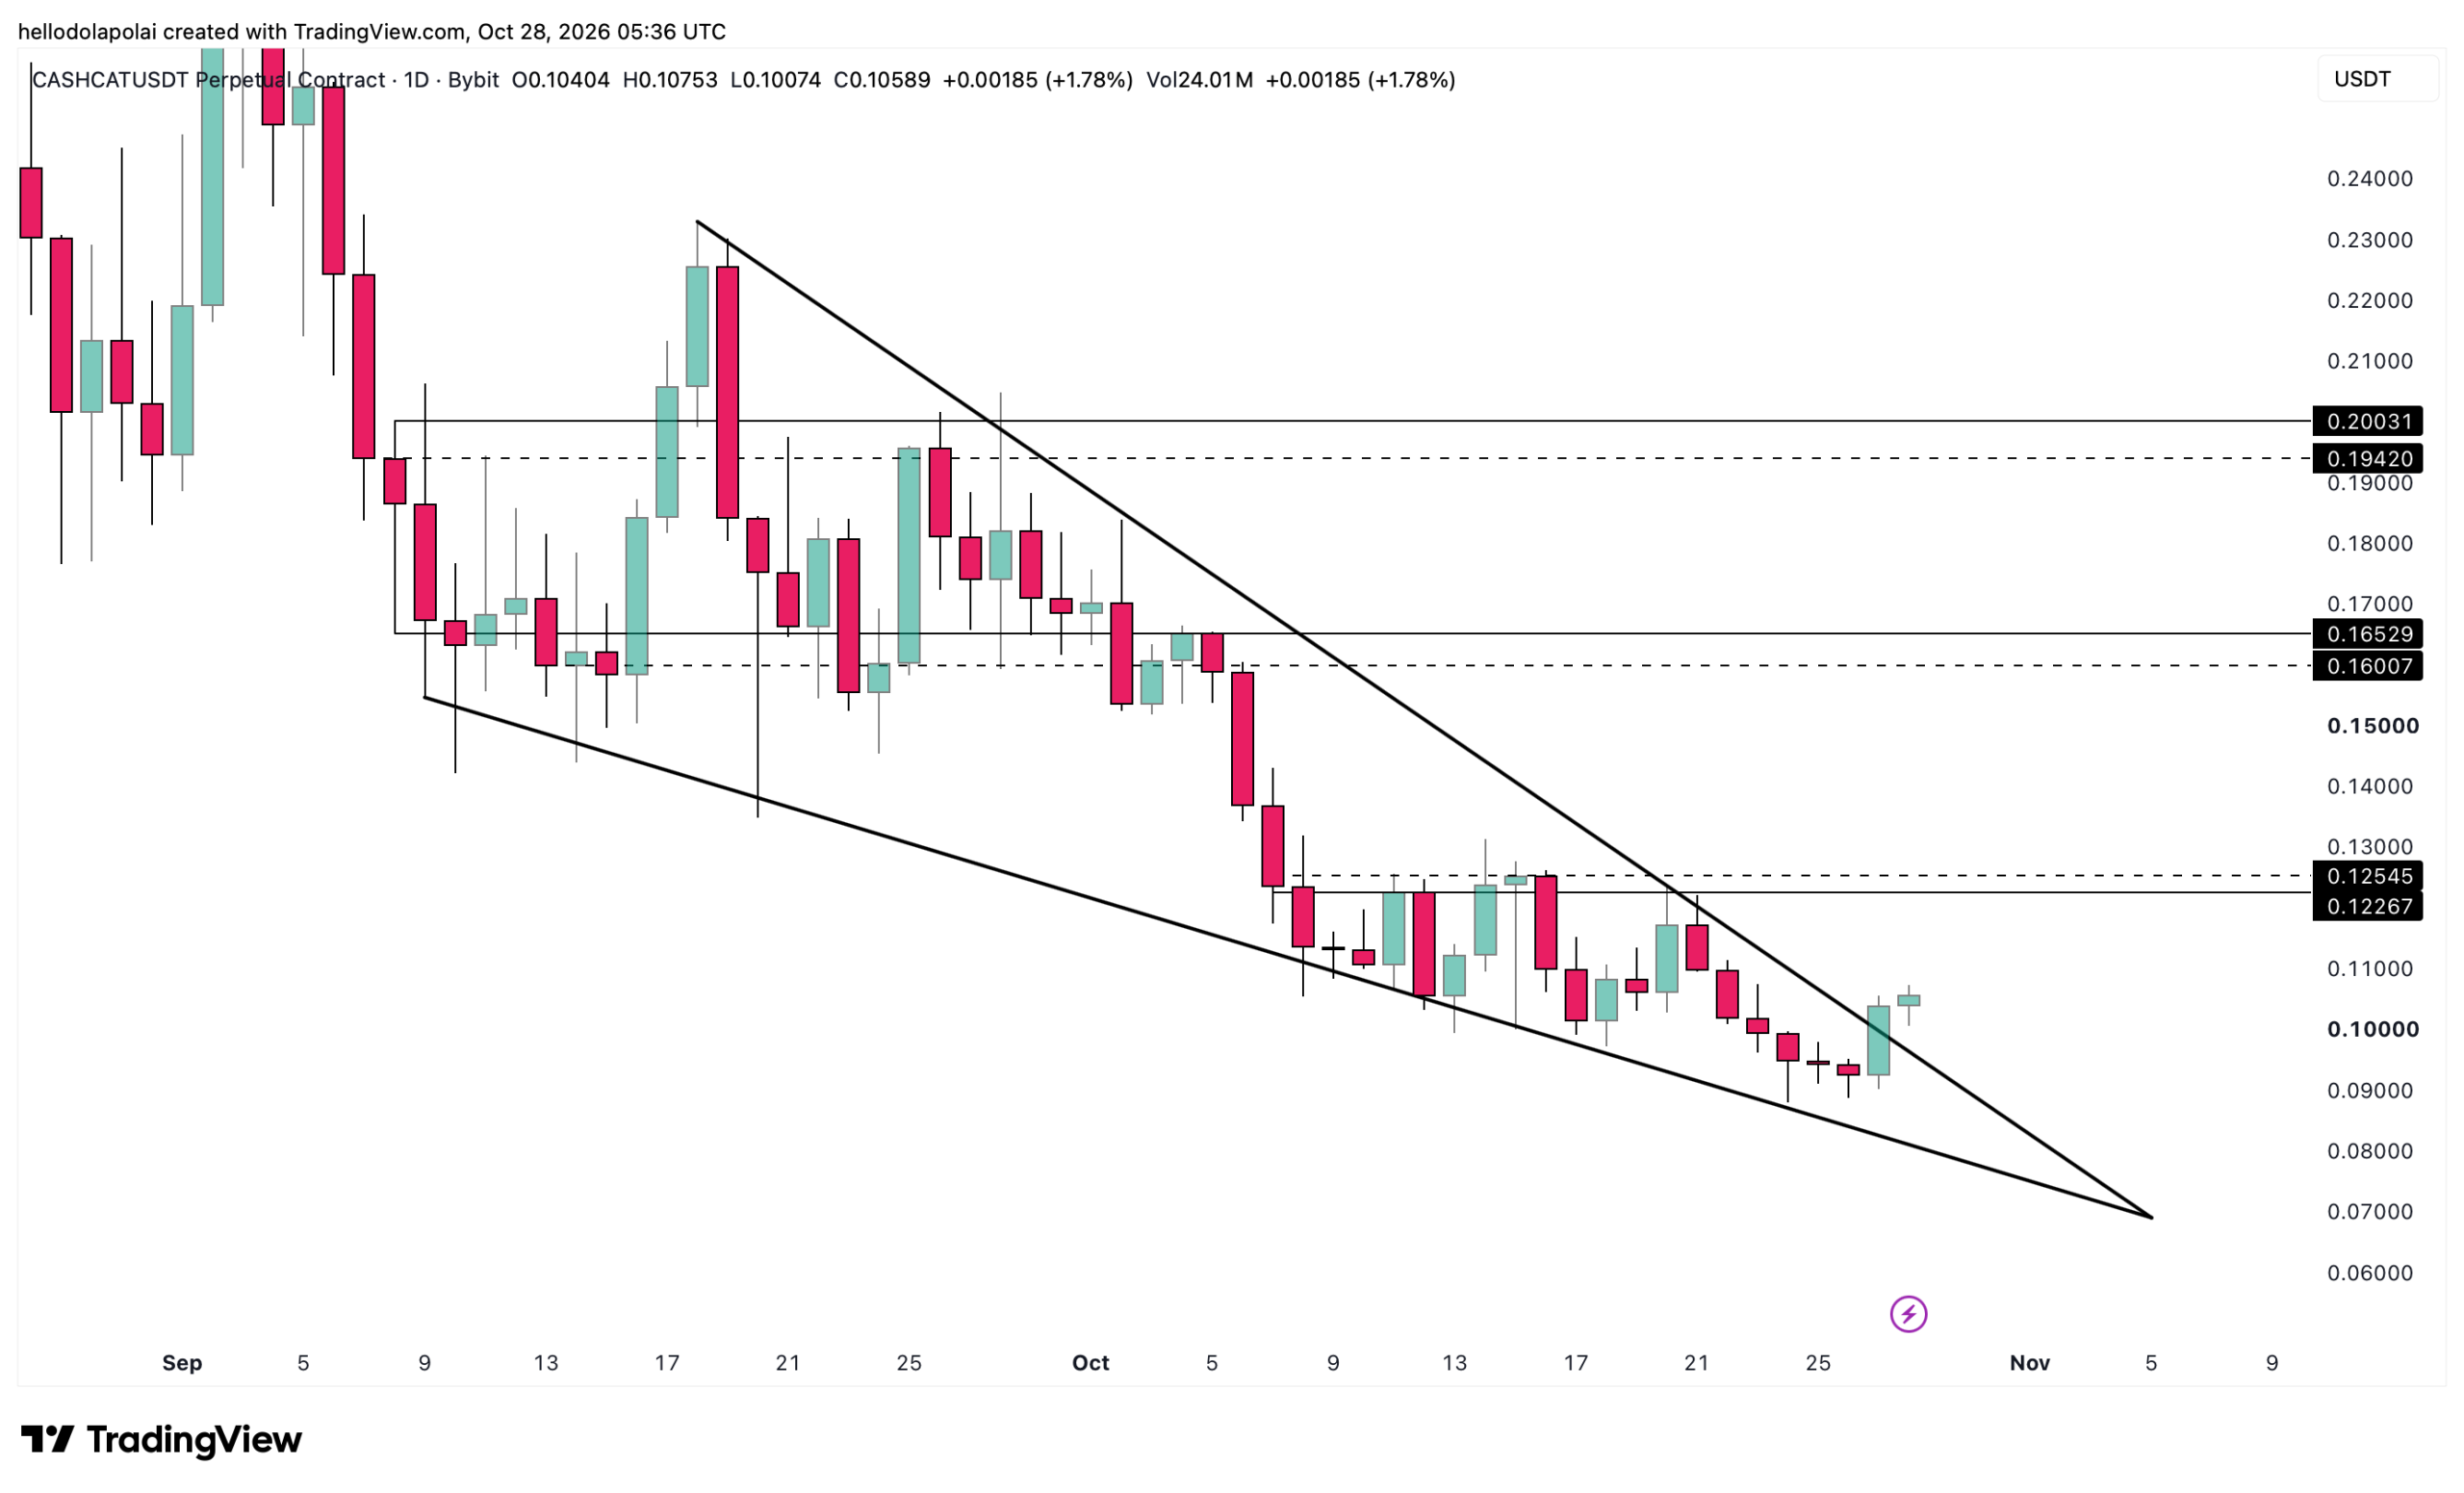
If the uptrend continues, there are levels worth monitoring, as marked on the chart. These are $0.12, $0.16, and $0.19.
Notably, while these levels remain potential targets for the price rally, the asset could face resistance at these points, which could lead to a pullback.
Indicators point to weakening momentum
Indicator analysis shows weakness in Cash Cat’s price rally. The Aroon Indicator, which tracks momentum, shows that the Aroon Down line is above the Aroon Up line.
The Aroon Indicator uses the Aroon Up (orange) and Aroon Down (blue) lines to track momentum and potential trend changes.
Currently, the Aroon Down line is above the Aroon Up line, suggesting that sellers could still influence the price and that the recent rally could be followed by a decline.
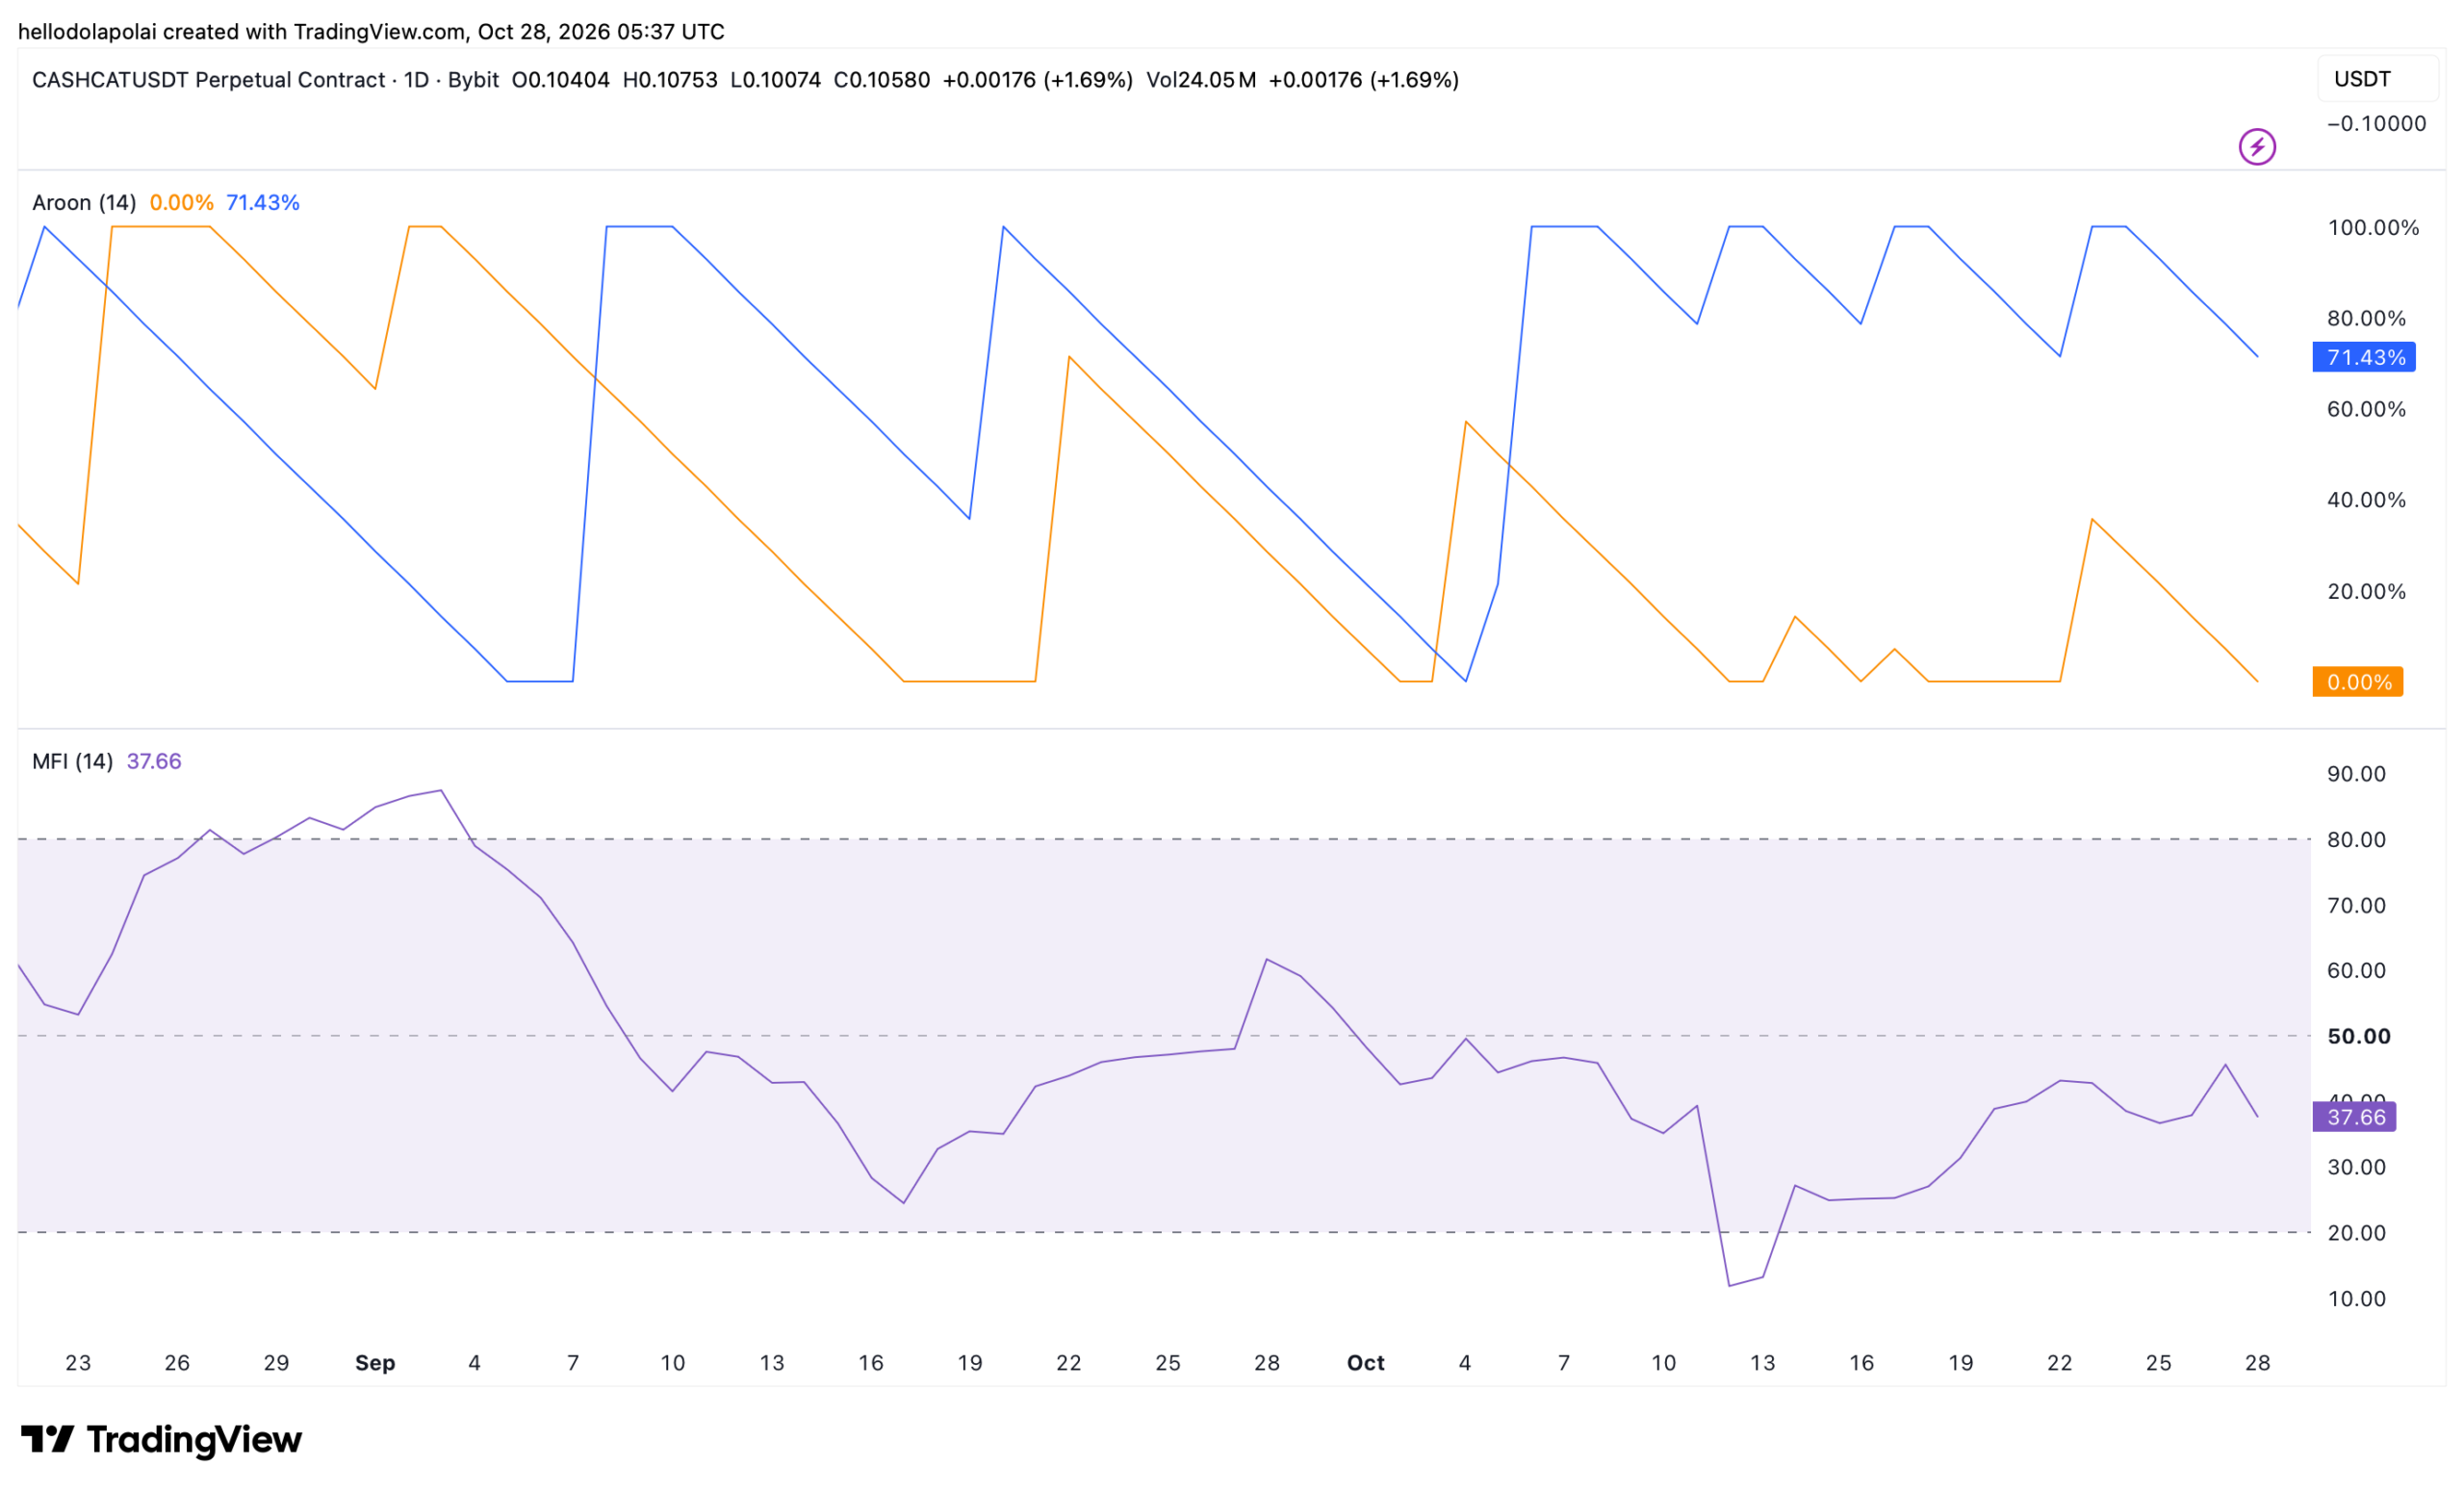
There has also been a shift in capital flows, with money moving out of the market. The Money Flow Index (MFI), which tracks buying and selling pressure, has dropped into its bearish zone.
On the chart, the MFI’s bearish zone is marked between 20 and 50, suggesting weakening buying pressure. If capital outflows continue, the price could come under further pressure.
Perpetual outflows raise reversal risks
Perpetual market netflow data shows that more capital has flowed out of the market than into it over the past 24 hours.
CoinGlass reported roughly $12.42 million in sales, bringing the asset’s netflow to -$548,260. When capital flows out of the perpetual market during a price rally, it could point to profit-taking.
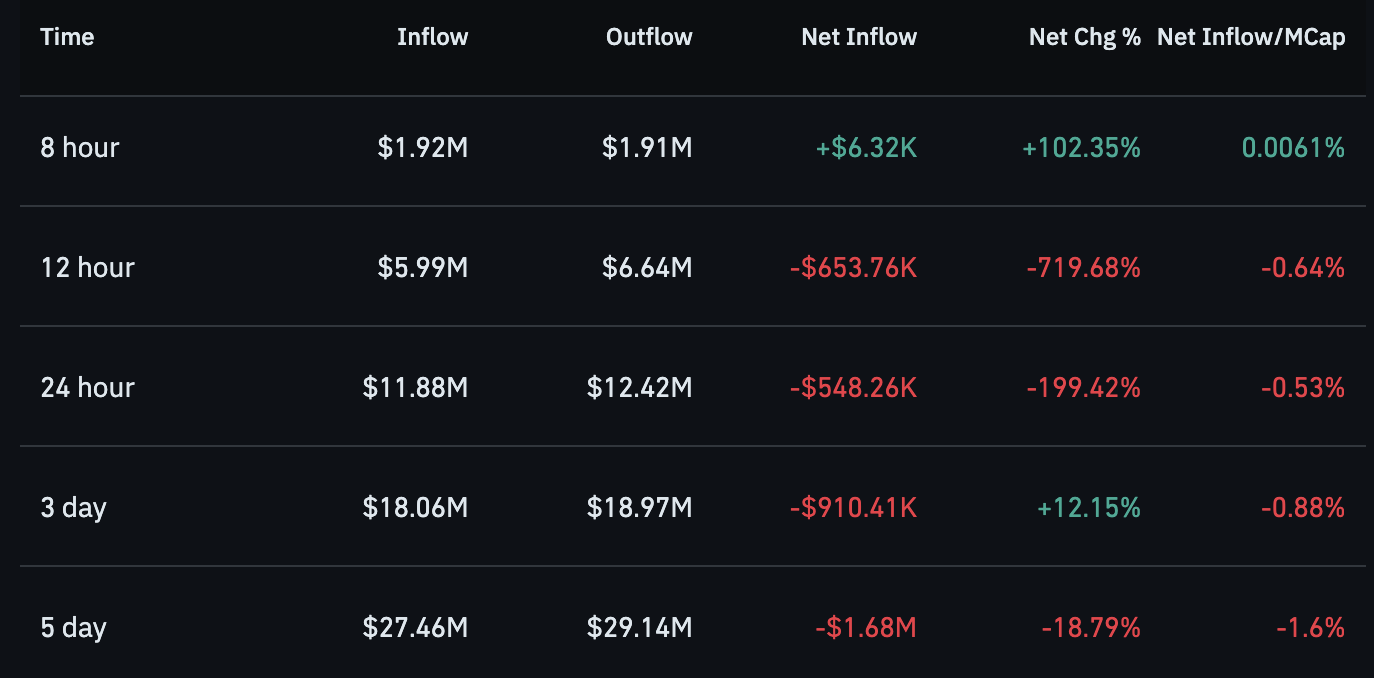
However, the Funding Rate has remained positive, suggesting that positioning in the perpetual market has not yet turned bearish.
For now, the indicators suggest that CASHCAT’s rally could be a bull trap, with the asset at risk of a significant decline in the near term.
Final Summary
-
Cash Cat surged 15% as trading volume across Spot and perpetual markets rose above $63.96 million.
-
The Aroon Indicator, MFI, and negative perpetual market netflow point to selling pressure that could trigger a price reversal.