CCIP launch sparks development frenzy on Chainlink network
Chainlink's development activity has grown since it announced the mainnet launch of its Cross-Chain Interoperability Protocol (CCIP) on Avalanche, Ethereum, Optimism and Polygon networks on 17 July.

- Development activity on Chainlink has grown since its CCIP mainnet launch.
- Key momentum indicators on the daily chart hinted at a good period to accumulate LINK.
Development activity on leading oracle network Chainlink [LINK] has rallied since the early access mainnet launch of its Cross-Chain Interoperability Protocol (CCIP) on 17 July, data from Santiment showed.
Read Chainlink’s [LINK] Price Prediction 2023-24
🧑💻🔗 #Chainlink has been rising in development activity rate, and is up to the #4 spot in #crypto by this measurement. Our latest insight shows the 3-year trends of development activity from the top 10 projects, including $DOT, $ADA, $FIL, $ATOM, & $ICP. https://t.co/lvFJo9sH6p pic.twitter.com/sgbX9XCF7G
— Santiment (@santimentfeed) September 13, 2023
According to the CCIP documentation, the product was introduced to address the connectivity challenge between blockchain networks. The web3 ecosystem “has become multi-chain, with the rise of layer-1 blockchains and layer-2 scaling solutions”.
However, these networks operate in isolation and face limitations in communicating with traditional systems and other blockchains. Chainlink CCIP was designed to bridge this gap and facilitate asset transfers and information exchange between multiple blockchains.
Santiment’s development activity metric tracks the activity on a project’s public GitHub repositories. This metric is a good indicator of a project’s commitment to development and its likelihood of being an exit scam.
At 403 at press time, Chainlink’s development activity has grown by 53% since 19 July.
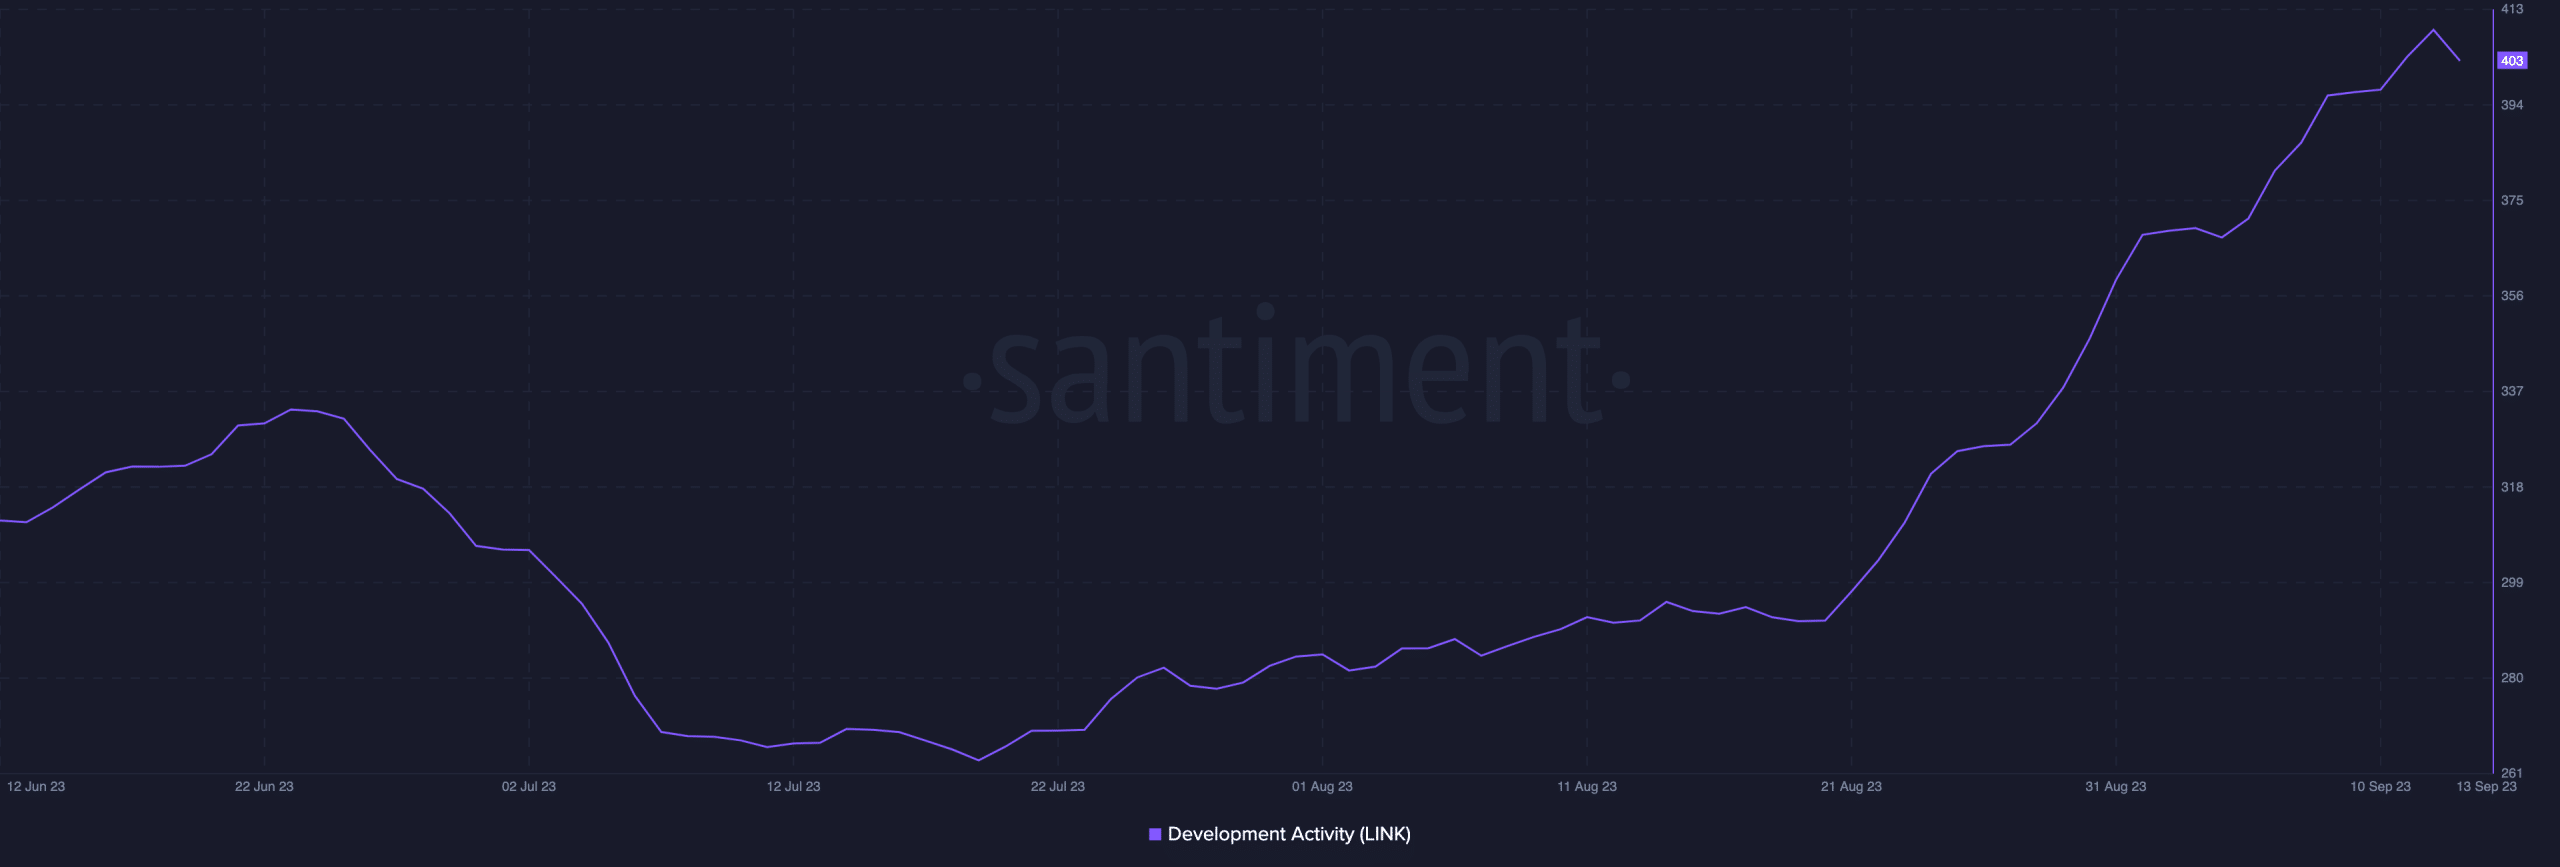
The code commits level on Chainlink – which measures the number of code changes made to the core codebase – has grown by over 50% in the last week, according to data from Token Terminal.
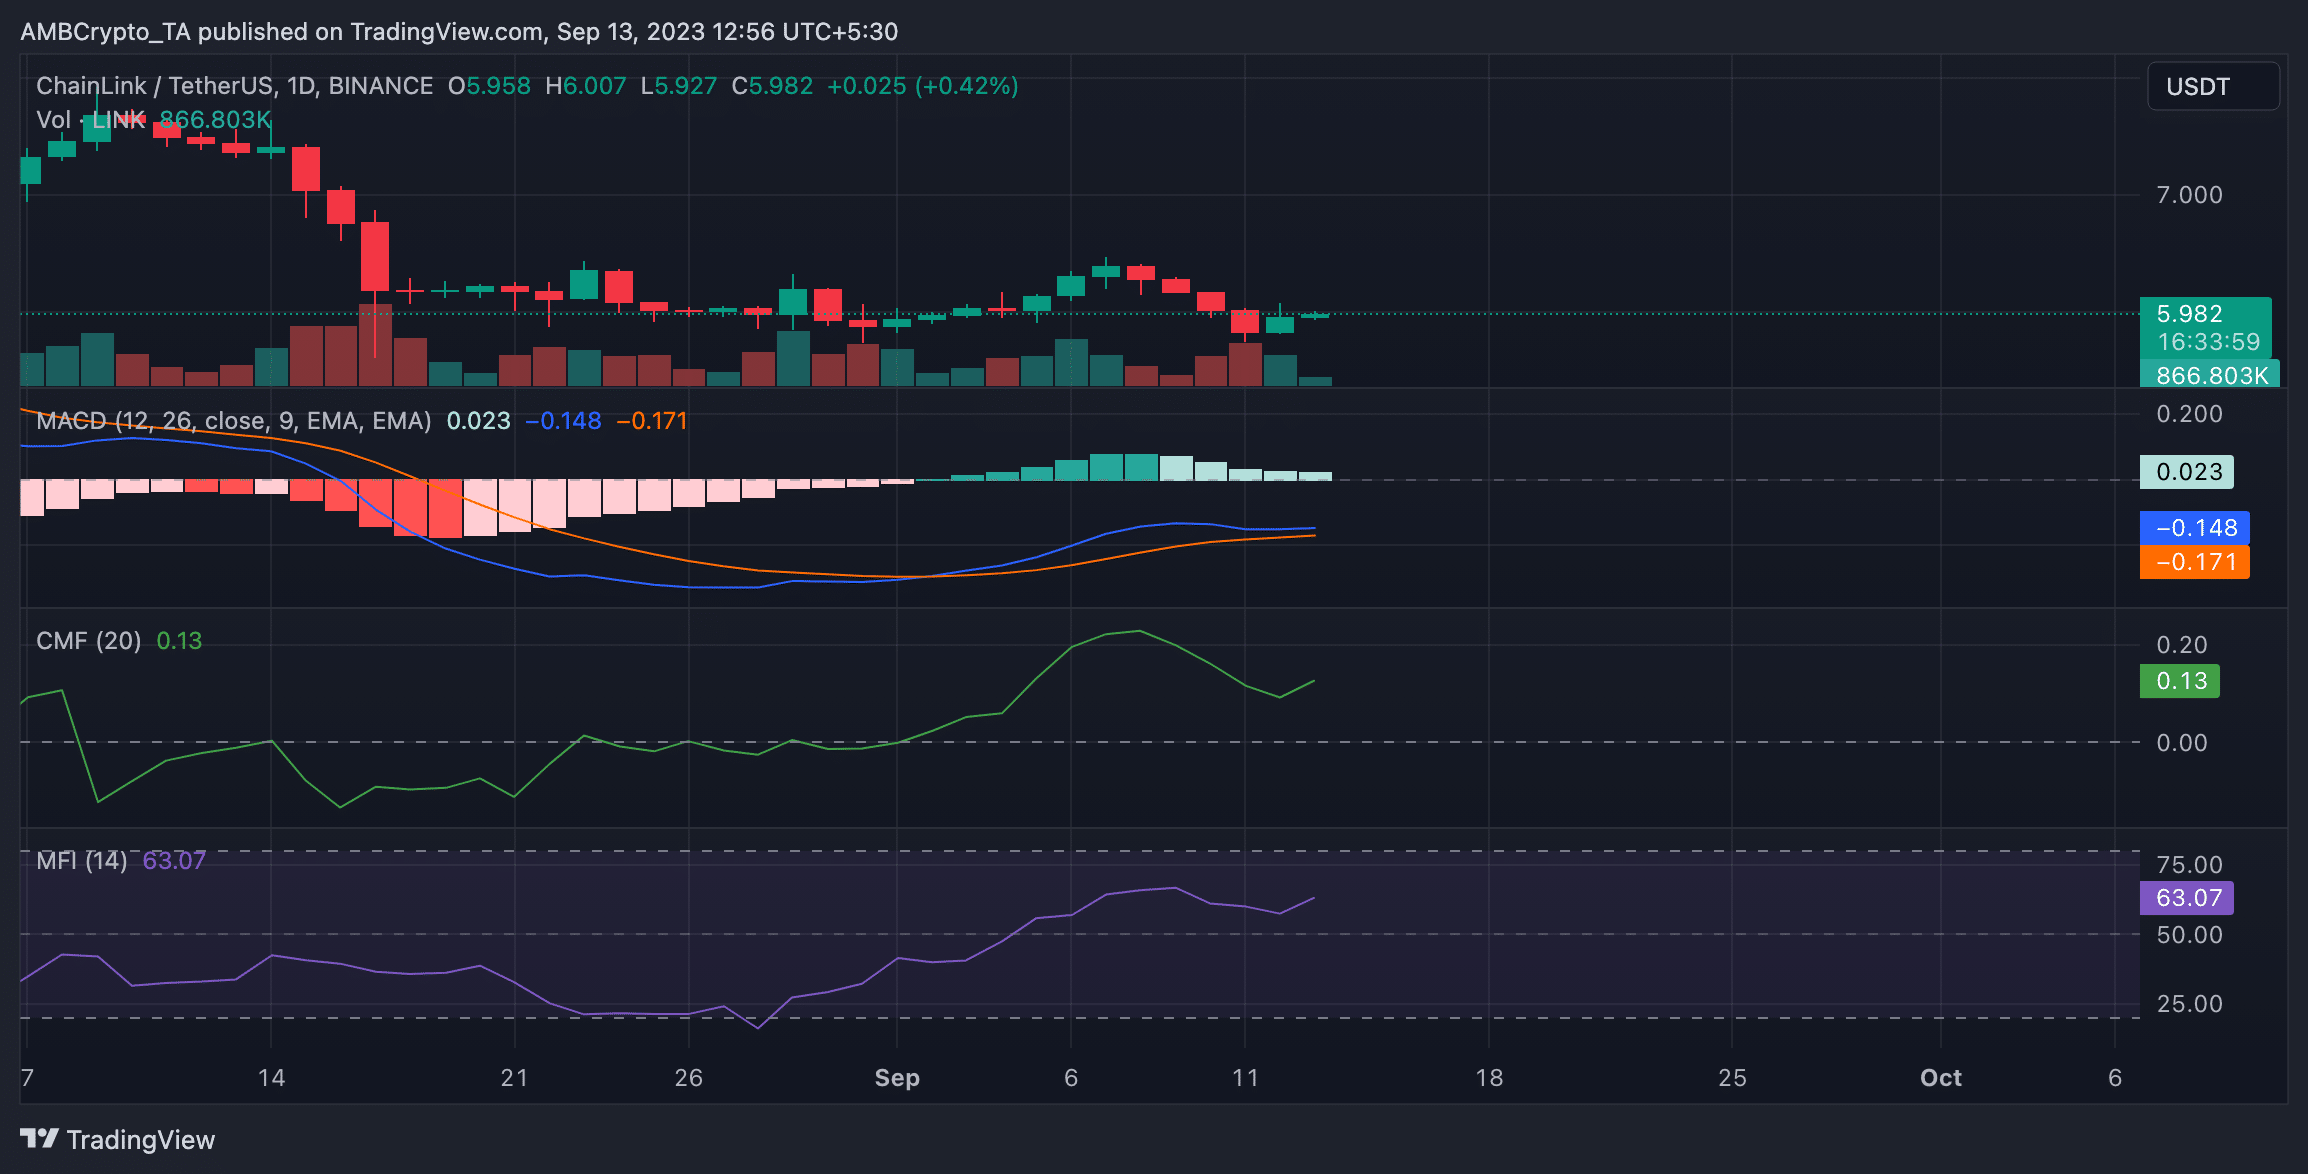
A buy signal?
As of this writing, LINK traded at $5.97. The token’s price has declined steadily since 8 September. However, as the price trended downward, readings from the alt’s key momentum indicators observed on a daily chart suggested an inflow of liquidity into the spot market.
For example, LINK’s Chaikin Money Flow (CMF) remained positioned above the zero line despite the price fall in the last week. At press time, the indicator returned a positive 0.13, suggesting that although LINK’s value has dawdled in the last few days, the market has continued to see capital inflow.
A CMF buy signal presents itself when an asset’s price embarks on a downtrend while its CMF diverges with a higher low and climbs.
Realistic or not, here’s LINK’s market cap in BTC terms
Further, LINK’s Money Flow Index (MFI) has also seen an uptick during the same period. This indicator measures the amount of money flowing into and out of an asset. At 63.07 and positioned upward at press time, LINK’s spot markets remained service with liquidity.
Moreover, LINK’s Moving Average Convergence/Divergence indicator (MACD) signaled that a new bullish cycle was underway and has been since 3 September. The MACD line remained positioned above the trend line at press time, and the indicator was marked by just green histogram bars.