- Celestia showed bearish sentiment in the near-term.
- The price action on the daily chart gave an early signal of a trend shift.
Celestia [TIA] had a strong bullish run in November and December 2023, but its progress was halted at the $15-$20 zone in the first half of February.
Since then, the token has relentlessly trended downward, losing 70% over the past five months.
There was an early signal that this downtrend might begin to shift. So, it remains to be seen whether bulls can drive a recovery, but here’s what traders need to consider before looking to take trade positions.
A bullish break for Celestia
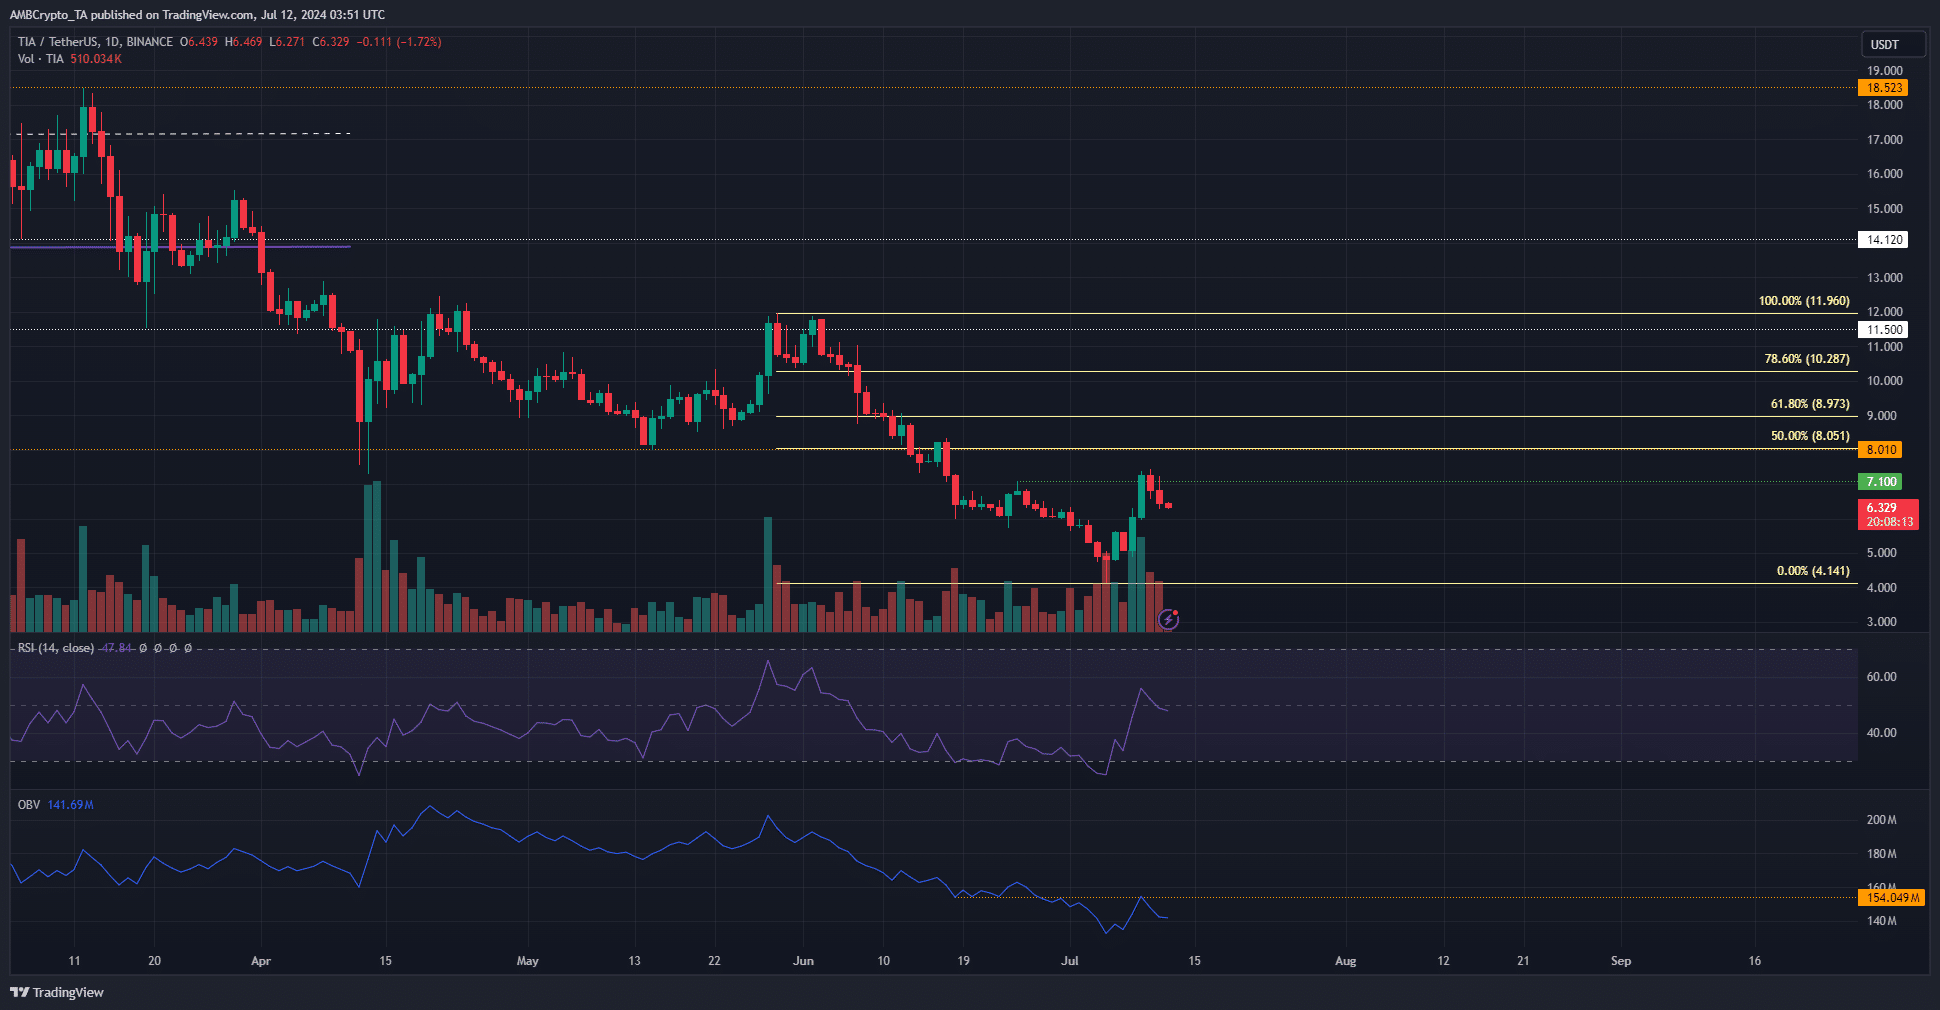
Source: TIA/USDT on TradingView
The downtrend of TIA took a break in April and May and appeared to form a range between $8 and $12. In mid-June, the $8 support level was broken and flipped to resistance.
The OBV, which had been rising in the latter half of May, also slid quickly alongside prices.
The bulls might see some respite once again. The most recent lower high was at $7.1, and on the 9th of July, TIA closed a daily trading session above this level, indicating a market structure shift.
The RSI also jumped above neutral 50 to indicate bullish momentum might take over.
However, the OBV was unable to clear a local resistance, which meant that the buying pressure was not high enough to drive a rally. This might see TIA consolidate around the $6-$8 zone.
Futures traders bearishly poised
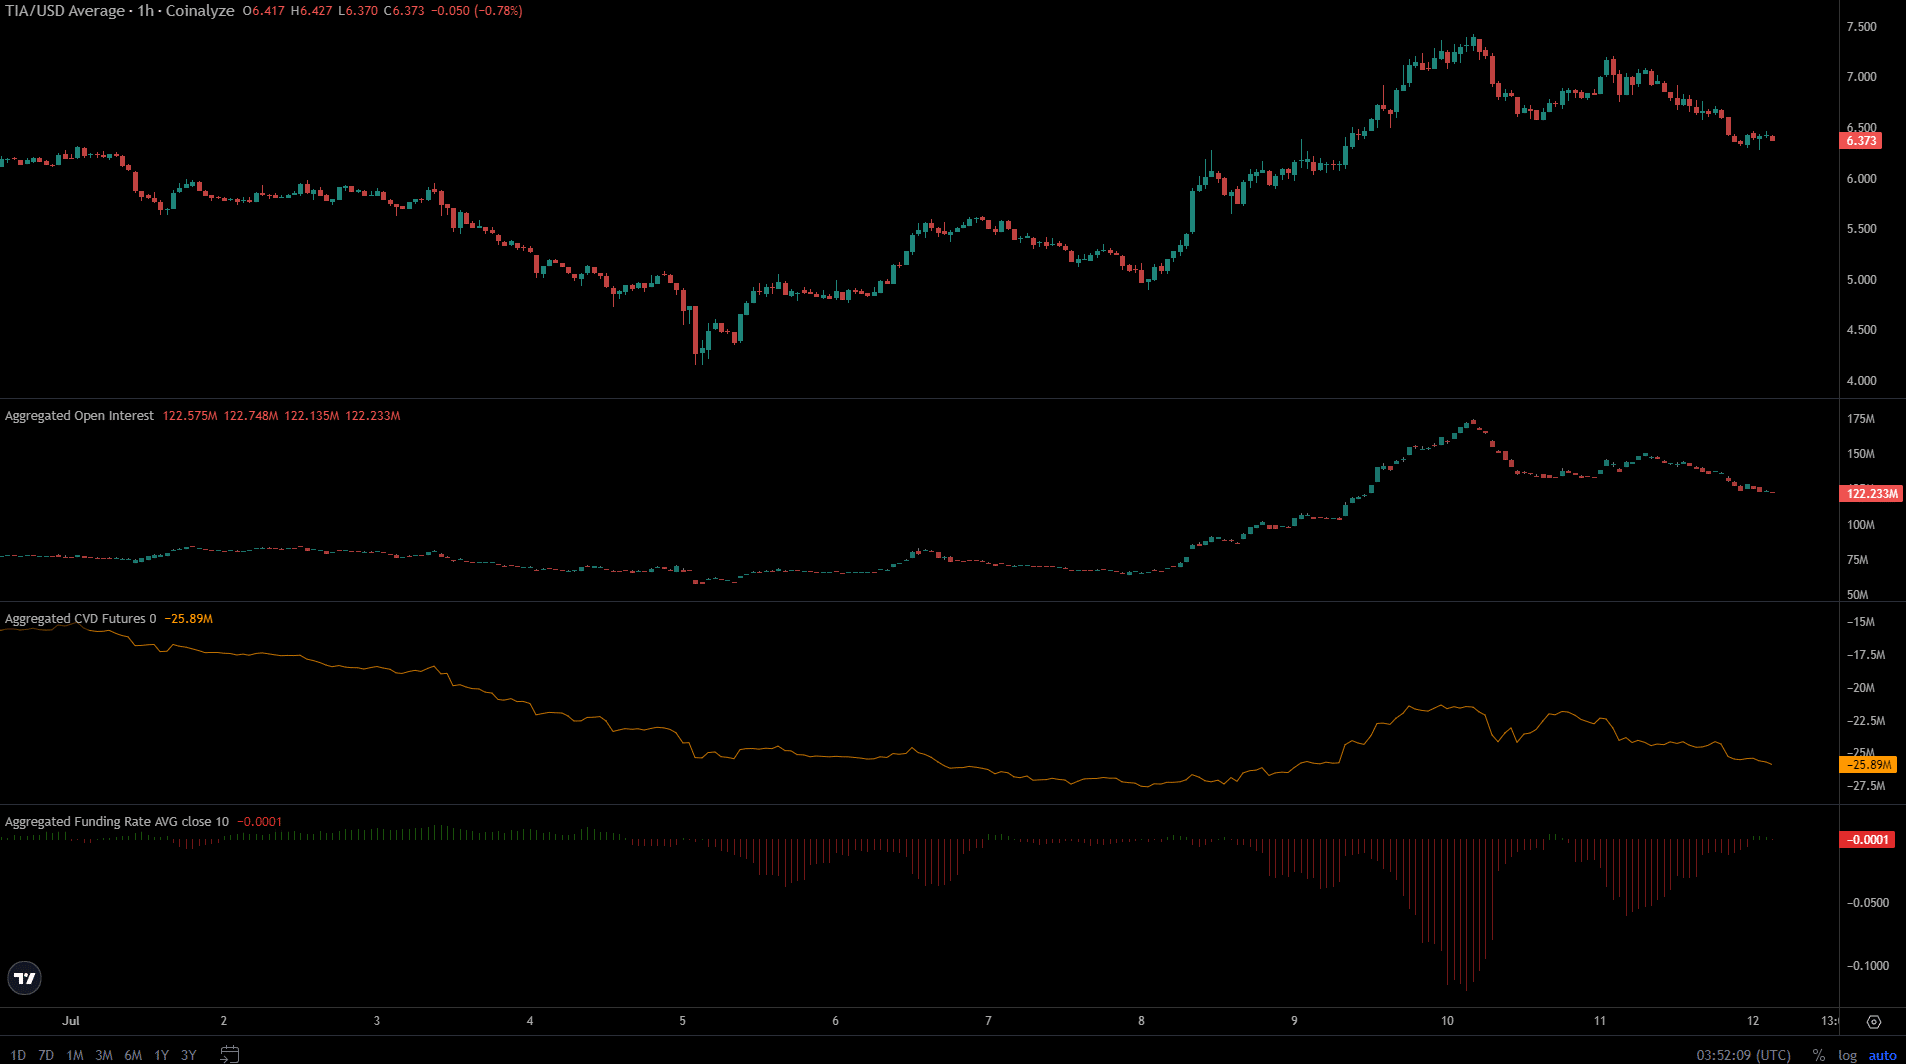
Source: Coinalyze
Since the 10th of July, TIA has fallen 14.8% and the Open Interest reduced dramatically from $174 million to $122 million, a 29.9% drop. The Funding Rate has also been bearish over the past two days.
This showed that despite the OI gains earlier this week, speculators were not convinced that TIA would initiate a recovery and were happy to bet on a price reversal.
Realistic or not, here’s TIA’s market cap in BTC’s terms
The spot CVD has also slid lower over the past two days, dashing bullish hopes of a recovery.
The market structure break on the daily chart was a hopeful sign, but the lower timeframes reflected bearish sentiment. Swing traders can look for buying opportunities in the $5.75-$6 support zone.
Disclaimer: The information presented does not constitute financial, investment, trading, or other types of advice and is solely the writer’s opinion.