Celestia: Can growth in TIA’s active users halt its decline to $3.7?

- Despite ranking as one of the top IBC blockchains in terms of active users, it has failed to offset bearish sentiment.
- Traders remain largely pessimistic, with the majority taking short positions on the asset.
Over the past month, Celestia [TIA] has recorded a sharp decline, shedding over 12% of its value. The daily chart reflects an extended sell-off, with an additional 6.60% drop as bearish momentum continues to build.
AMBCrypto analysis suggest this may not be the bottom, warning that TIA’s market value could face further declines in the near term.
TIA’s active users surge, but market sentiment remains bearish
Recent data highlights a significant increase in active users on the Celestial blockchain (an IBC-enabled chains), the native network for TIA over the past week.
Inter-Blockchain Communication (IBC) chains like Celestial, allows easy data transfer and interoperability between blockchains. According to the latest figures, Celestial attracted 62,650 active users, securing the second spot among IBC chains in terms of user activity.
However, the surge in active users has not translated into positive market performance for TIA. Despite the growth, TIA’s price has continued to decline. According to CoinMarketCap, its market capitalization has dropped by 6.29% to $2.14 billion, while trading volume has plunged by a sharp 48.69%.
These metrics reflect waning market confidence, with further analysis suggesting the possibility of continued bearish momentum for TIA.
Bears tighten grip on the market
At the time of writing, bearish sentiment continues to dominate the market, reinforcing existing downward signals.
Open Interest, which tracks the total number of unsettled derivative contracts—specifically futures in this case—has seen a significant decline of 7.33%, dropping to $238.65 million over the past 24 hours.
Additionally, the number of short positions outweighs longs, as reflected by the Long-to-Short ratio of 0.8328. This indicates that bearish influence is becoming increasingly pronounced.
The low ratio aligns with the recent liquidation of substantial long positions worth $941.10 thousand, which has added to the downward pressure on the asset. In contrast, only $71.34 thousand in short positions have been closed during the same period, further emphasizing the bearish dominance.
If this downward momentum persists—which remains the prevailing bias for TIA—AMBCrypto analysis has identified potential lower targets for the asset.
TIA risks falling to $3.6 as bearish pressure mounts
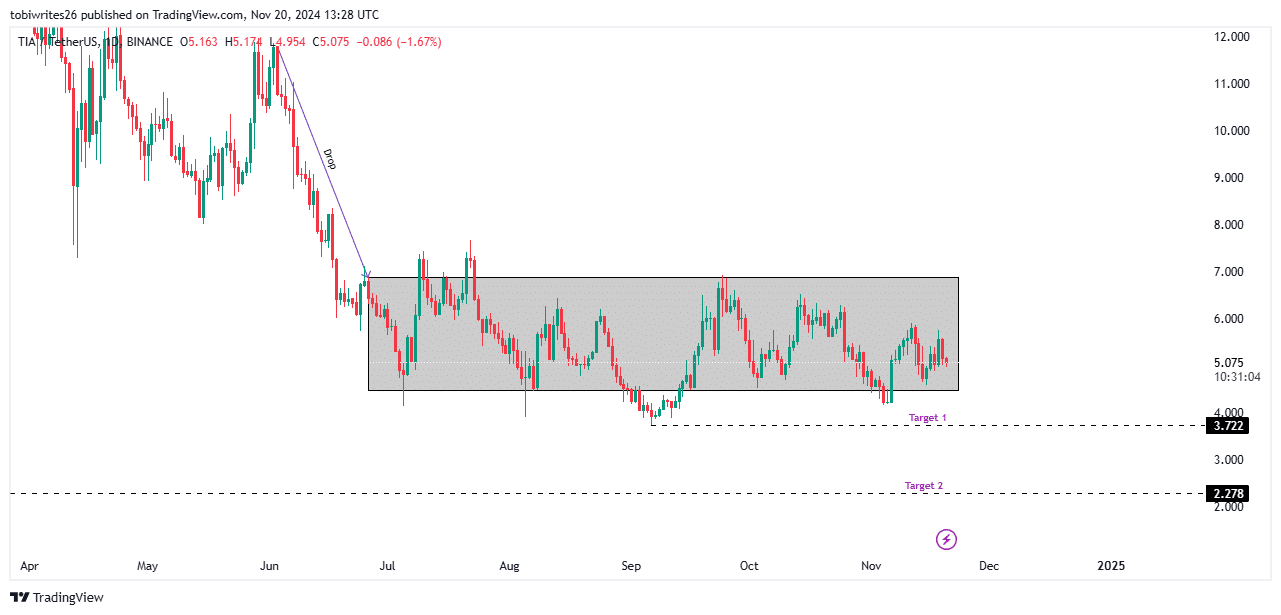
Since June, TIA has been trading within a consolidation channel, oscillating between key support and resistance levels. Such patterns typically precede a sharp breakout, either upward or downward.
Is your portfolio green? Check out the TIA Profit Calculator
In the current bearish phase of the market, TIA faces two critical downside targets. The first is $3.7, a level that could be tested if selling pressure intensifies.
Should the bearish momentum persist, the asset may experience a steeper decline, potentially falling to $2.2.


