Chainlink, Aave, SushiSwap Price Analysis: 20 February

Chainlink broke out of a bullish pattern over the past 48 hours and was once more testing a region of supply in an attempt to move above it. Aave formed a descending triangle and a breakout could see a move to $550, and SushiSwap was bullish on the charts.
Chainlink [LINK]
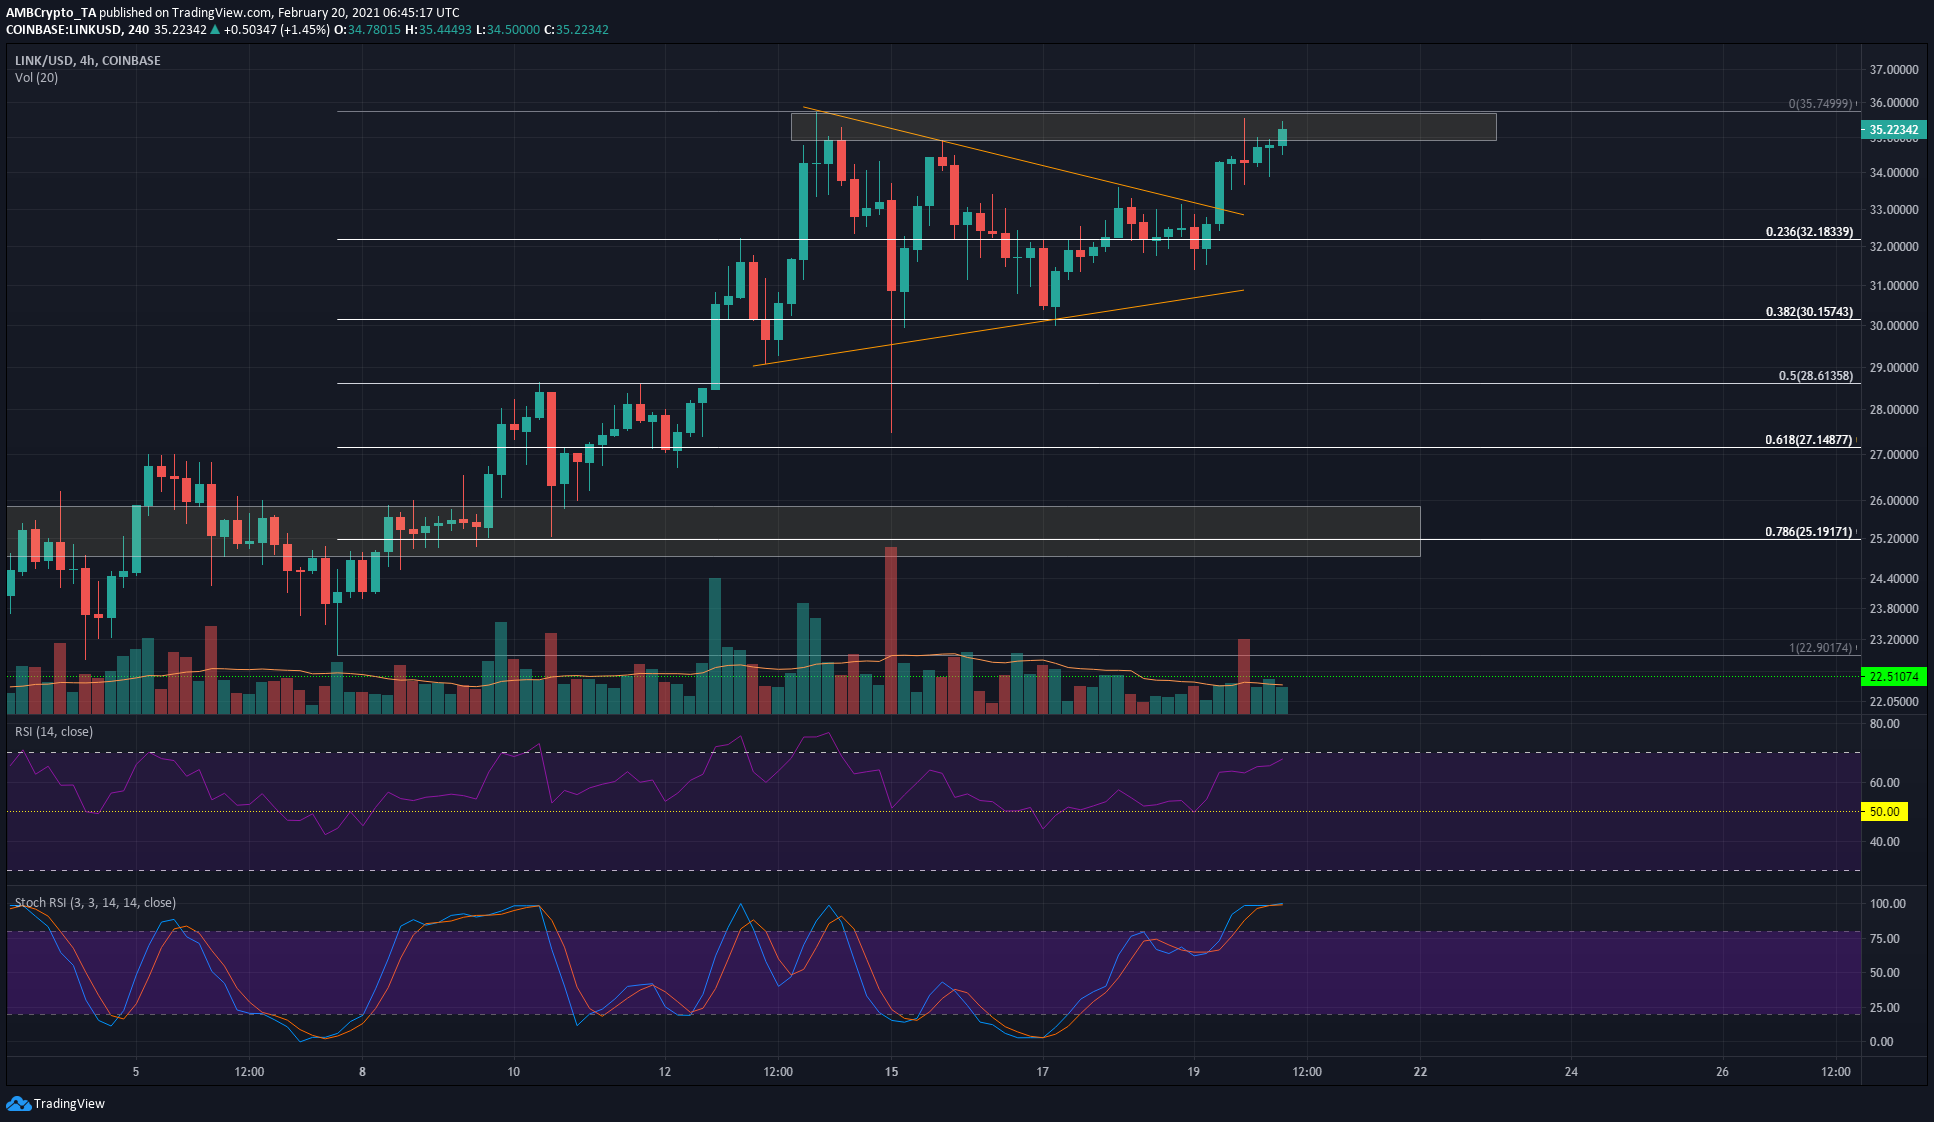
Chainlink broke out of a symmetrical triangle pattern and retested the previous highs resistance around the $35.2 region. From $34.9-$35.6 is a zone of supply that LINK would need to flip into a region of demand. Once the price rises above and retests this region, this area would be a good buying opportunity for LINK.
The RSI did not drop below neutral 50 and this showed that the uptrend was in continuation. The Stochastic RSI was deep into the overbought region but this does not show an imminent drop as likely.
Above the $35.74 mark, the 27% Fibonacci extension level presents a target of $40.3 for the LINK bulls.
Aave [AAVE]
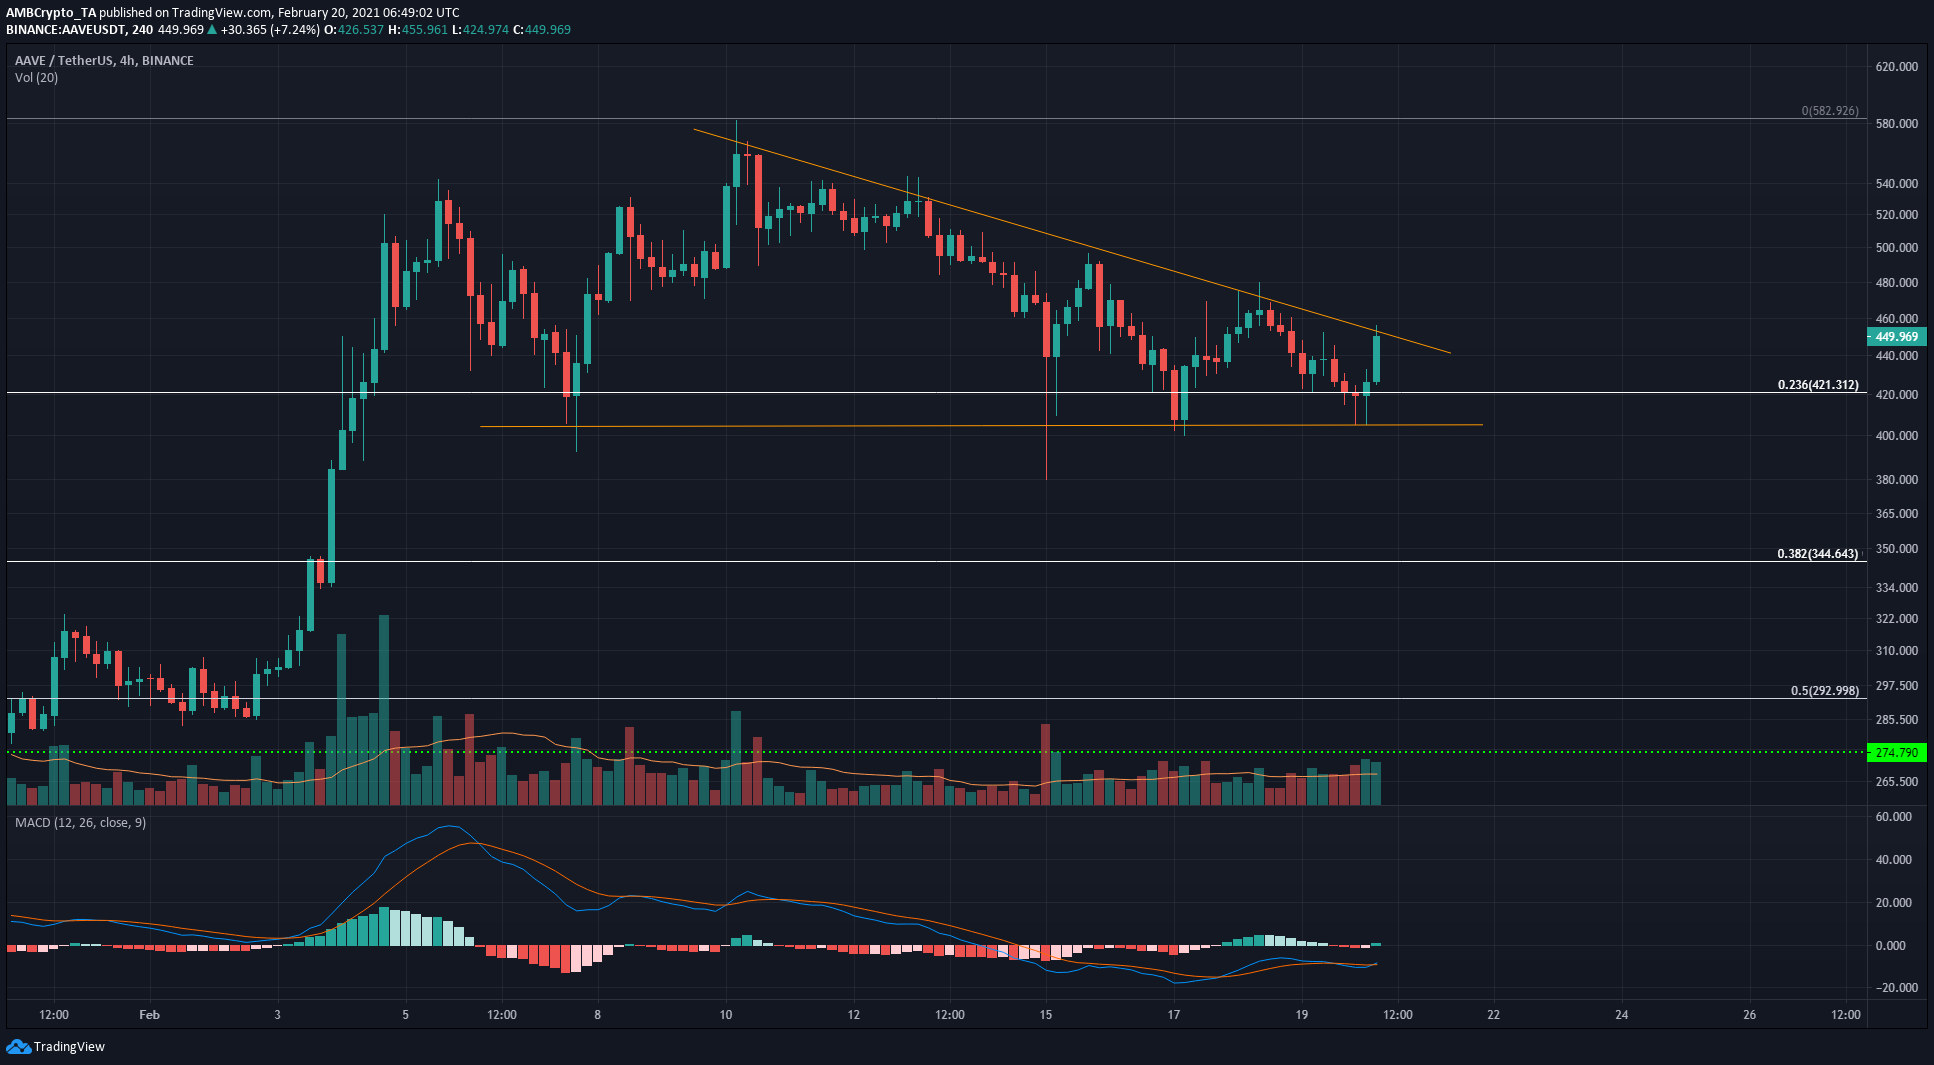
Aave also formed a bullish chart pattern and was on the verge of a breakout. The descending triangle pattern generally sees the price target the peak of the pattern following a breakout. This presents a technical target of around $560 for AAVE in the coming days.
The volume has been only slightly above the 20 period moving average, while the MACD formed a bullish crossover to give a buy signal.
A retest of the descending trendline over the next few hours is also possible before a move upward.
SushiSwap [SUSHI]
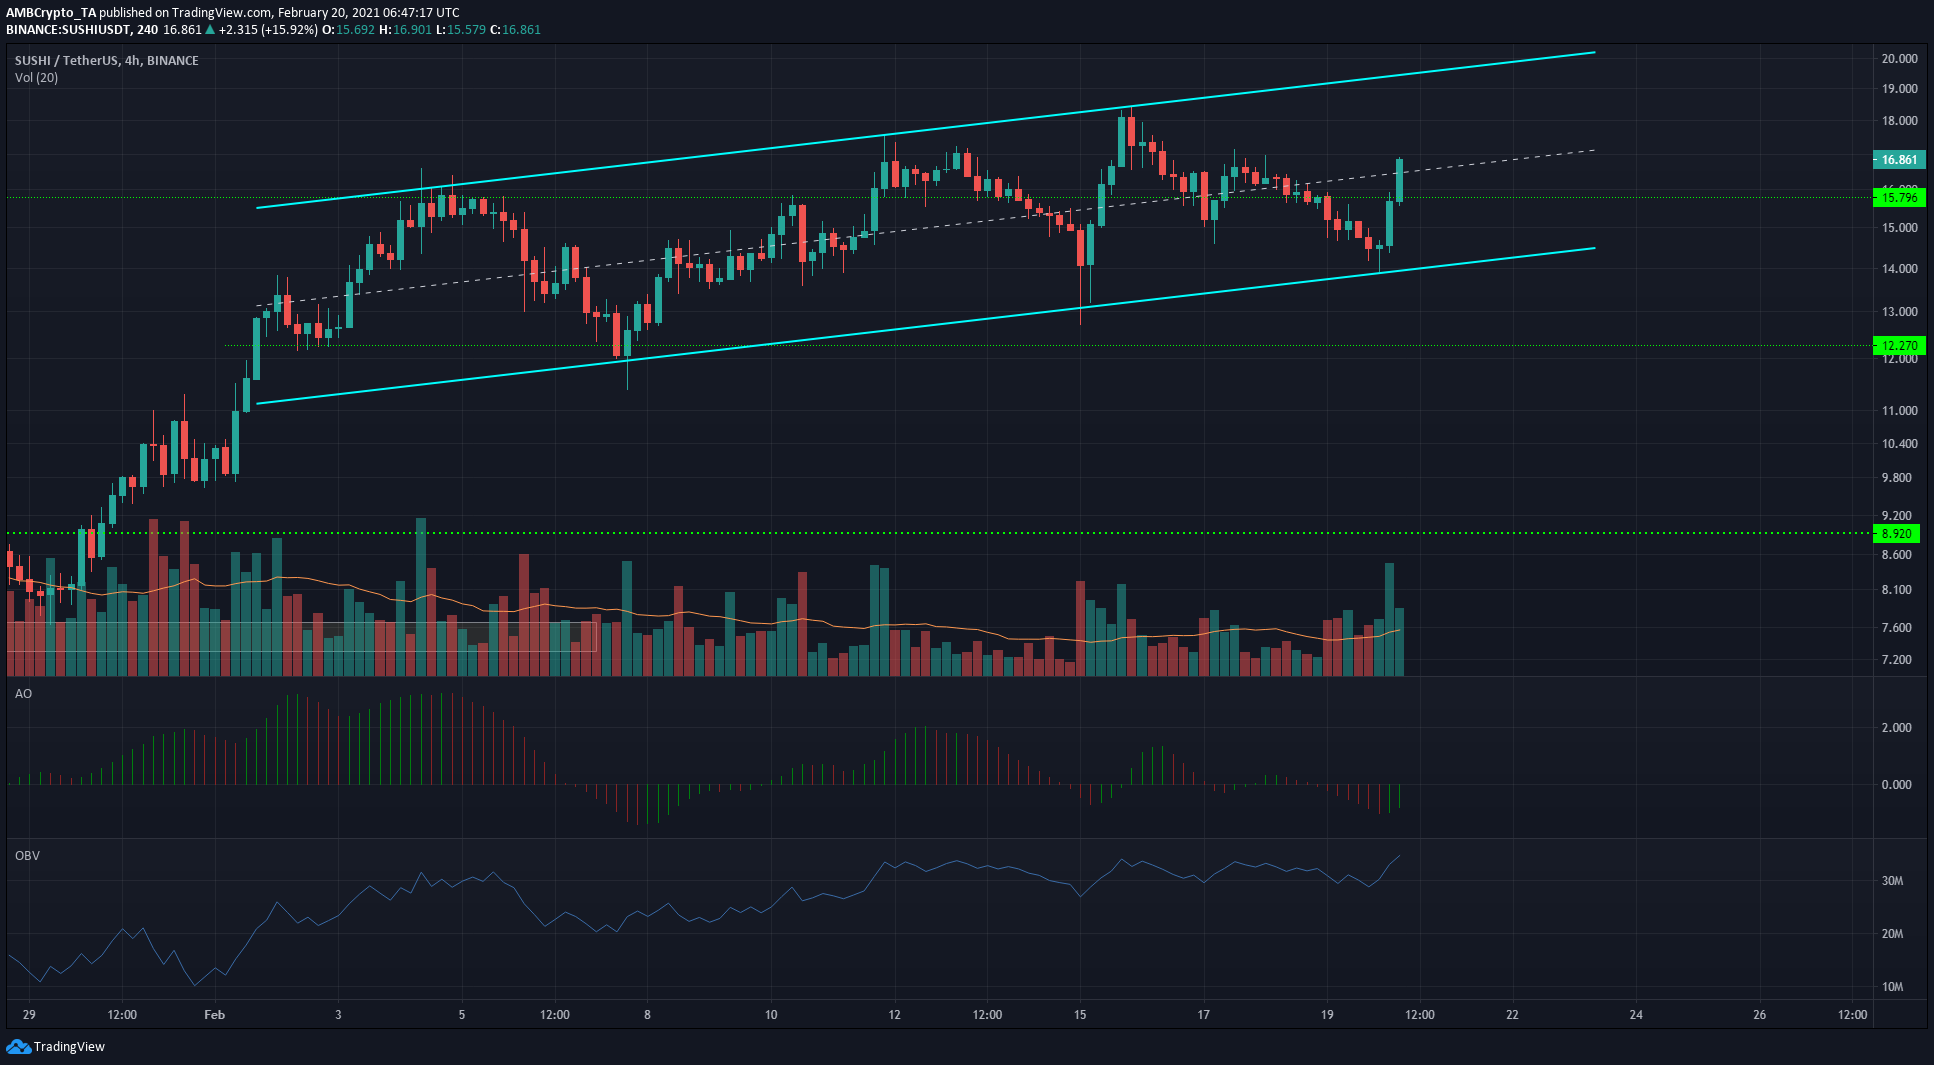
SUSHI was trading within an ascending channel, and the mid-point of the channel has served as both support and resistance to the price in the recent past. Some resistance was expected at the $15.8 level but it could be that this level is flipped to support in the coming hours.
The OBV was in an uptrend as it posted a series of higher lows to show strong demand and buying volume from buyers. The Awesome Oscillator was beneath the zero line and did not yet show a buy signal or a shift in momentum to favor bulls.


