Chainlink, Avalanche, The Graph Price Analysis: 16 March

Chainlink moved back above the $13.4 level, but it appeared that there were no strong buyers in the $13 area for LINK. This indicated that, despite the move to the upside in recent hours, the longer-term trend remains bearish for Chainlink. Avalanche attempted to break out of a descending channel, while The Graph posted new local highs at $0.45.
Chainlink (LINK)
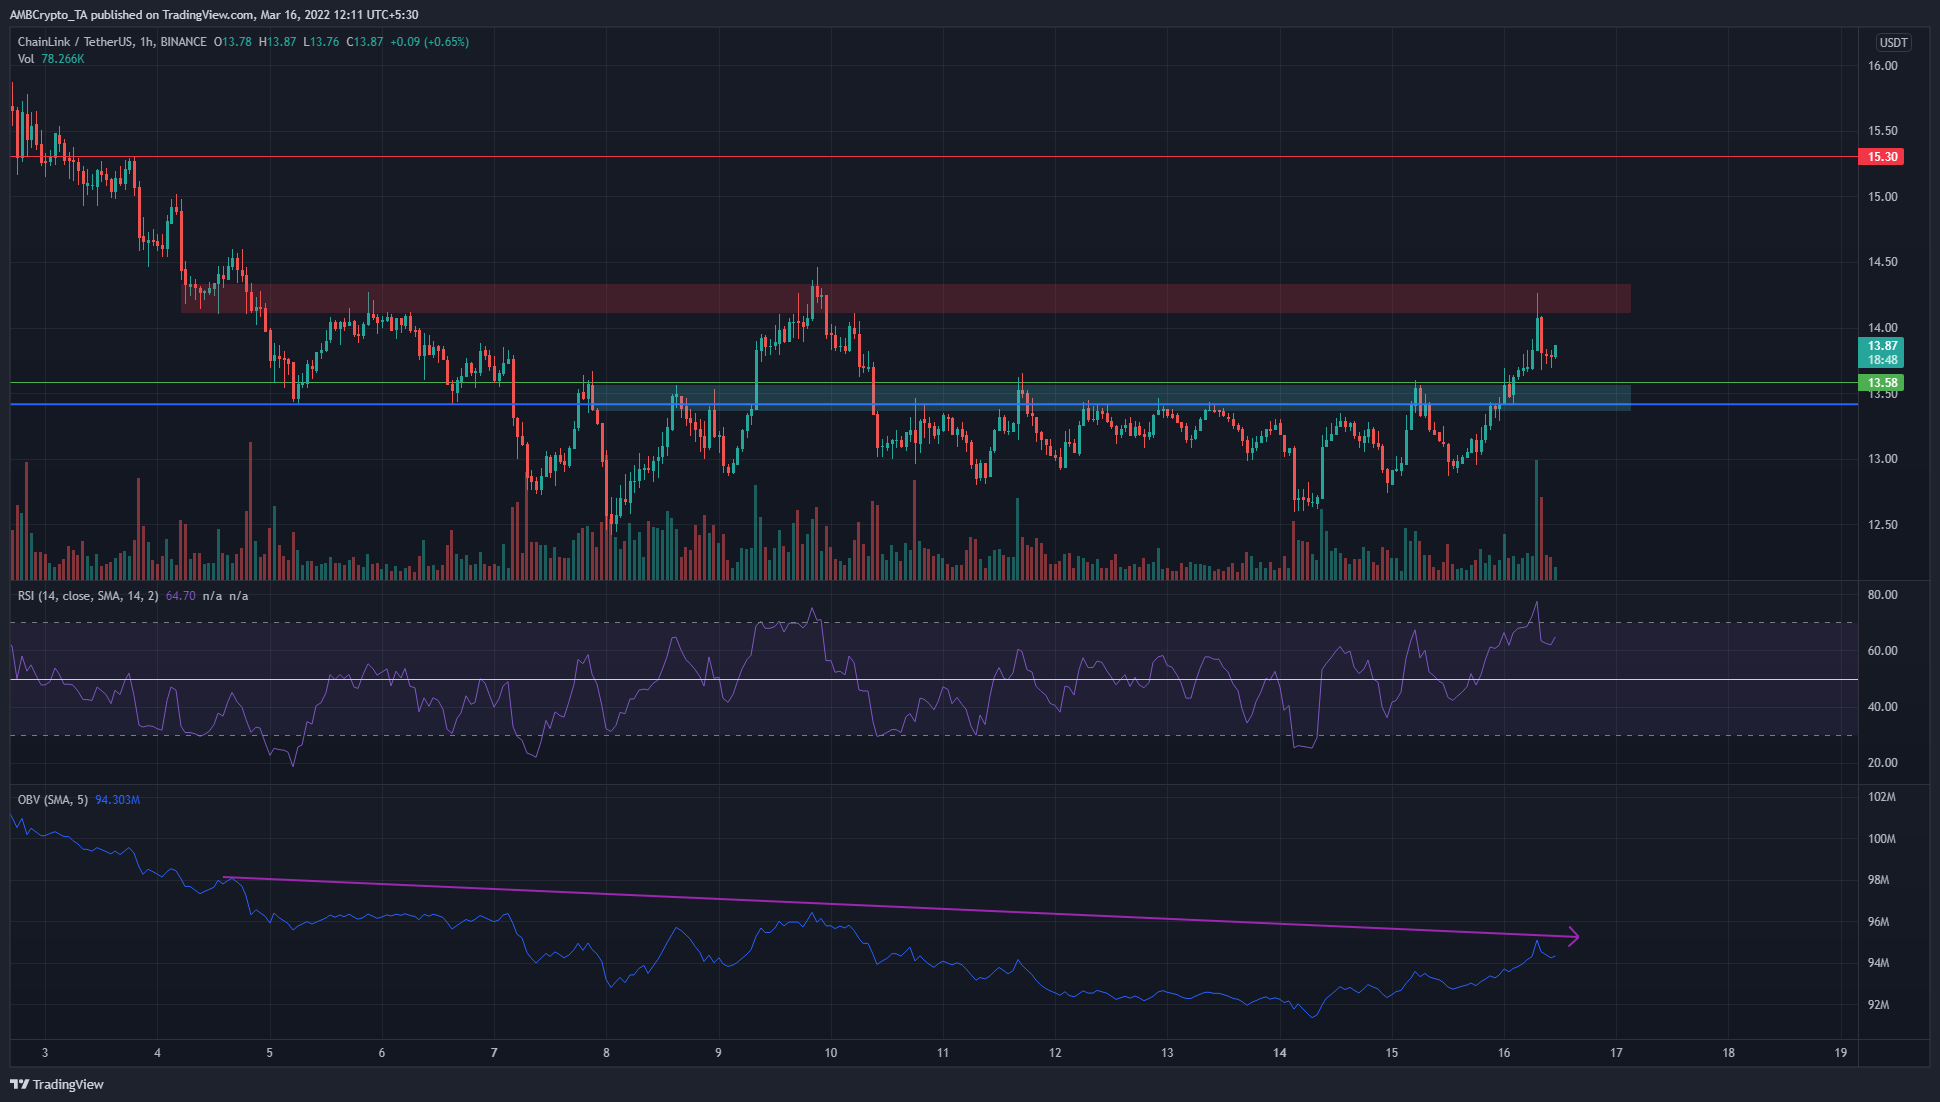
$13.4 represents a level that LINK previously tested on 19 July, 2021. This level was also the low of a range that LINK has traded within for the past ten months. However, the past three weeks have seen LINK bulls fight to keep a hold on the $13.4 level.
In recent hours, the price has once more climbed past $13.4 to trade at $13.87. The $14.2 area represents an area of supply. To the south, the $13.4-$13.5 area could see some demand. However, the OBV was forming lower highs- a clear lack of consistent demand. The RSI showed strong bullish momentum and could see LINK test $14.2 once more.
Avalanche (AVAX)
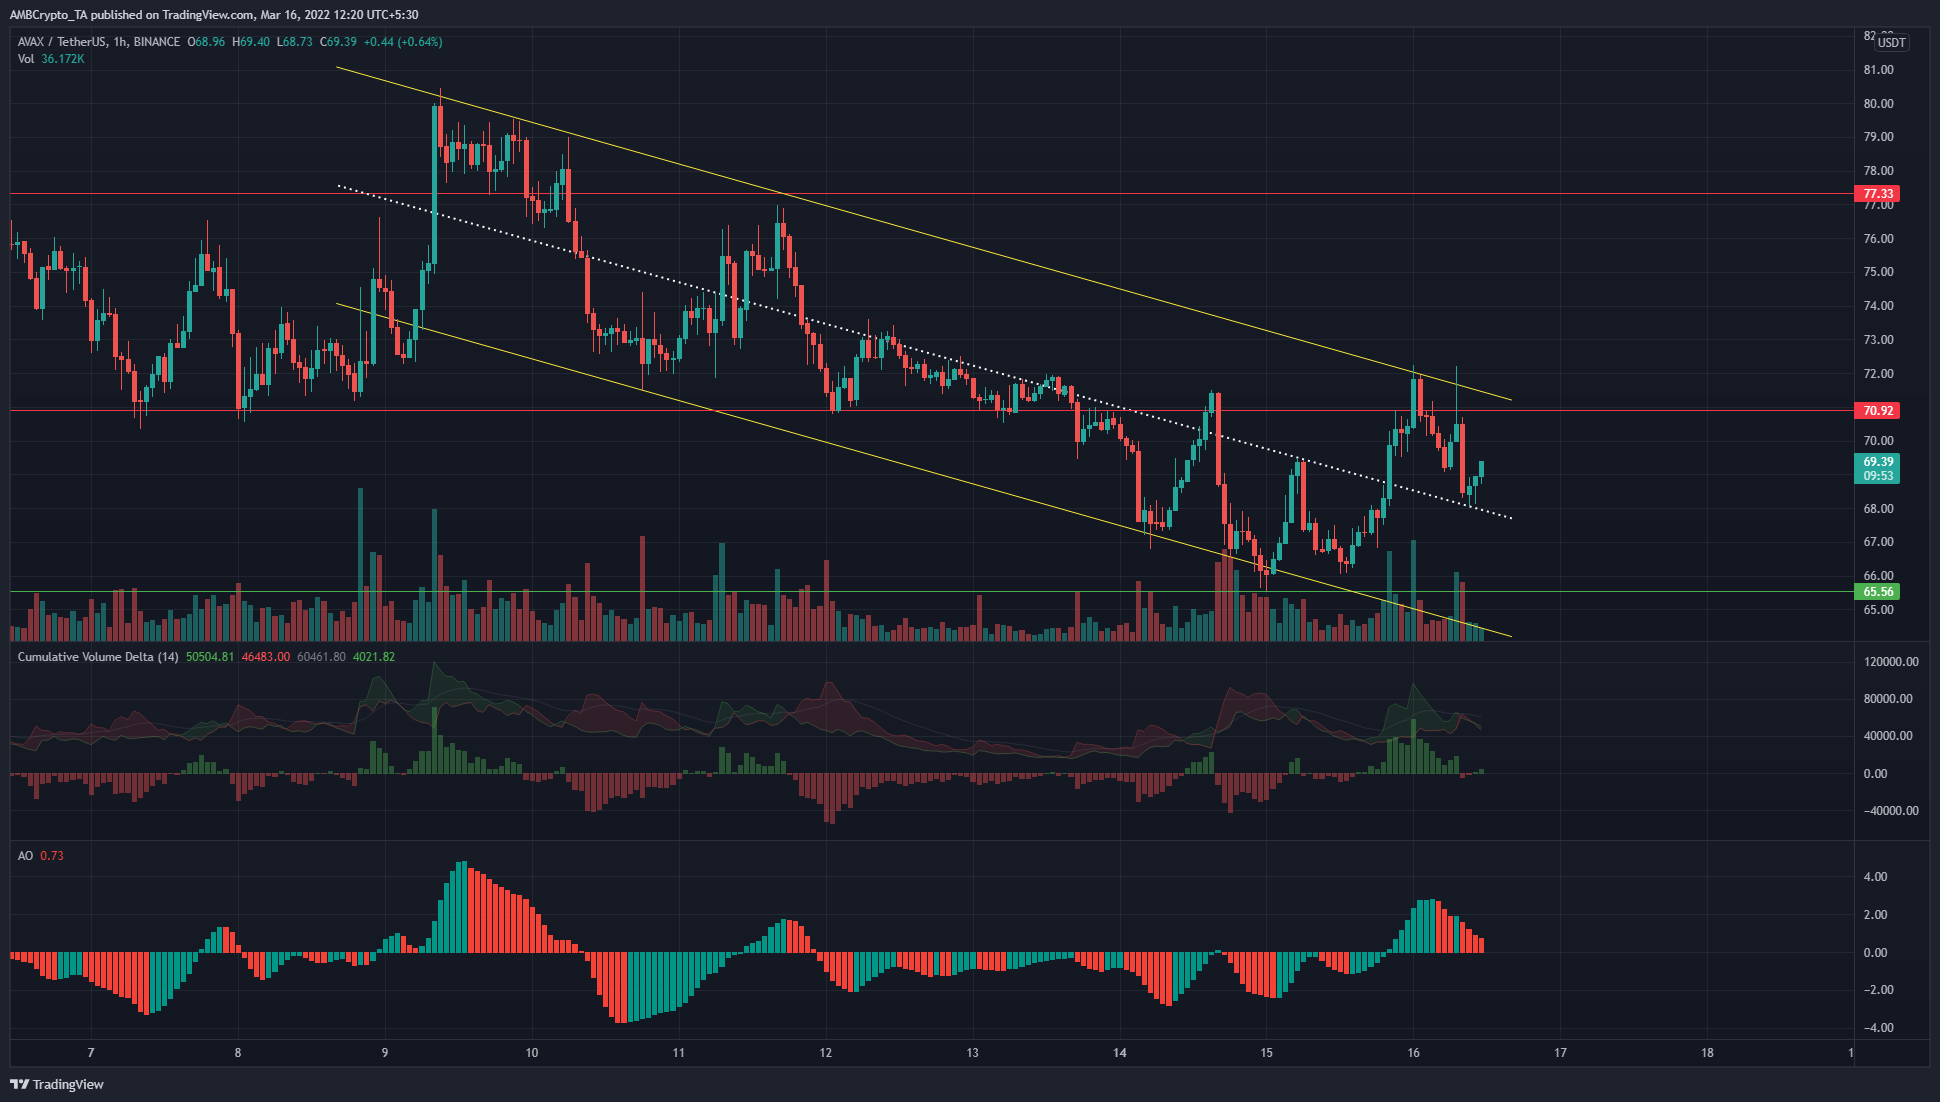
AVAX was trading within a descending channel (yellow). The mid-range (dotted white) offered support to the price and saw a bounce in the past few hours. The Awesome Oscillator climbed back above the zero line to denote some bullish momentum. The CVD showed strong buying pressure in recent hours as the price climbed from the lows at $66.1 to test $72.
A move past the $71 level and the channel highs, and a retest of the channel’s upper boundary as support could offer a near-term buying opportunity.
The Graph (GRT)
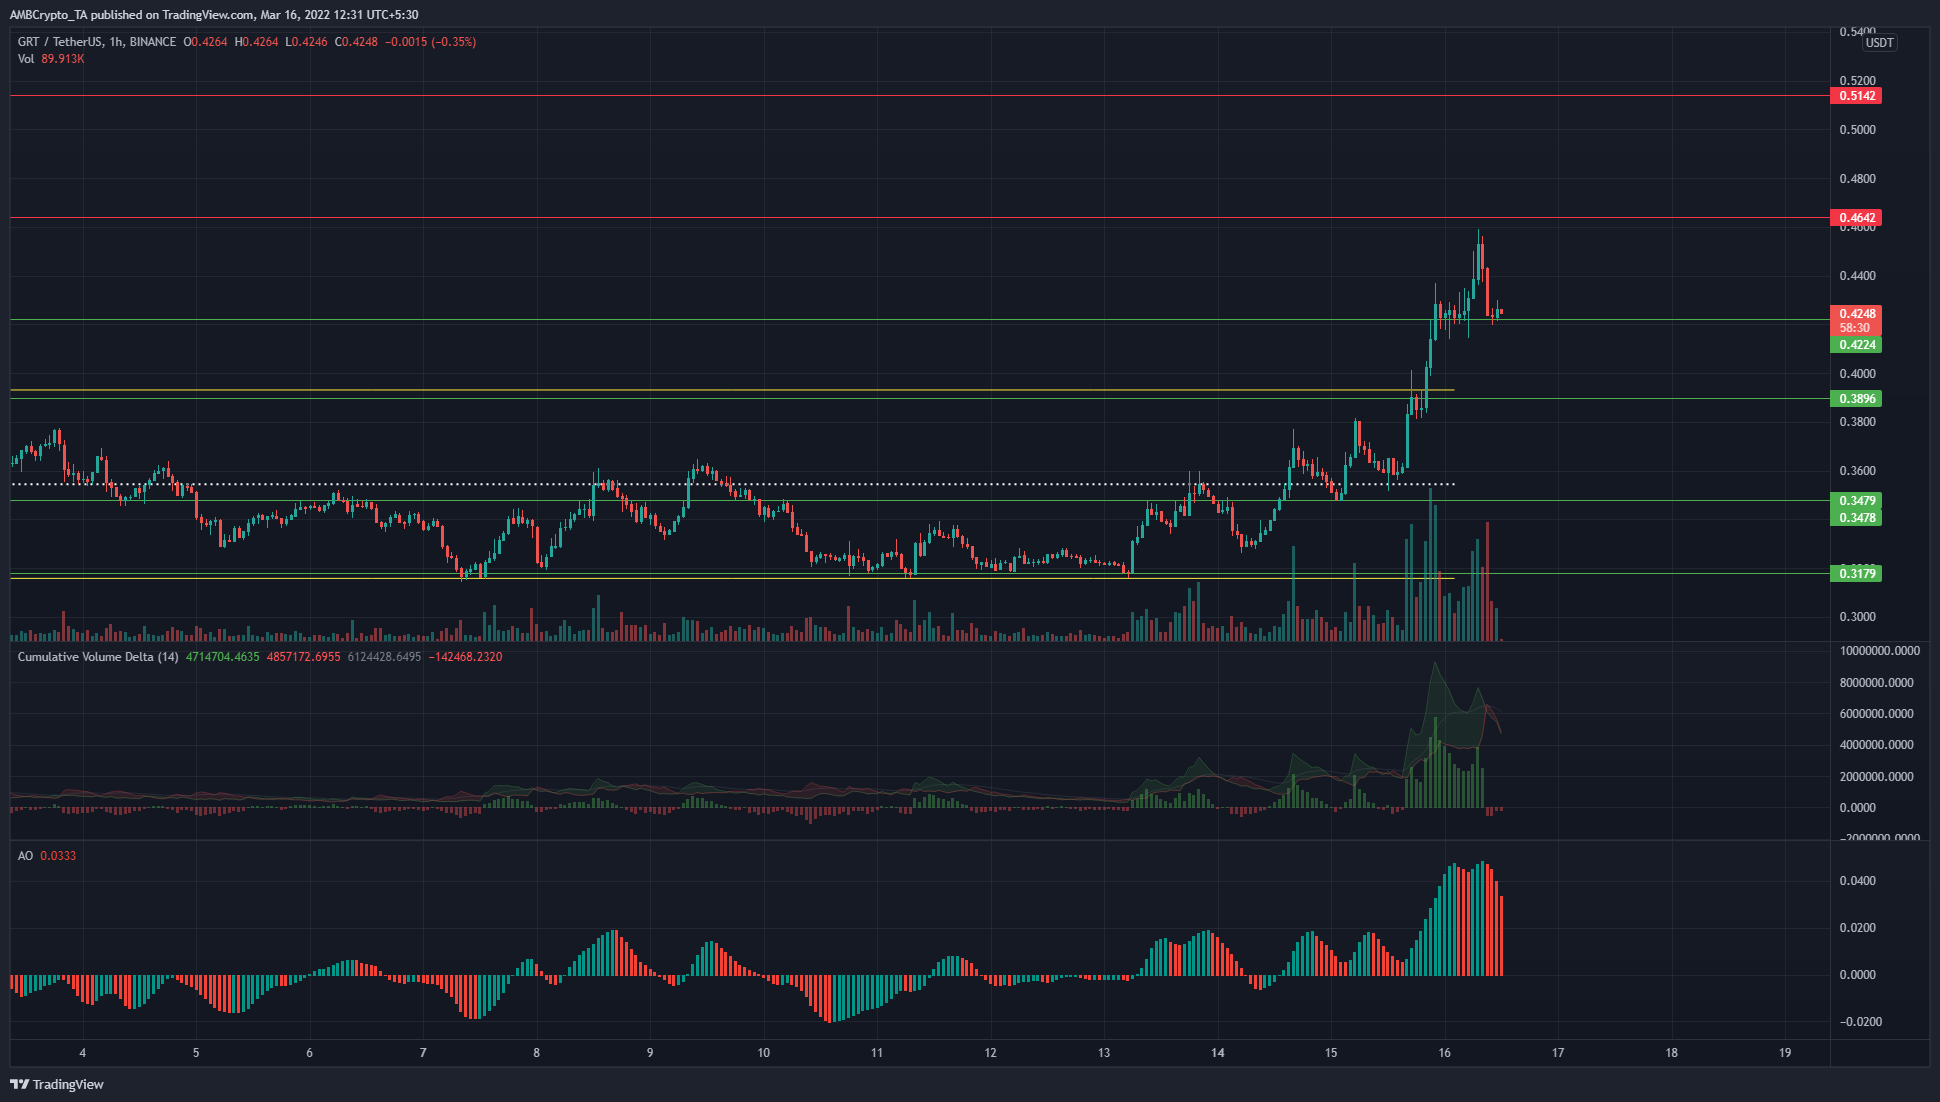
From late February, GRT has been trading sideways and within a range from $0.315 to $0.393. Recently, GRT saw a large of buyers and the price rocketed from the range lows to break above the range highs. At press time, the price had retraced from $0.45 local highs to retest the $0.42 level as support once more.
A deeper pullback to $0.39 can not be ruled out, therefore the $0.39 and $0.42 levels can be used to build a long position. To the north, $0.45, $0.48, and $0.53 levels represent resistance levels. The CDV showed high buying pressure behind GRT’s rally, while the AO also showed strong bullish momentum.


