
Owing to the market fall of June 4, altcoins have been following Bitcoin’s trajectory. The recovery has been fairly slow while the king coin has been struggling to break past $37,000. Even the Total Market Capitalization stood at $1.622 trillion, rising by less than 2% in the last 3 days. Chainlink and Bitcoin Cash continued their slow sideways movement, whereas Uniswap appeared to be moving upwards.
Chainlink [LINK] :-
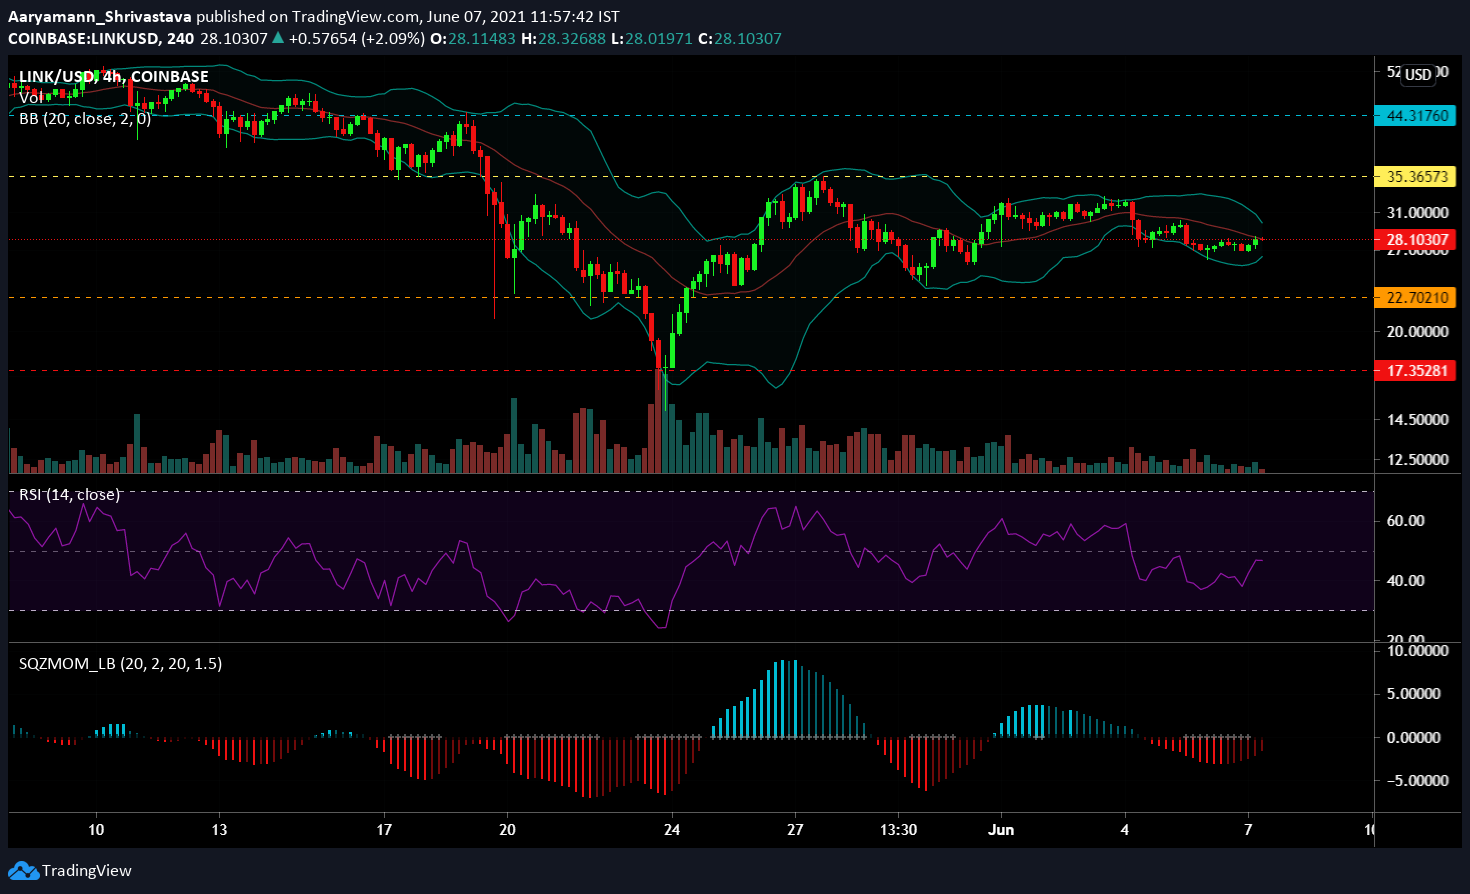
Source: LINK/USD – TradingView
Chainlink has been confined within the $35.36 resistance and $22.7 support levels since May 19. Despite attempts to breach through resistance ceiling, LINK continued its sideways movement, trading at $28.1 at press time. Bollinger Bands indicated low volatility, due to the tight convergence of the bands.
Relative Strength Index (RSI) suggested a probable increase in price. The purple line of RSI indicator rose back up from getting close to the oversold region and lingered at 44.6 at the time of writing. Furthermore, Squeeze Momentum Indicator showed bearish pressure receding. With the recent ‘Squeeze release’ (indicated by white dots) and the appearance of the dark red bars, the movement could turn positive.
While volatility was restricted, the coin will continue its rise within the aforementioned levels of support and resistance.
Bitcoin Cash [ BCH ] :-
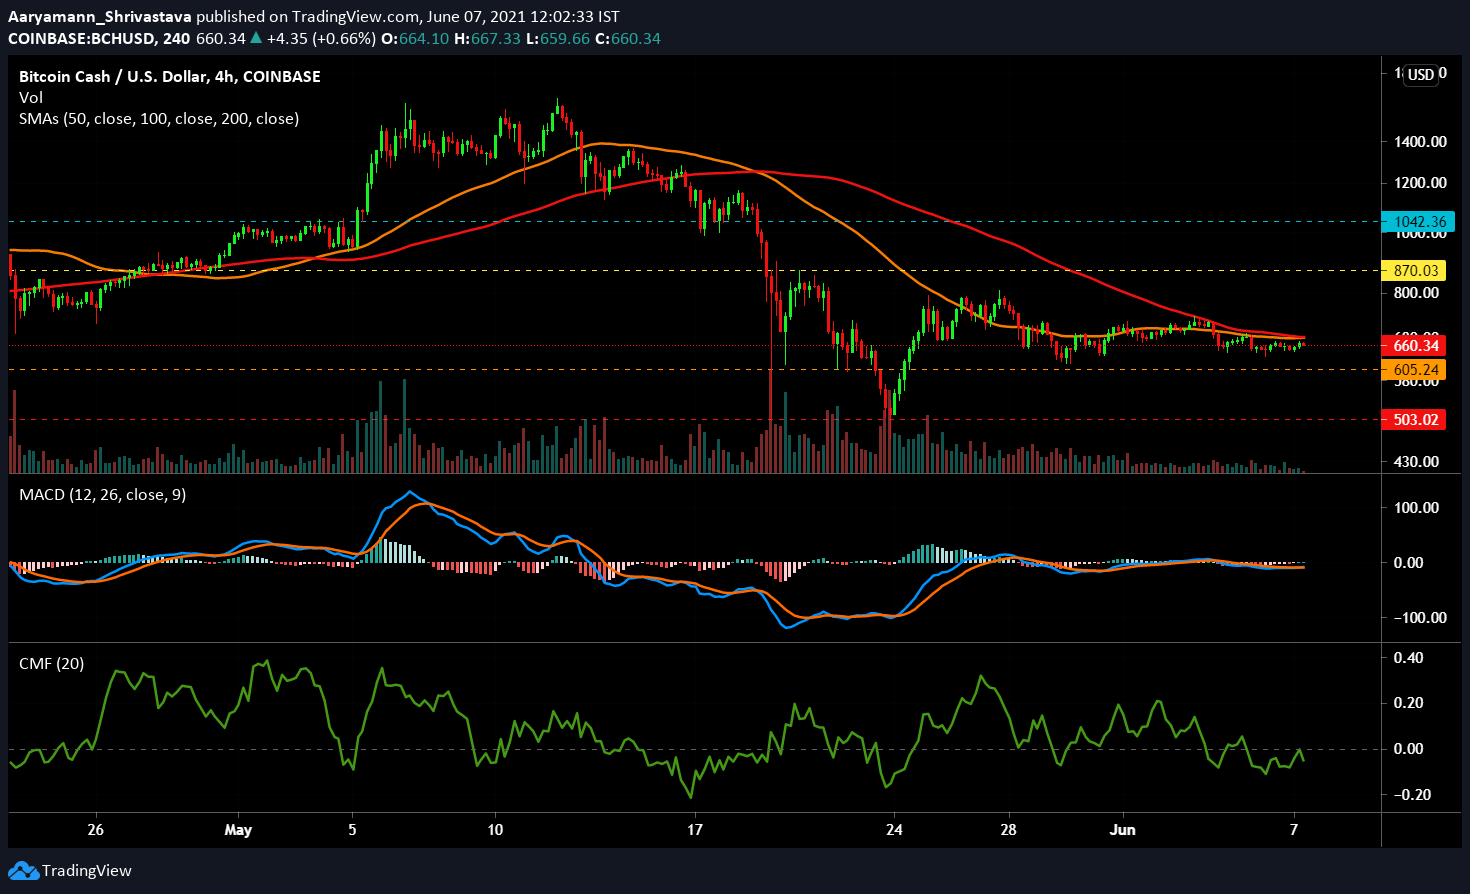
Source: BCH/USD – TradingView
Unlike other altcoins, Bitcoin Cash has been repeatedly testing its support level of $605 since its drop on May 19. Trading at $660, BCH was inching closer to the support level. Despite the coin trading at a low for a long time, the market did not indicate positive momentum for the coin for now. Chaikin Money Flow displayed capital outflows dominating inflows and kept the indicator close to the neutral mark.
MACD indicator did not exhibit any optimistic momentum either. Both the blue indicator line and the red signal line have remained aligned since the beginning of the month, and at press time, continued that movement. However, Simple Moving Averages changed their stance. 50 SMA (orange line), changed its position to resistance as it moved above the candlesticks, and the 100 SMA (red line) stood very close to the price indicator. This was unusual as the indicator had remained far away since 19 May.
Based on the indicators BCH does not show any signs of a price spike. Some upward movement could occur, but the coin will likely remain under $870 the resistance level.
Uniswap [ UNI ] :-

Source: UNI/USD, TradingView
As discussed in a previous analysis, UNI did turn positive and indicated an uptrend in the early hours of June 7. Awesome Oscillator displayed bearish momentum creeping in on June 4. However, The appearance of green bars at the time of writing indicated bullish momentum rising.
This was backed by Parabolic SAR which showed that an uptrend had been initiated since the white dotted line moved under the price indicator. The low drag of the Average Directional Index (ADX) displayed positive cues. As long as the red line indicator remains under 25.0, UNI could have some chances of rallying.
In that case, based on broader market cues, the price rise still won’t likely breach the $29.93 resistance level and the coin will remain consolidated above the $22.17 support level.