Chainlink bulls in a pickle after its $6.6 move
The on-chain metrics pointed at LINK accumulation despite the past month's downtrend. This indicated that the support from March could see a bullish reversal.

Disclaimer: The information presented does not constitute financial, investment, trading, or other types of advice and is solely the writer’s opinion.
- The market structure went one way then another, trapping LINK bulls at $6.6.
- A move further south appeared likely but $6 could be important once more.
Over the past two weeks, Chainlink [LINK] has bounced between the $6.3 and $6.8 levels. The trend on the daily chart was firmly bearish. The lower timeframes showed LINK could see a minor positive reaction from $6.3.
Is your portfolio green? Check the Chainlink Profit Calculator
One of the on-chain metrics was in favor of the investors. However, it might not be enough to undo the selling pressure seen since 19 April.
The lack of a strong trend meant the OBV could be significant in the coming weeks
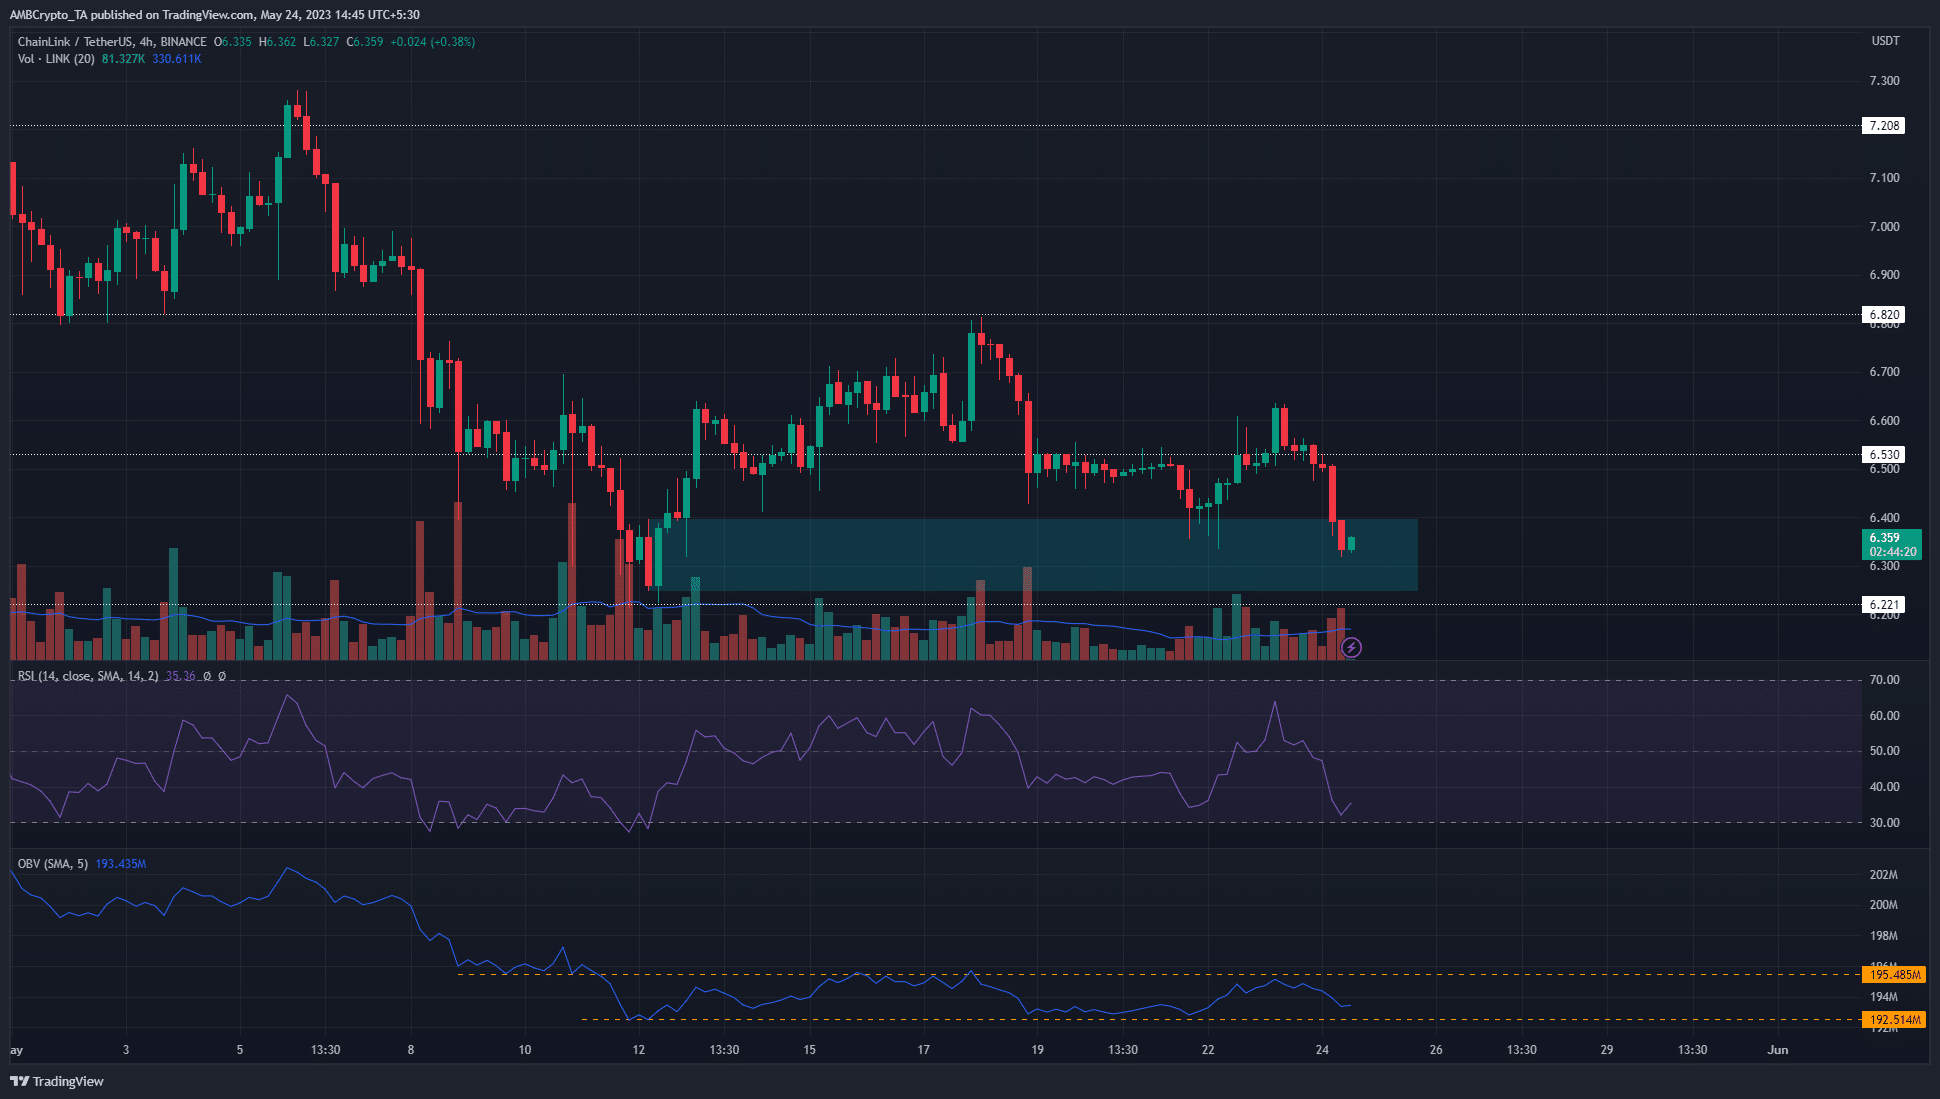
On 18 May, the resistance at $6.82 was tested and bulls were rebuffed from this territory. Within 24 hours, the bullish market structure was broken after LINK dropped below the higher low at $6.55 to fall to $6.43.
From 19 May to 22 May, LINK continued to labor under a bearish structure. On Tuesday, Bitcoin’s rally to $27.4k sparked some hope in Chainlink buyers as well and propelled prices to reach $6.6 again. Yet, this turned out to be a bull trap.
Both BTC and LINK prices slumped again. The recent downturn to $6.3 for LINK saw another retest of the bullish order block from 12 May. Highlighted in cyan, this OB was already tested two days ago, which saw LINK bounce to $6.6.
Repeated tests of the order block tend to weaken the buyers, and Chainlink likely would see a weaker bounce before a capitulation to the sellers. On the other hand, the OBV was stuck within a range, and traders can wait for the OBV to move beneath support before looking for short entries.
Realistic or not, here’s LINK’s market cap in BTC terms
The advancing mean coin age suggested accumulation by LINK bulls
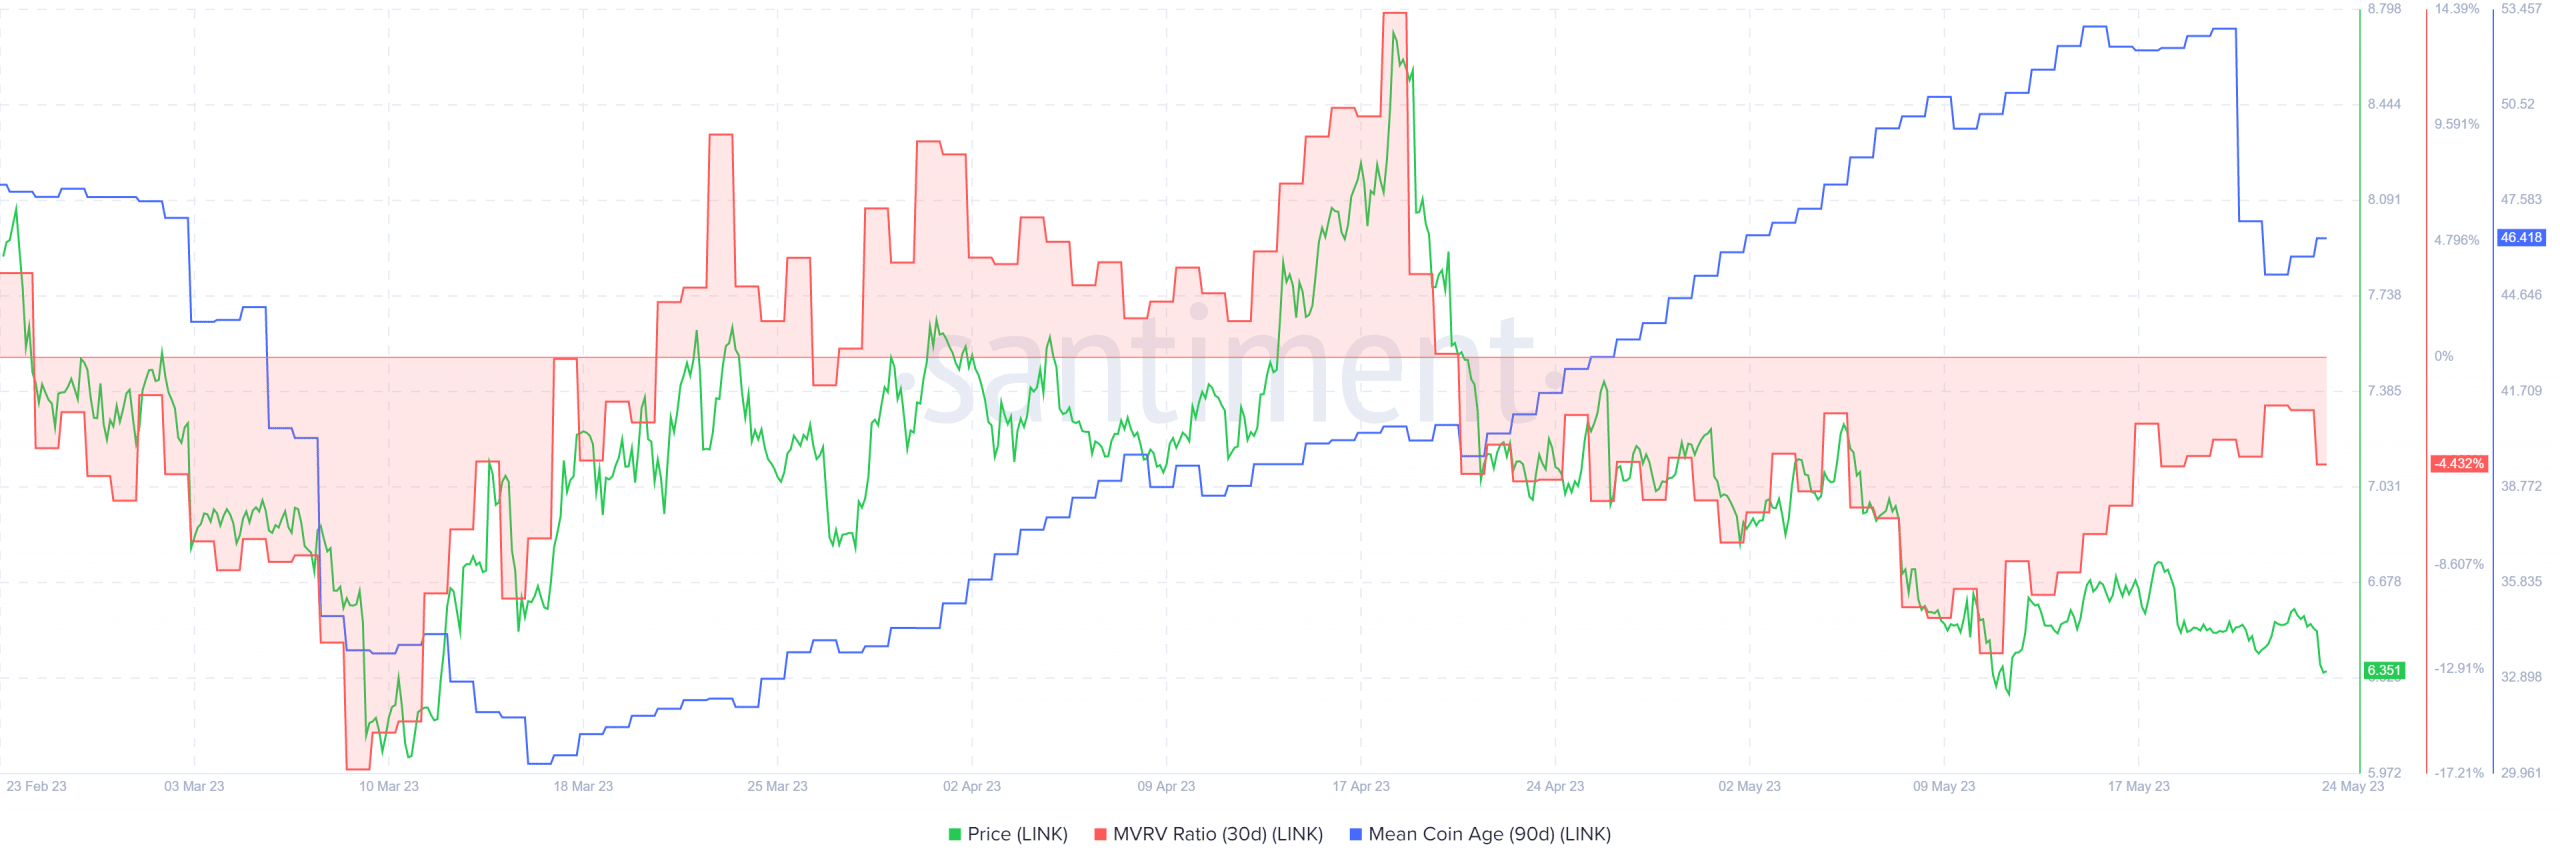
The 30-day MVRV ratio was in negative territory showing that short-term investors were holding at a loss. This was a reasonable finding given the trend of Chainlink over the past month. The mean coin age hinted at a more surprising possibility.
The metric was in an uptrend since mid-March, and only took a major swing lower in recent days. The inference was that despite the lack of a clear trend on the higher timeframes, Chainlink buyers steadily bid for the token. This also suggested that LINK could see a bullish reversal upon a retest of the $6-$6.2 support, just as it did in March.


