Chainlink, Cosmos, Dash Price Analysis: 11 June

Chainlink eyed a 20% hike in case of a breakout above its up-channel and 50-SMA. ATOM’s downtrend could push the cryptocurrency back towards its demand zone between $8.6-9. Finally, Dash prepared to take another swing at the $180-resistance level.
Chainlink [LINK]

Source: LINK/USD, TradingView
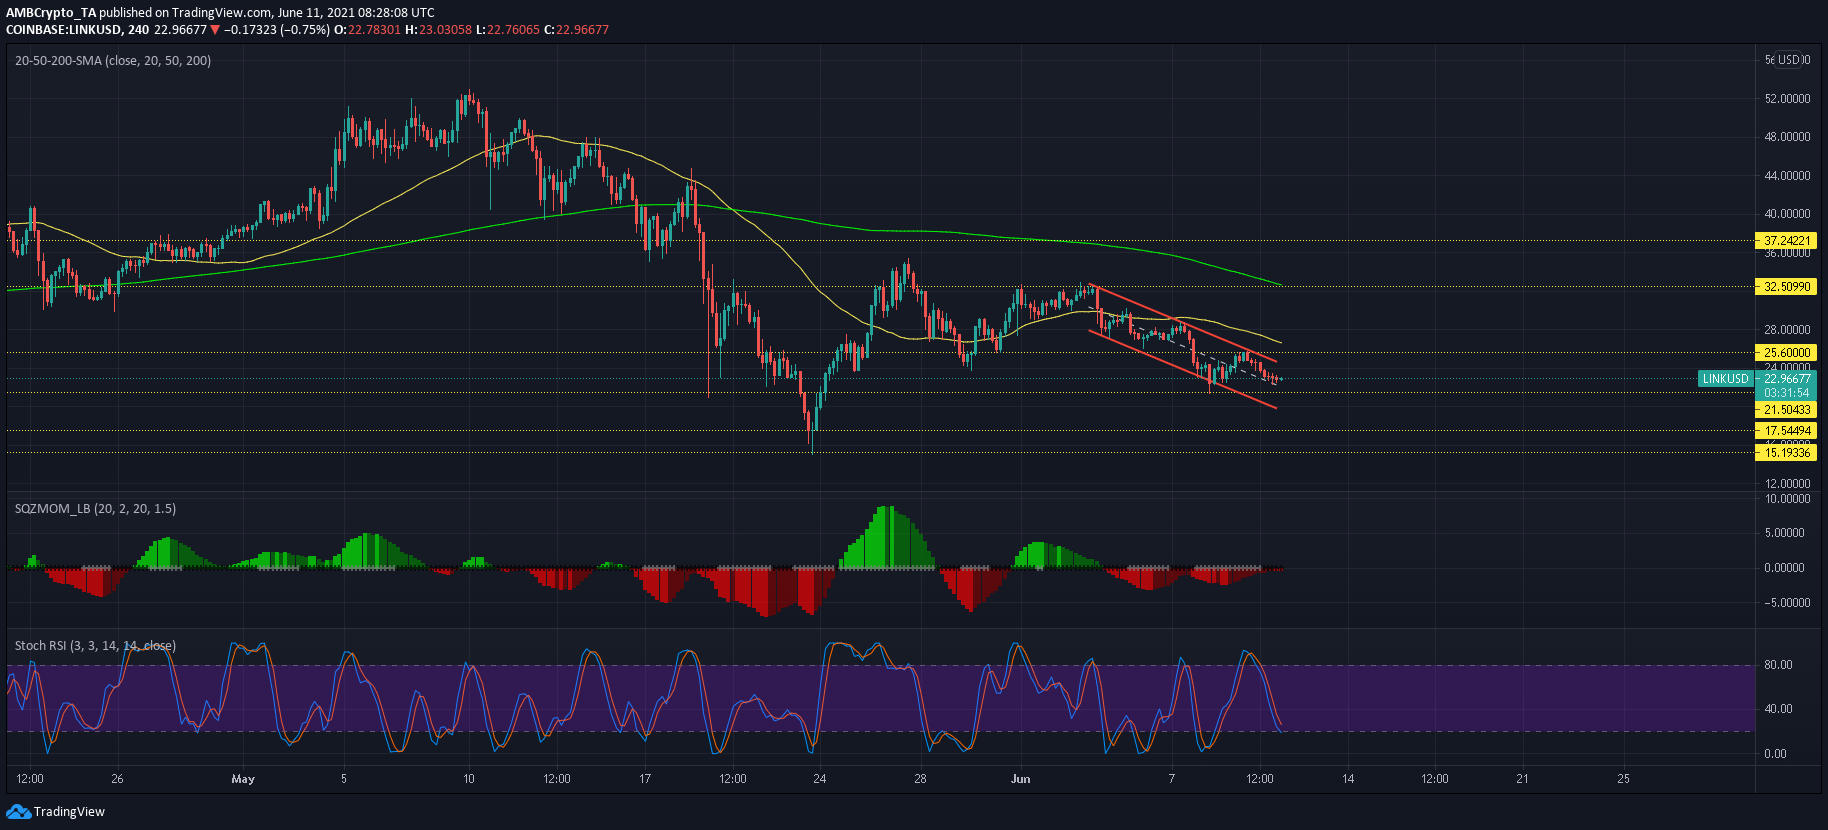
Chainlink’s recent upgrade to its ecosystem came via the launch of Keepers– designed to decentralize and automate smart contract functions. As far as its price is concerned, the update did correlate to some bullish movement but a breakout above $25.6 was denied by sellers. However, the bulls had an opportunity to topple this resistance once again as the price approached the $21.5-support level.
Since LINK traded within an up-channel, a breakout was expected from the pattern and this could be triggered at LINK’s next point of contact ($21.5). A 20% rally awaited LINK towards $32.5 and the same would be confirmed in case of a hike above the 50-SMA (yellow).
According to the Squeeze Momentum Indicator, bearishness was on a decline and downwards pressure could be seen at LINK’s next defensive line. A bullish crossover was yet to materialize in the Stochastic RSI, but it did trade in the oversold territory- An area of reversal.
Cosmos [ATOM]

Source: ATOM/USD, TradingView
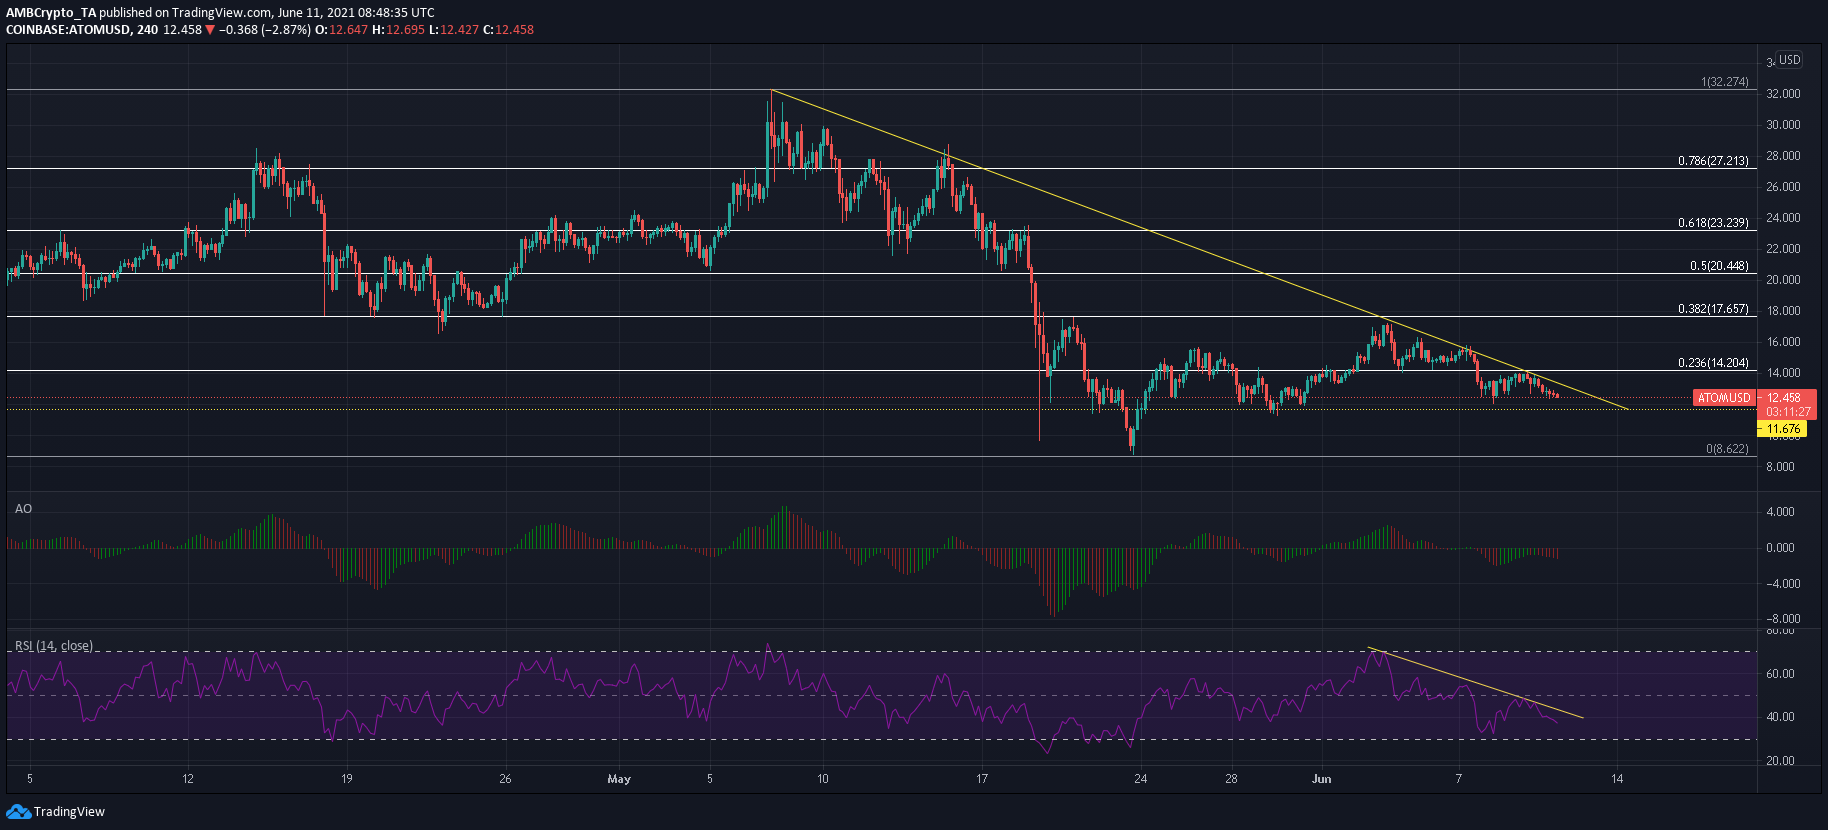
Voting was currently underway on Cosmos Hub’s proposal to increase the network’s inflation rate – An update that would help protect the network against unboding shocks. As the vote’s deadline of 16 June is approaching, ATOM’s price was restricted on its 4-hour chart.
ATOM did attempt a bullish comeback over the past few days but an upside was denied at the 23.6% Fibonacci level ($14.2). As an upper sloping trendline pierced through its chart, bulls faced an uphill task to regain control in a downtrend. Bearish momentum was on the up, according to the Awesome Oscillator, while the RSI’s lower highs confirmed ATOM’s price action.
A demand zone lay between $8.6-9 and ATOM could revisit this area over the coming weeks.
Dash [DASH]

Source: DASH/USD, TradingView
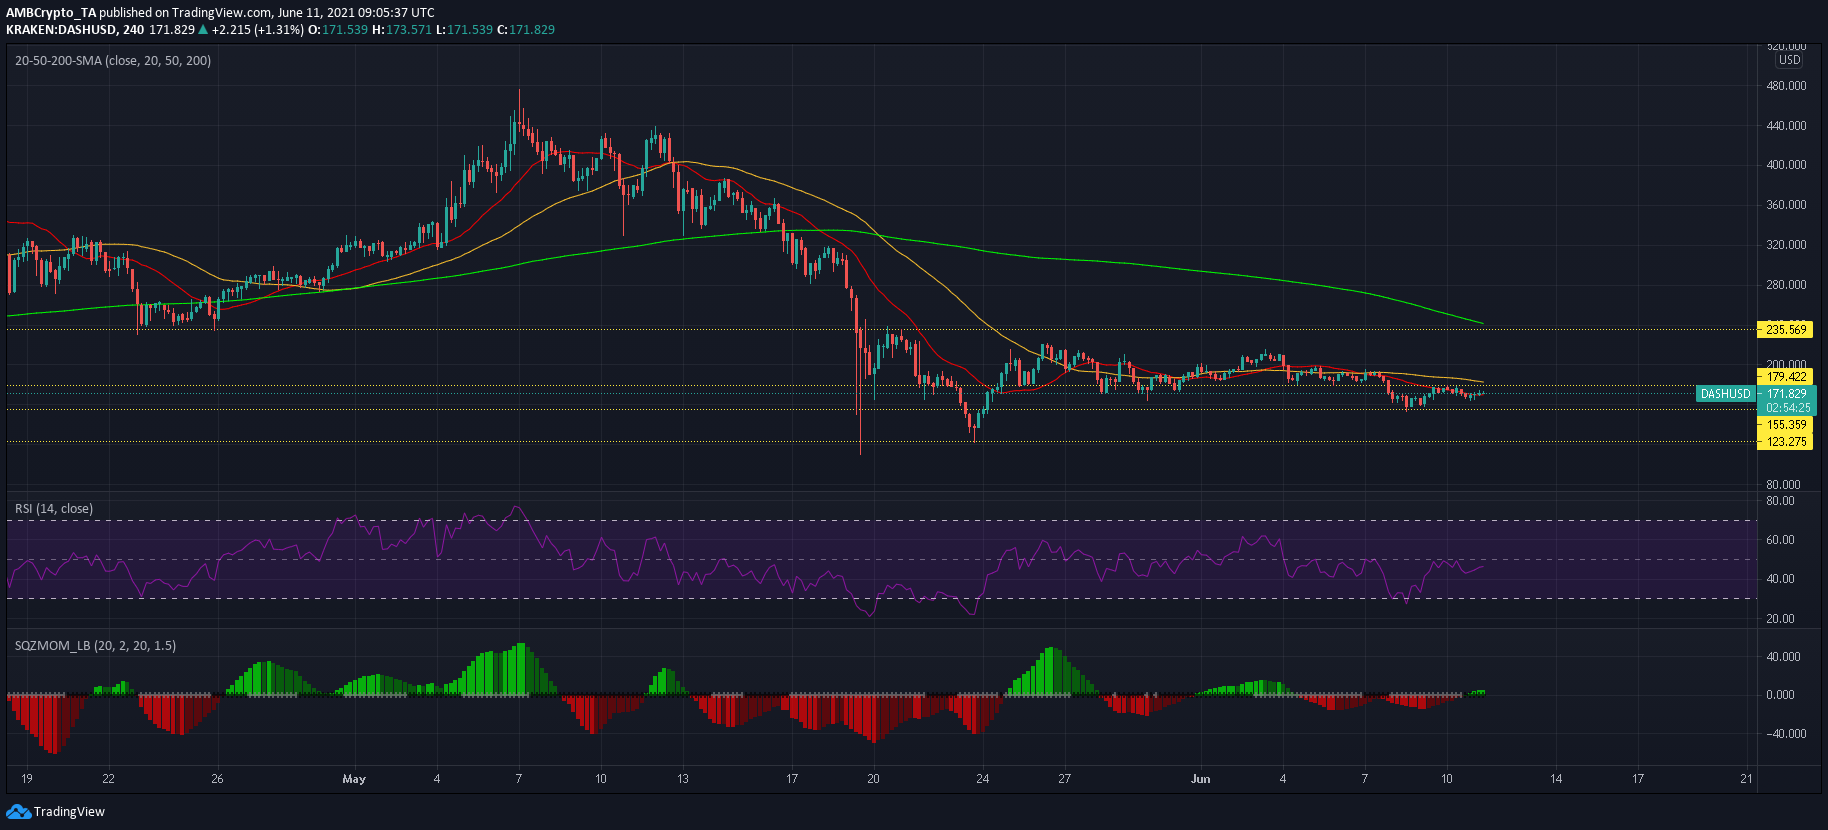
Dash’s losses were minimal as the cryptocurrency traded at $172, down by 1% over the last 24 hours. In fact, its indicators suggested some upside and bears could be tested at the $180-resistance and 50-SMA (yellow). The Squeeze Momentum Indicator registered green bars as momentum built up on the buying side. The RSI was pointed north and would likely take another jab at a move above 50. Such a development could see RSI trade in bullish territory.
In a favorable outcome, DASH could climb above its 50-SMA and target its next resistance mark at $235.5 – An area that coincided with the 200-SMA (green).


