
BNKR crypto dips 27% from ATH! – Watch THIS key level next
Analysis

Chainlink [LINK] traders must consider the $7 level significant because…
Posted:
Journalist

Disclaimer: The findings of the following analysis are the sole opinions of the writer and should not be considered investment advice.
Chainlink [LINK] has not been a strong performer in the markets in recent months. Alongside the rest of the altcoin market, LINK saw a slump in value in May. It does not look likely to recover anytime soon.
With Bitcoin [BTC] also below the $20k mark, the long-term trend for Chainlink did not look promising. Yet, over the next week or two, LINK could register some gains. Key resistance levels are highlighted for Chainlink going forward. Buying opportunities could arise if these are flipped to support.
LINK- 1-Day Chart
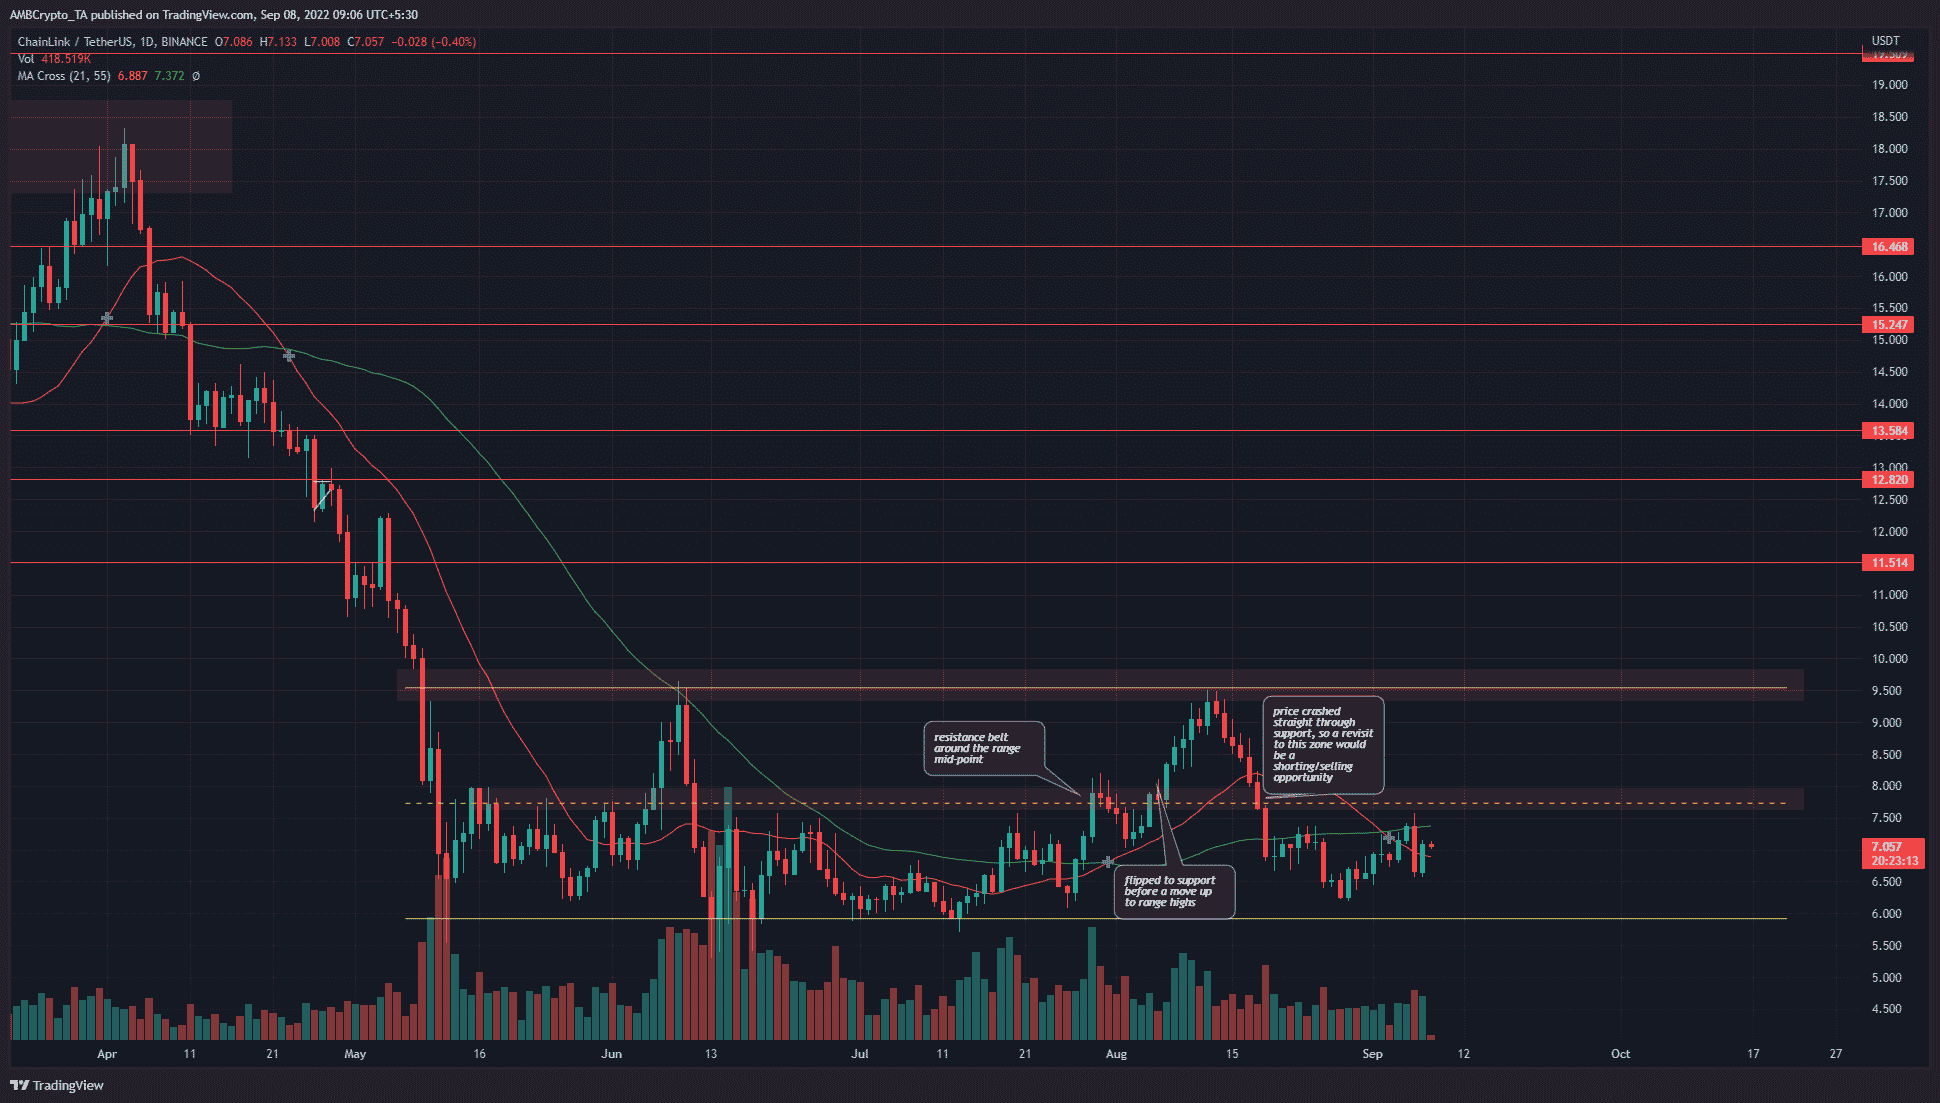
Source: LINK/USDT on TradingView
Chainlink has traded within a range from $9.5 to $5.9 since May. There were two significant resistance zones that have impeded the bulls in these months. Highlighted in red, these zones are the mid-range and the range highs at $7.5 and $9.5 respectively.
In late July, a test of the mid-range forced Chainlink to pull back to the $7.15 area. The price was able to break past this resistance decisively in August. During this surge, it also flipped the $7.75 mid-range value to support.
As August progressed, Bitcoin’s bearishness forced heavy selling across the market. LINK plunged from the range highs to $6.5. At press time, the $7.15 and $7.75 were the most significant resistance levels to watch out for.
Rationale
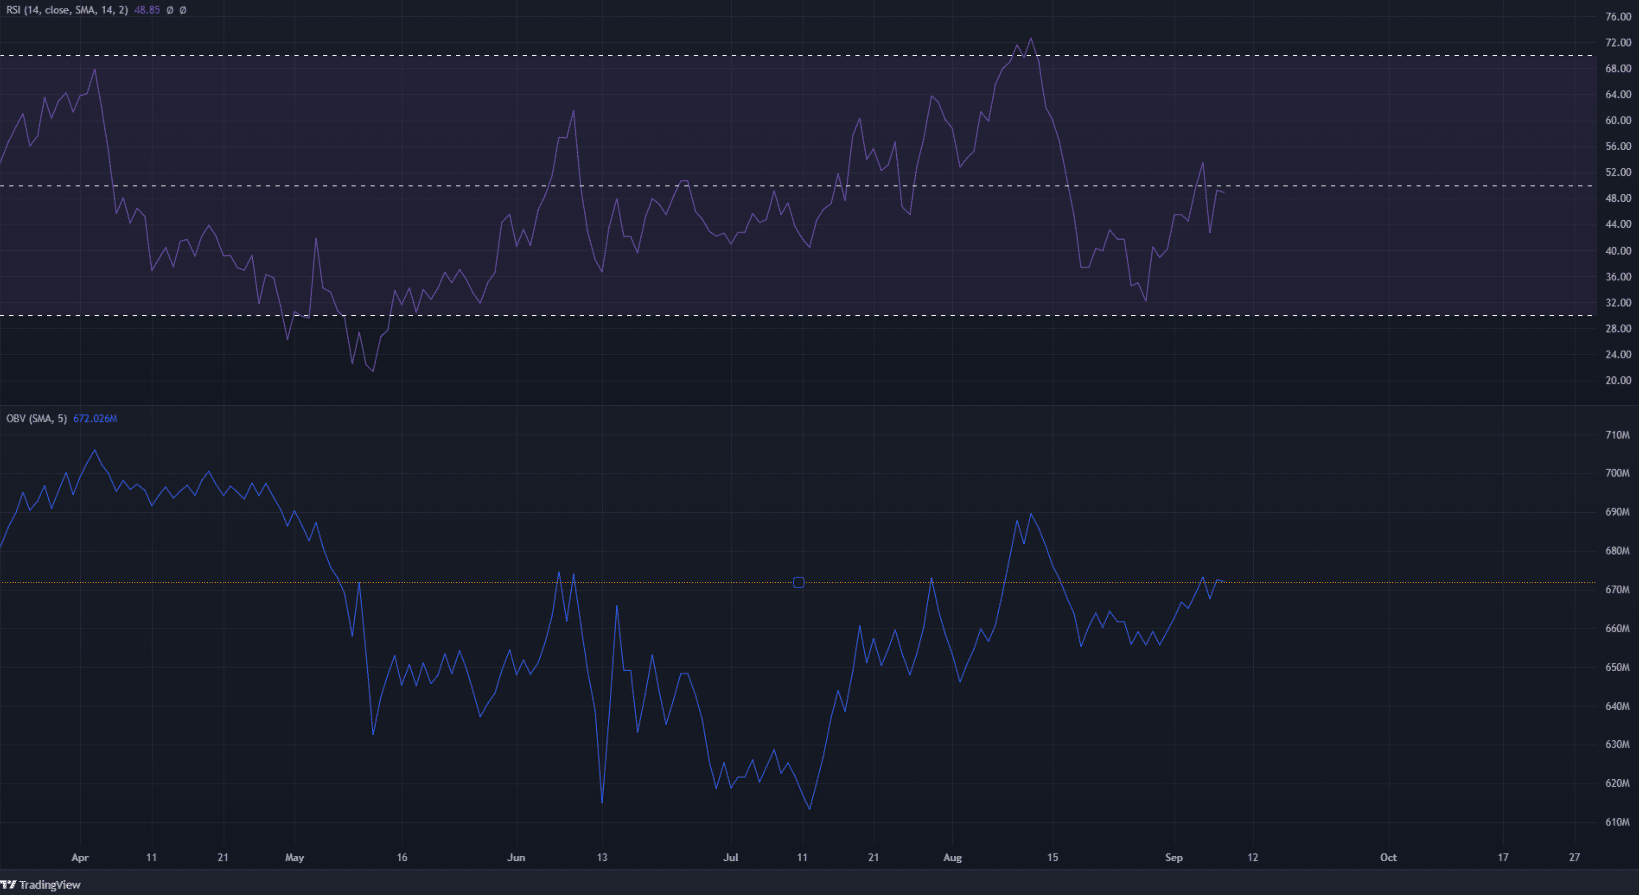
Source: LINK/USDT on TradingView
The daily Relative Strength Index (RSI) was not yet above the neutral 50 mark. Hence, per the indicator, the momentum still lay on the bearish side.
If LINK can flip this level to support, there was a chance that it could climb above 60 to enter the strong bullish momentum area. The 21-period SMA (orange) was below the 55-period SMA (green). Therefore, the moving averages did not show bullish momentum either.
The On-Balance Volume (OBV) also sat at a key resistance from May. This level was breached in early August, but the bulls were unable to hold on. In the coming days, another move upward could materialize. Such a move would indicate strong buying pressure.
Conclusion
If the OBV and the RSI can rise above their respective resistance levels, it would add strength to the bullish bias of LINK. However, at the time of writing, the $7.15 and $7.75 were strong resistances. They would need to be flipped to support before Chainlink bulls can force a move to the $9.5 range highs.


