Chainlink, Litecoin, Matic Price Analysis: 30 May

After Bitcoin attempted to reclaim the region above $35,000, the broader cryptocurrency market trimmed losses over the last 24 hours. Alts such as Chainlink, Litecoin and MATIC bounced back from certain support levels and looked to post some gains moving forward.
Chainlink [LINK]
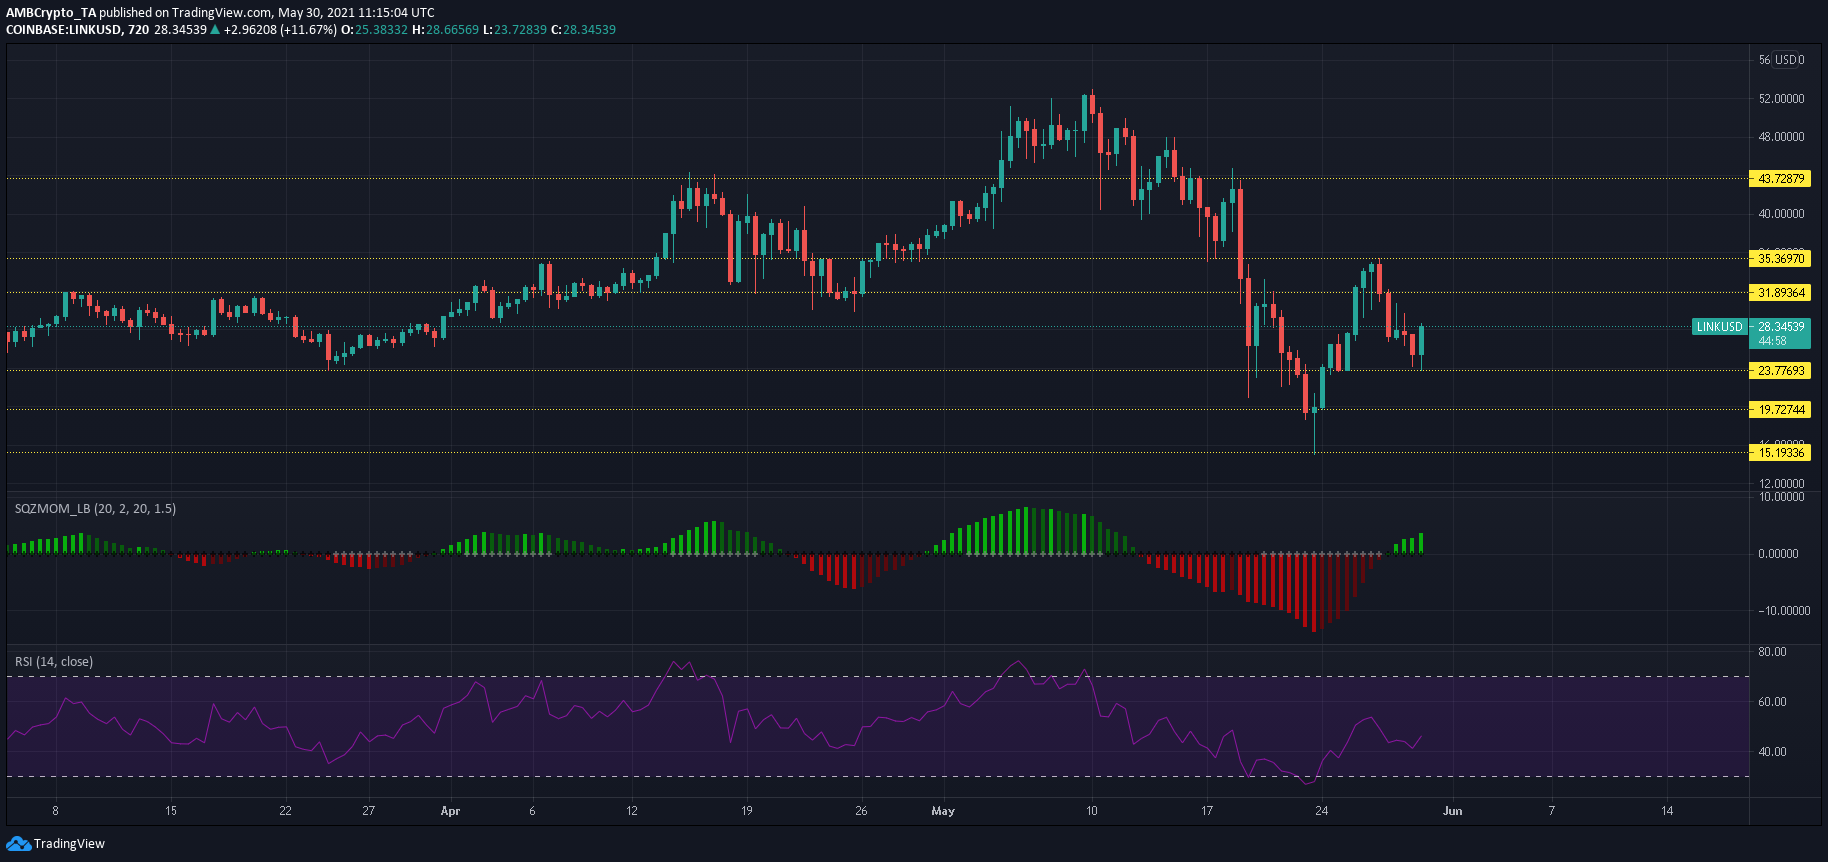
Chainlink traded close to $23.7-support at the time of writing- a defensive line that has countered multiple pullbacks since February. A bounce-back was expected from this region but gains would likely be limited to the upper ceiling at $35. In case of a breakdown, additional areas of defensive lay between $19.7 and $17.2.
Squeeze Momentum Indicator highlighted some bullish momentum but the block dots indicated a ‘market squeeze’. Gains were likely to be limited in such an environment. RSI was yet to rise above 50 but eyed a move above its bearish territory.
Litecoin [LTC]
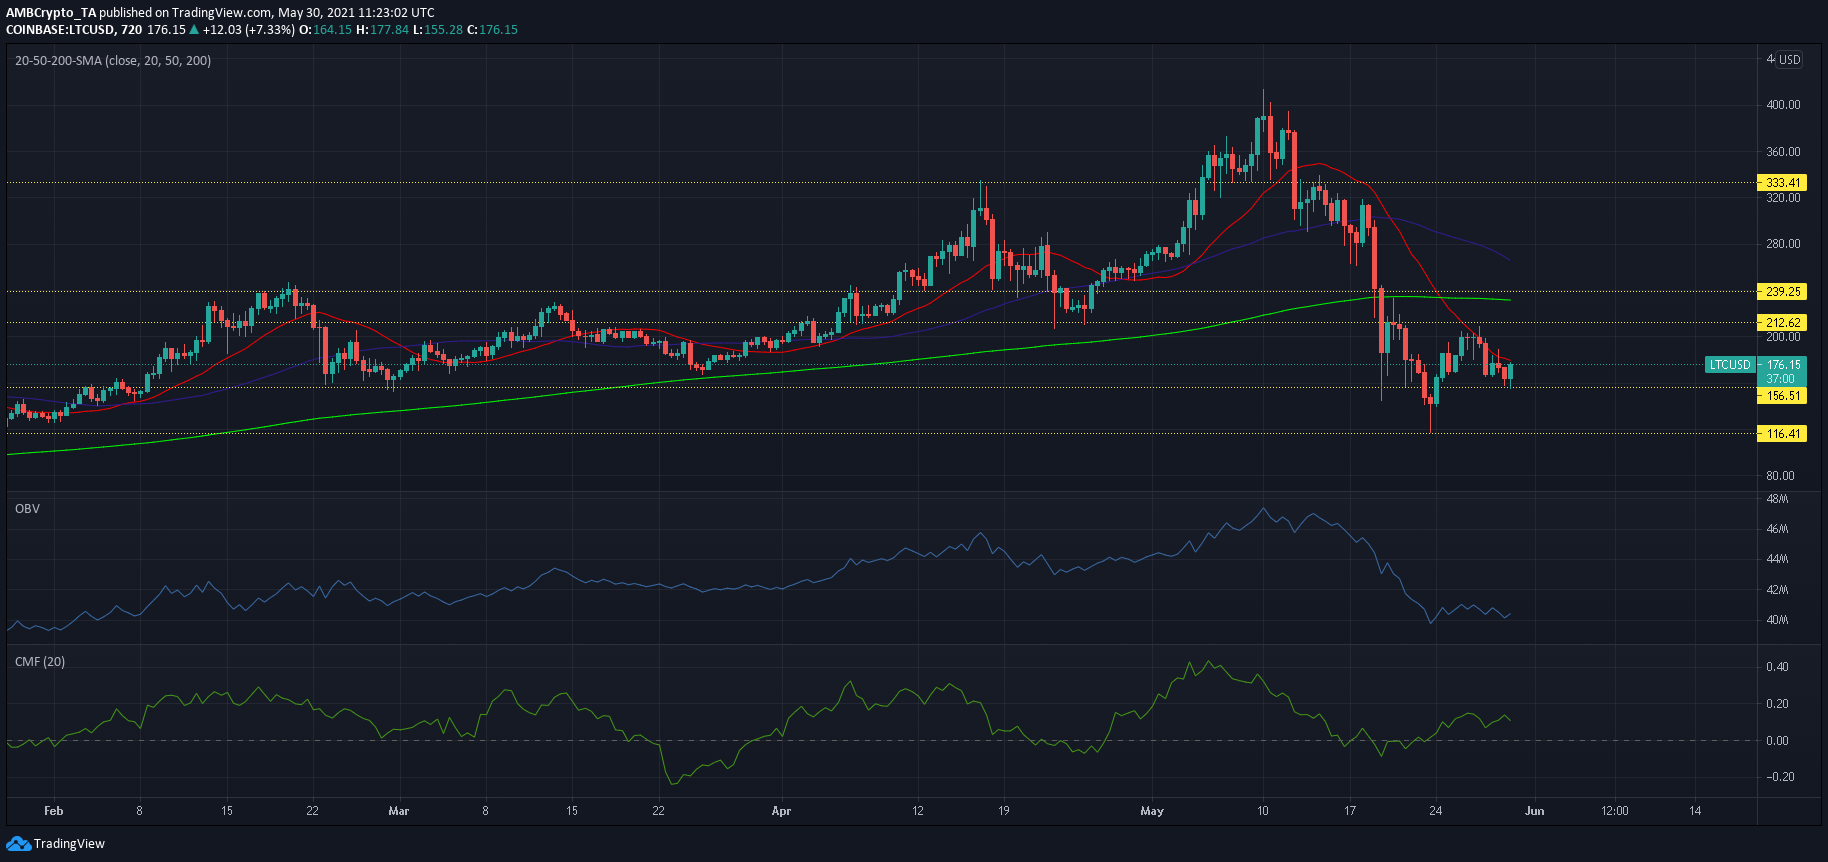
A key region to reclaim for Litecoin lay above $239-240. This area showed a confluence of strong resistance lines and 200-SMA (green). A jump above this zone would likely push LTC to levels seen prior to the crypto dump. With regards to LTC’s short-term trajectory, the channel between $116 and $156.6 could see buying activity and prevent an extended sell-off.
After nosediving from May 13, OBV maintained a flat-like movement as buying pressure nearly equaled selling pressure. Capital inflows were still healthy according to CMF as it maintained above the half-line.
MATIC
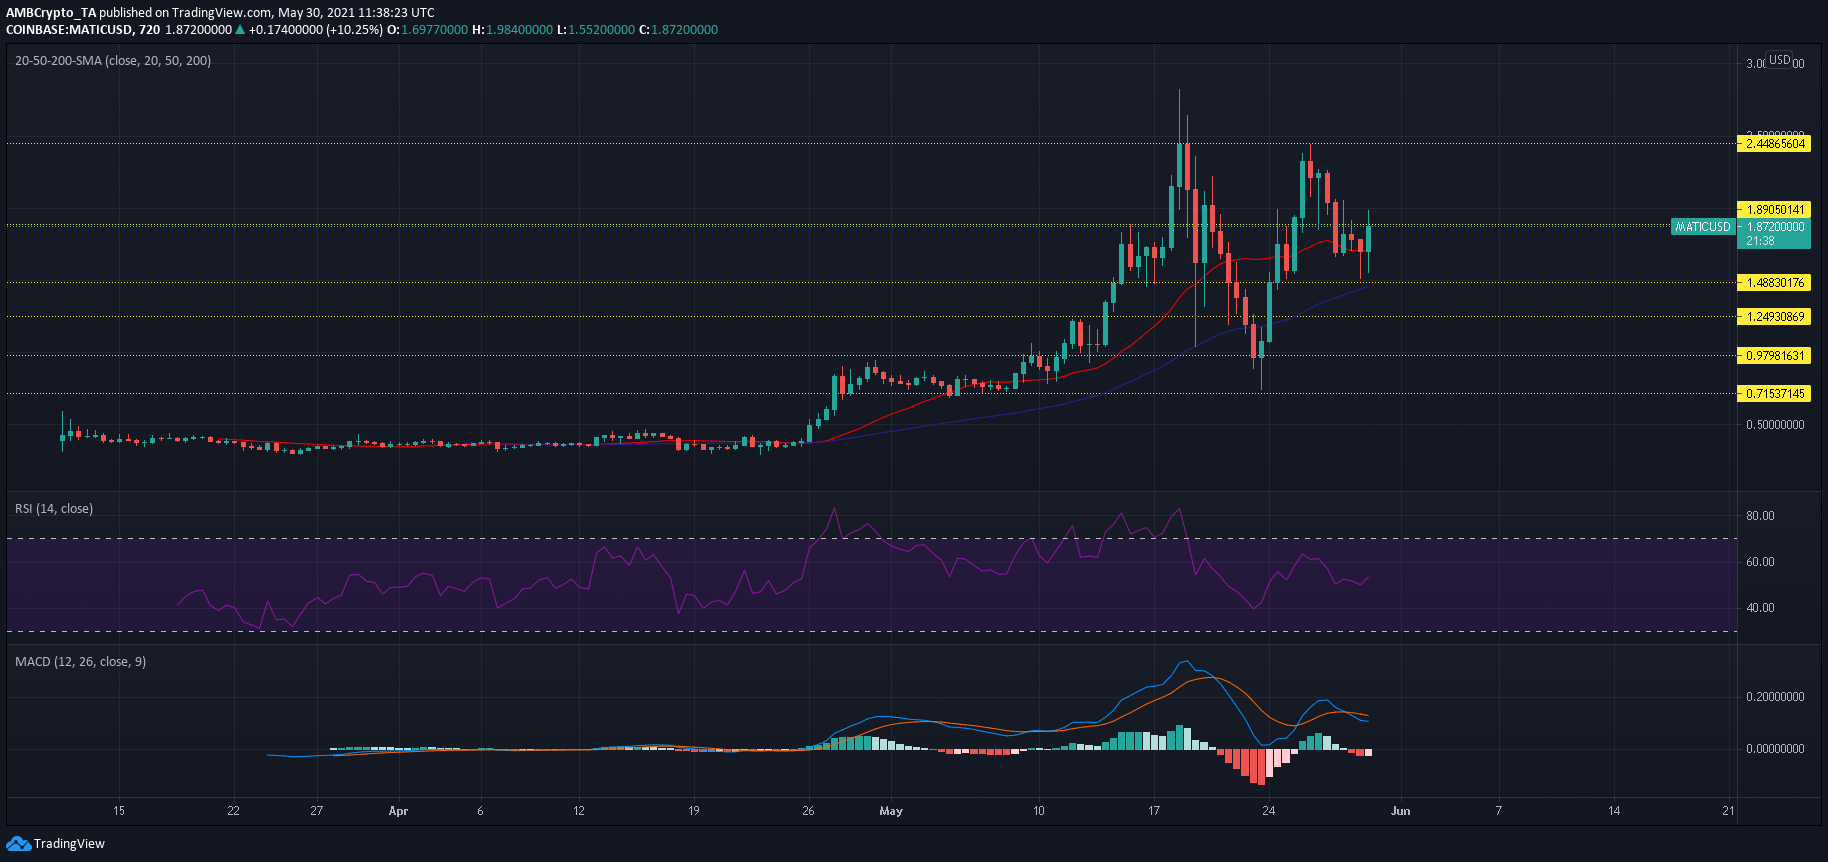
MATIC held above its defensive zone around $1.48- a region that clashed with 50-SMA (blue) on the 12-hour chart. On its next leg upwards, bulls would look to target a break above $2.44-resistance as this could open the door for a sharper price rally. However, broader market cues could be necessary for such a price swing. In case of a breakdown from $1.48, buyers could step in anywhere above $1.24 and negate another sell-off.
After highlighting overbought conditions since mid-April, RSI was in reset mode over the past few days. During this time, it largely traded within 40-65. A bearish crossover was evident on MACD but the index was still above half-line and the threat of a sharp retracement was not yet evident.


