Chainlink Price Analysis: 29 March

After registering a market capitalization of $11.14 billion, the price of Chainlink [LINK] was trending at $26.58, at the time of press. Even though altcoin has been pushed out of the top 10 list of cryptocurrencies by CoinMarketCap owing to its falling market cap, it was still offering strong returns to investors.
Data suggested that LINK witnessed a 108% year-to-date growth and was currently dealing with a dull market movement with the bears taking over.
Chainlink [LINK] Daily Chart

Source: LINKUSD on TradingView
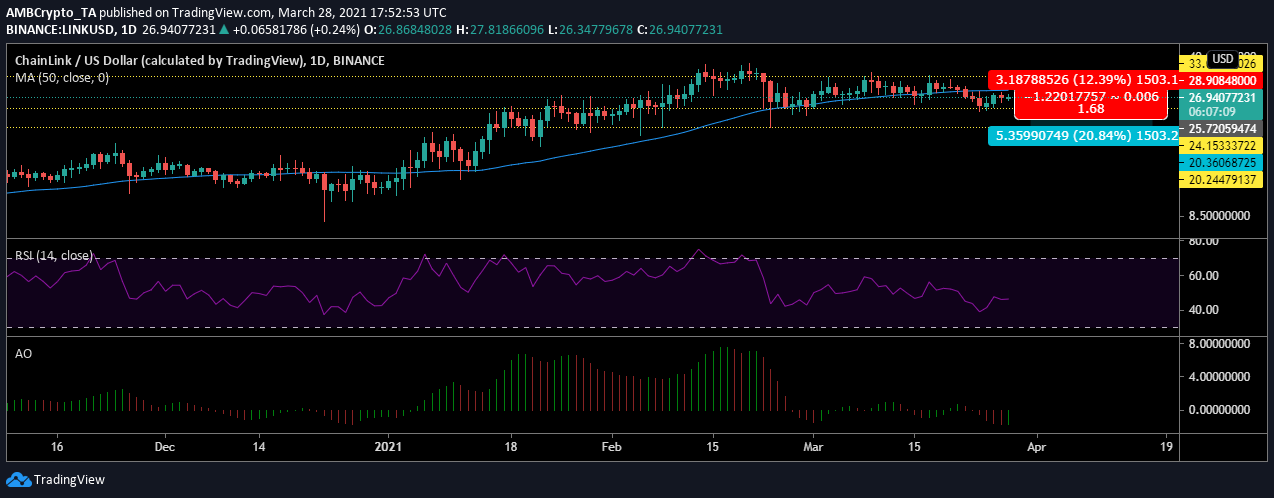
The above chart noted a strong selling pressure in the middle of March that pushed the asset’s value to its lowest support at $20. However, the bullish momentum has emerged and pushed the price higher.
LINK has currently marked strong resistance at $33.08 which it has been testing in the past few days. Given the bearishness, the current price has moved closer to support visible at $24.15 and the indicators have flipped to make the bearishness more evident.
Reasoning
The 50 moving average has managed to move above the price bars and was acting as resistance at $28. The price has hit this level and reversed and has not been able to breach it.
Meanwhile, the relative strength index was showing that the coin has more or less remained close to the equilibrium zone and has not dropped into either the oversold or the overbought zone. Currently, RSI’s value was 45 which was close to equilibrium meaning the current price level is supported by both the buyers and sellers.
However, the momentum in the market has been negative. This could bring in more sellers if the price managed to breach the support at $24. The next stop for LINK might be close to $20.
Crucial levels
Entry-level: $25.72
Take profit: $20.36
Stop-level: $28.90
Risk to Reward: 1.68
Conclusion
The current Chainlink market could provide a shorting opportunity to the traders if it breaches support at $24. However, the market has remained bearish for a few days and a sudden move in the price could be expected at this point.


