Chainlink slips beneath $7 once more after the rejection at this level
The RSI for LINK remained below neutral 50 and the CMF was below +0.05. Together it showed that a downtrend was in progress, and capital flow into the market was diminishing.

Disclaimer: The information presented does not constitute financial, investment, trading, or other types of advice and is solely the writer’s opinion.
- The market structure was bearish once more.
- A continued move beneath $7 appeared more likely.
Chainlink attempted to recover from the losses after the nosedive from $8.8 on 18 April. The bulls put up a fight and managed to defend the $7 support level for close to ten days but were eventually overwhelmed.
Read Chainlink’s [LINK] Price Prediction 2023-24
On higher timeframes, Chainlink traded within a range whose mid-point was at $7.6. The bulls were thwarted when they tried to rally prices to this level, and momentum was in bearish favor once again.
The loss of the psychological $7 level could incite more downside
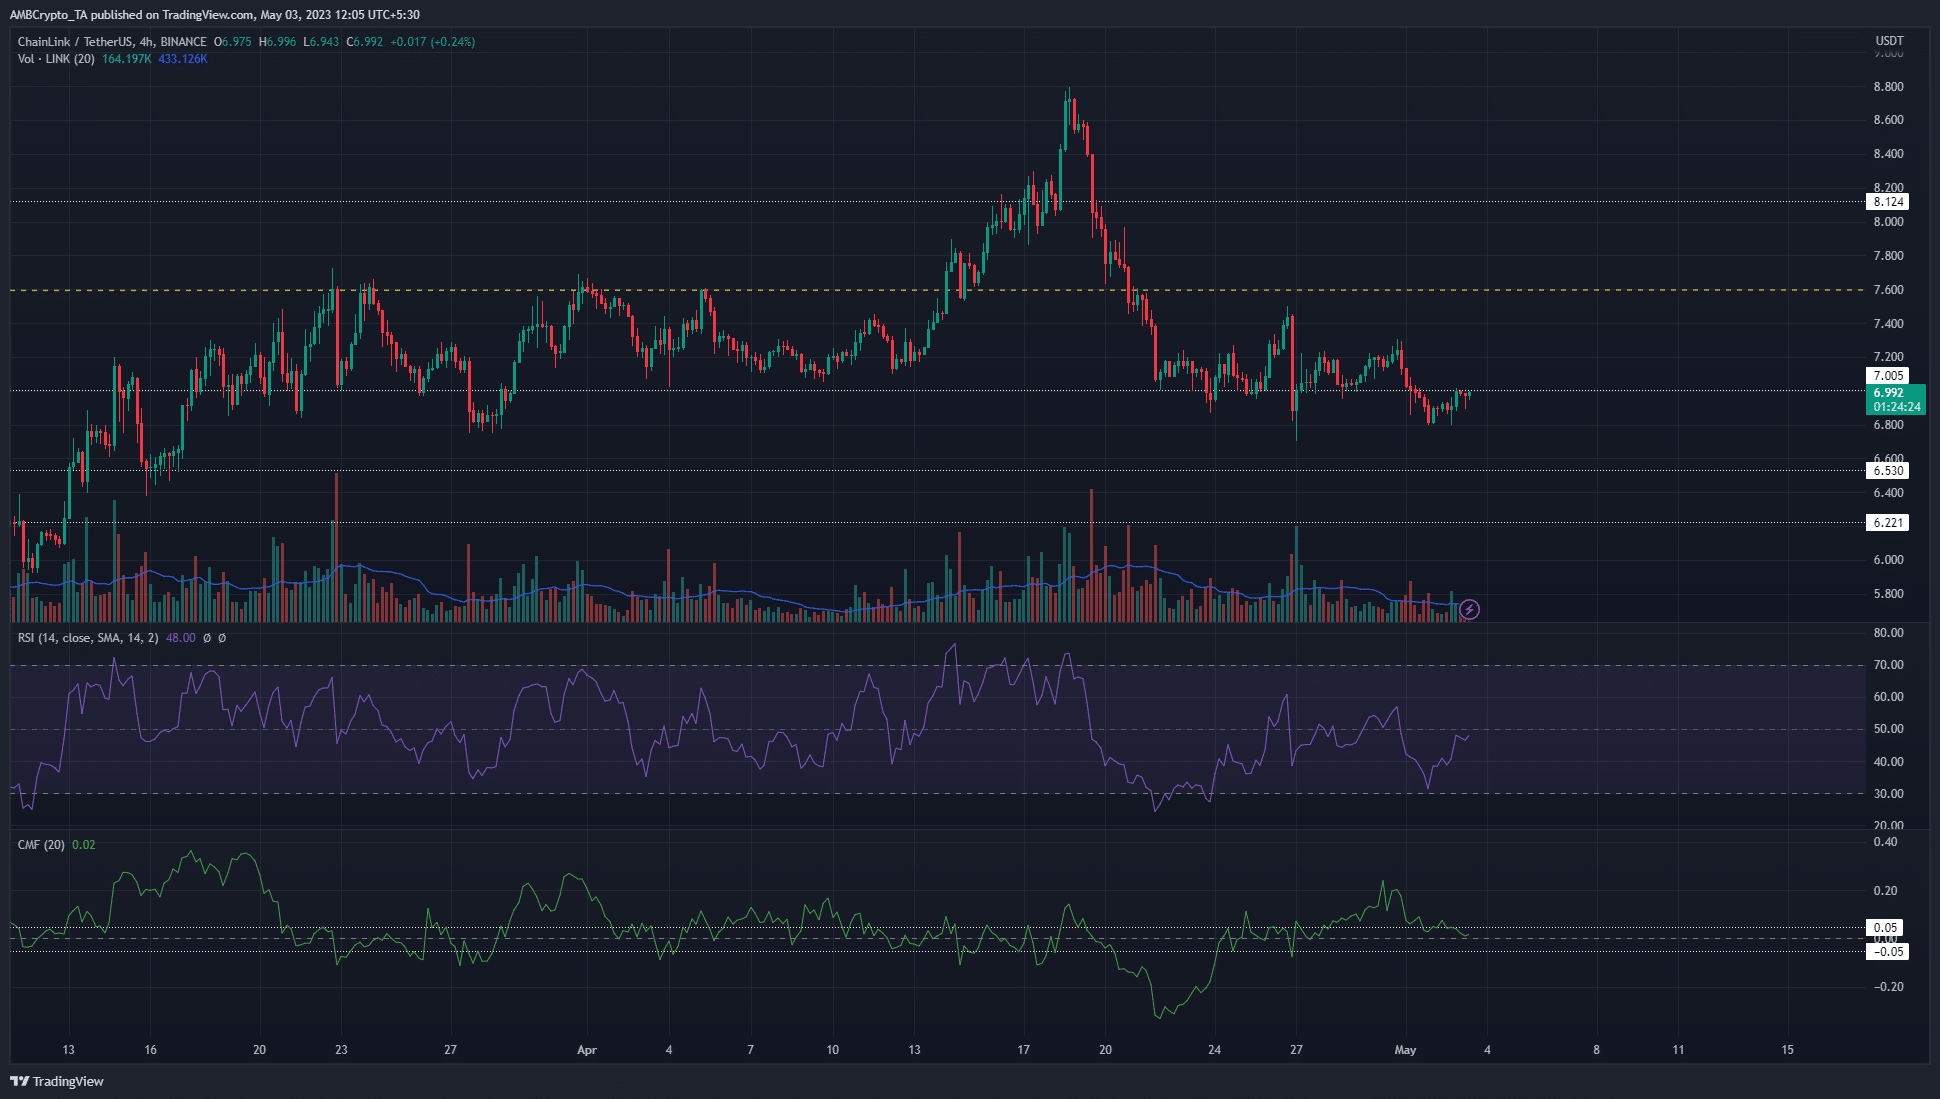
Over the past five days, the trading volume has slowly declined, and Chainlink has gradually fallen down the price charts over the past week.
The 4-hour chart showed that the sharp pullback on 26 April meant that the market structure was bearish almost immediately after it broke a lower high.
This trapped a lot of long positions and discouraged the bulls, and this bearish sentiment has not lifted yet. The price has not breached a recent high yet, and it fell beneath the $7 support level as well.
The RSI remained below neutral 50 and the CMF was below +0.05 as well. Together it showed that a downtrend was in progress, and capital flow into the market was diminishing. This was not encouraging news for the bears.
Realistic or not, here’s LINK’s market cap in BTC terms
Recent hours of trading saw LINK retest the $7 level as resistance. The market structure on H4 was also bearish. Taken together it showed that more losses could materialize for Chainlink.
The spot CVD began to flatten out, are the buyers pushing back?
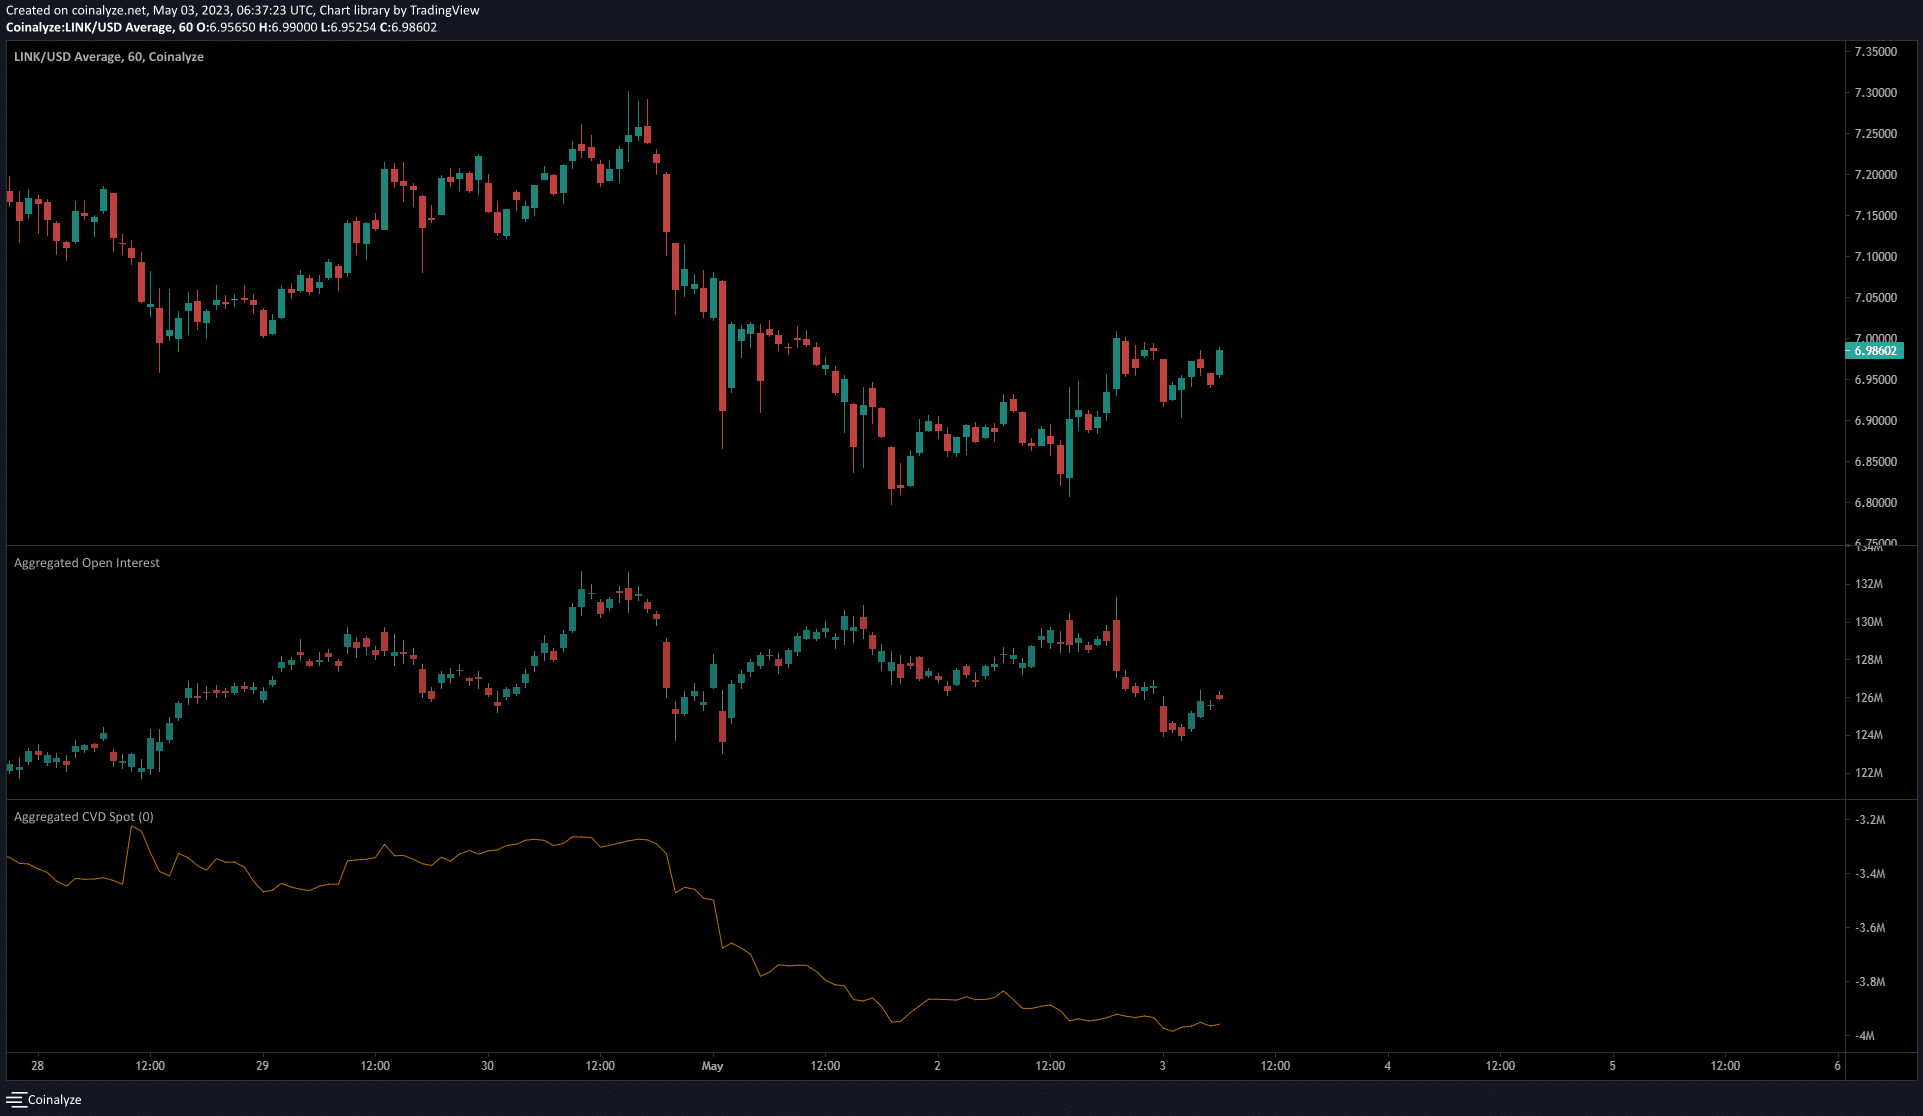
The spot CVD has been in decline over the past four days, according to the 1-hour chart from Coinalyze. Yet, in the past 24 hours before press time, the downward slope of the metric began to flatten.
This showed that selling pressure was weakening, but bulls do not yet have the upper hand.
The Open Interest showed that bearish sentiment was extremely strong on 1 May, when LINK fell beneath $7 for the first time on the lower timeframes. The rising OI and falling prices meant participants were shorting the asset.
Since then, this has changed, and speculators’ bearishness has cooled down, but the sentiment remained in favor of the sellers.


