
Bitcoin price prediction – Short-term traders should look out for THIS supply cluster!

Chainlink was projected to dip below $39 before resuming its northbound movement. Uniswap broke north from a descending channel and presented targets at $44 and even $47. Finally, Filecoin could move sideways between a restricted channel before its next upswing.
Chainlink [LINK]
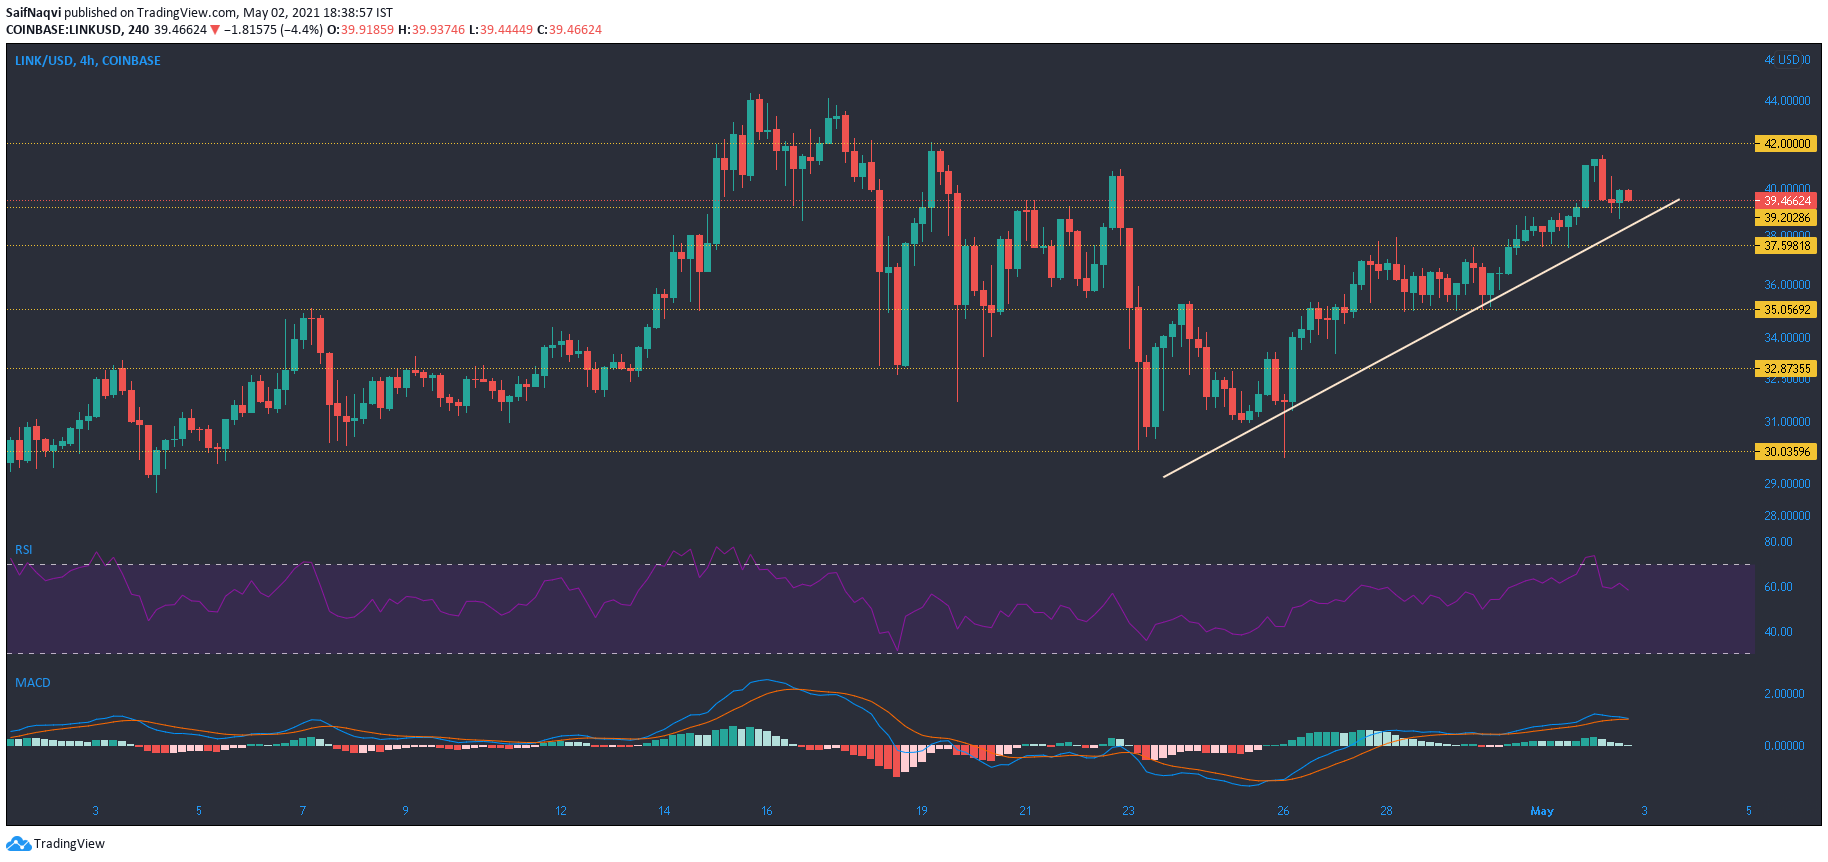
Source: LINK/USD, TradingView
Chainlink’s upward trajectory was halted shortly before snapping the $42-mark, but this was expected to be a minor roadblock on its path to recovery. Higher lows on the 4-hour timeframe underlined the bullish progress made by LINK since dropping as low as $30.
Since RSI dropped below the overbought territory, the price needed to stabilize before its next leg upwards. This could take place at multiple support levels highlighted in the 4-hour timeframe. A fall towards $35 would even offer long opportunities for traders. MACD was on the verge of a bearish crossover and dips can be expected moving forward.
Uniswap [UNI]
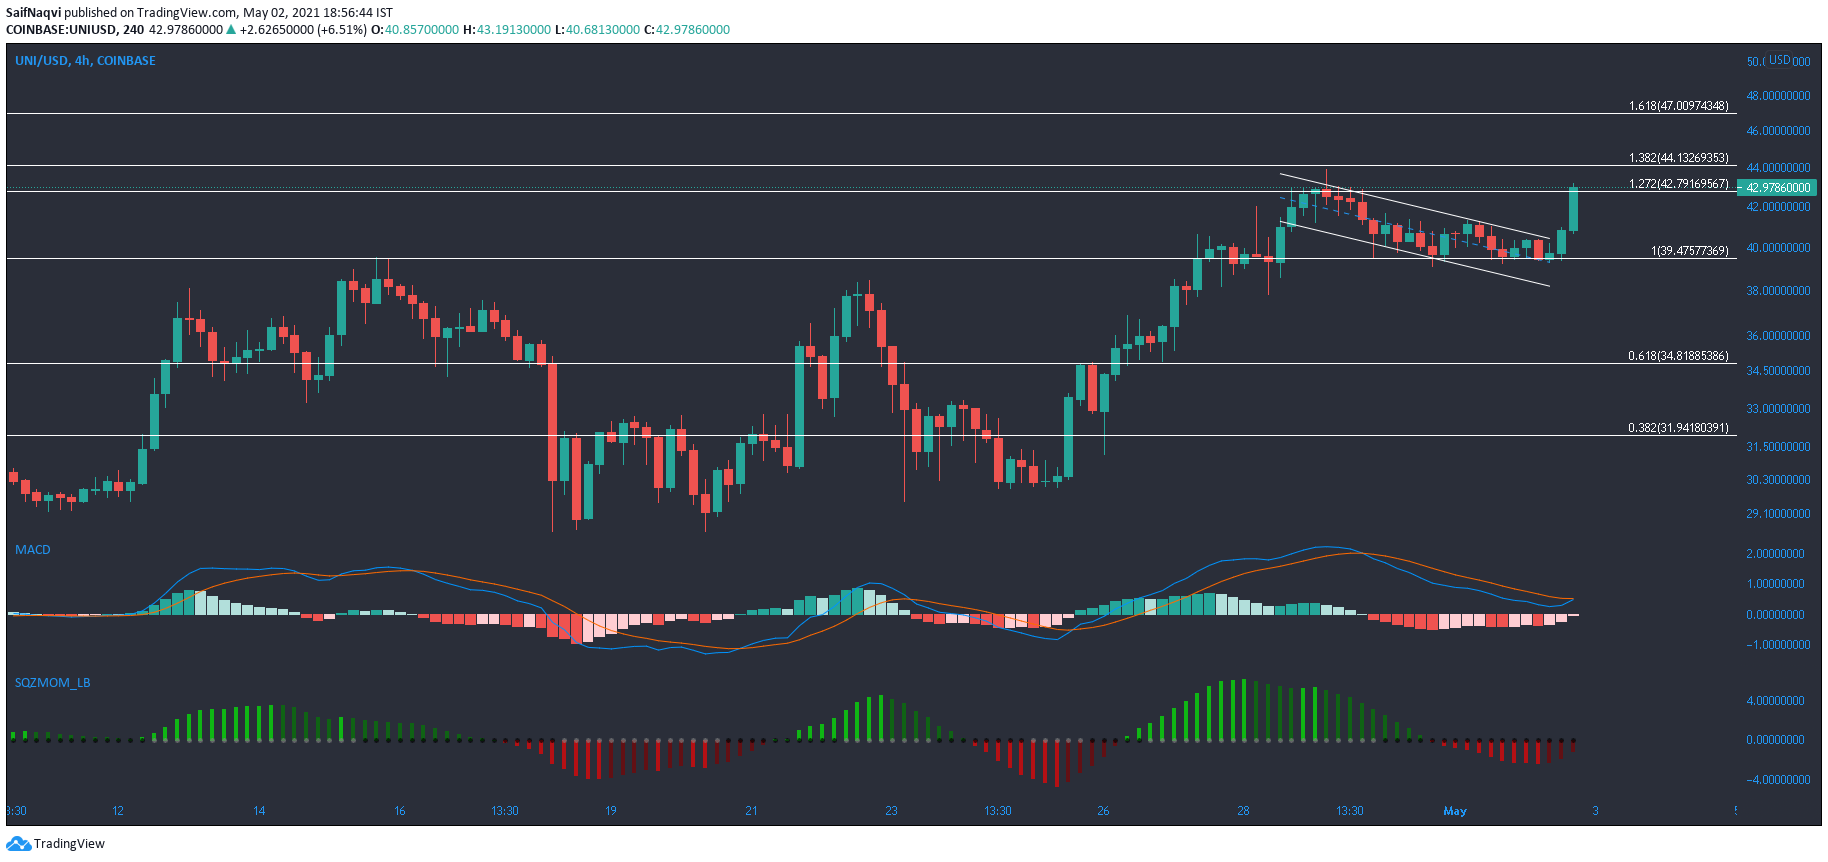
Source: UNI/USD, TradingView
Uniswap broke north of its descending channel and a rise above the upper trendline represented gains of over 5%. In fact, there was a chance of extended gains over the coming sessions according to the on-chain metrics. Squeeze Momentum Indicator rose towards the half-line as momentum looked to switch hands to the bullish side. This also meant that buying at the current price was possible, although a better entry point would have been at $39.
The MACD was yet to complete a bullish crossover and the 24-hour trading volumes should be observed for sharper moves within the UNI market. Fibonacci levels at 138.2% ($44.1) and 161.8% ($47) presented some targets in case of an extended bullish outcome.
Filecoin [FIL]

Source: FIL/USD, TradingView
Although Filecoin made losses of over 2.5% in the last 24 hours, the 4-hour chart showed an interesting development. The 50-SMA (red) closed in on the 200-SMA (green) and a successful crossover would not only push FIL above $167.8-resistance, but also present buy signals for traders. However, the current market conditions reflected a degree of bearish pressure. This was made prominent by the red bars on the Awesome Oscillator.
On the other hand, RSI maintained itself above 50 and in bullish territory. There was a chance of some sideways movement within the current channel before a crossover between the two moving averages took place on the charts.


