Chainlink, VeChain, Sushi Price Analysis: 21 February

As Bitcoin kept challenging its $39,000-resistance, Chainlink registered a 4.4% 24-hour surge as it attempted to overturn its Point of Control. Moreover, the retracement phase pulled VeChain below its 20-50-200 SMA. The near-term technicals of VeChain and Sushi exhibited a bearish inclination but kept the bullish hopes alive as the buyers kept exerting pressure.
Chainlink (LINK)
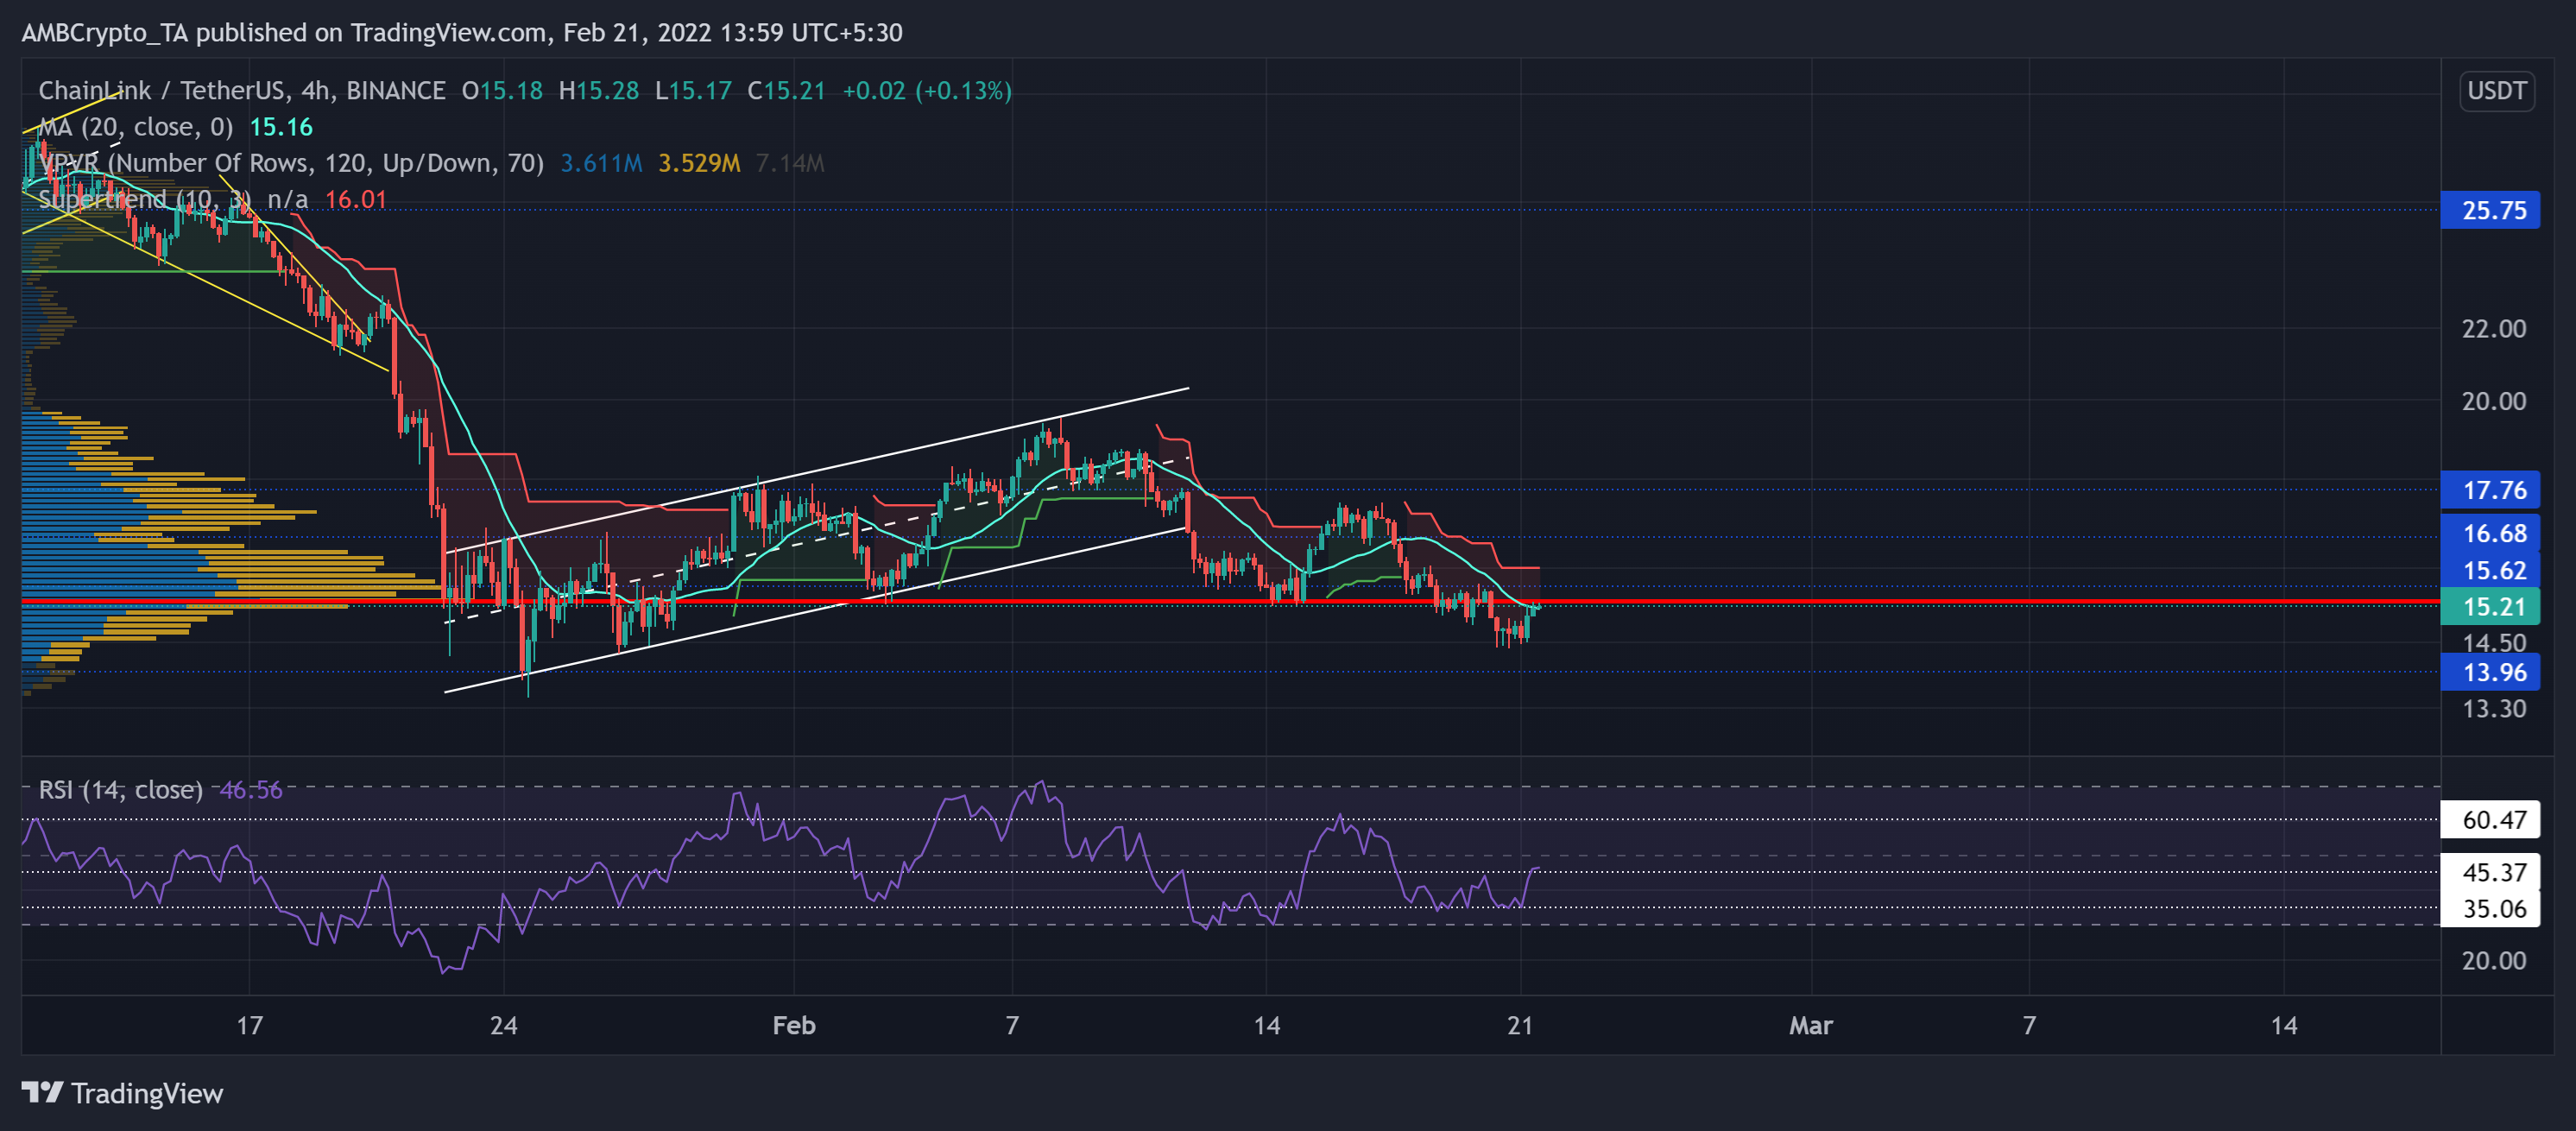
The selling pressure heightened after the bulls lost the vital $25.75-level.
As a result, the LINK plunged to hit its six-month low on 24 January. However, the bulls finally showed up at the $13.96-mark as the alt recorded over 44% gains in an ascending channel (white).
Over the past ten days, LINK saw a patterned breakdown and lost the crucial Point of Control (red) near the $15-zone. This level also coincided with the 20 SMA (cyan). Any close above this level could propel a restest toward the $16.8-mark.
At press time, the LINK traded at $15.21. After testing the 35-support multiple times, the RSI revived above the 45-level. it still needed to topple the midline to pave the way for a strong recovery. Besides, the Supertrend still displayed red signals, favoring the sellers.
VeChain (VET)

Since poking its 11-month low on 24 January, VET saw a 58.1% recovery as it tested the $0.069-resistance on 8 February. Over the past few days, VET formed a falling wedge (white) on its 4-hour chart.
Now, the bulls found it challenging to test the upper trendline of the wedge. Further retracements would continue to see a test near the $0.049-mark before a possible reversal.
At press time, VET traded below its 20-50-200 SMA at $0.051. The RSI broke out its downtrend from the oversold region. It now aimed to find a sustained close above the 40-mark to propel any recovery chances. Also, the AO reflected the increasing buying influence but still struggled to cross its equilibrium.
SUSHI

Since 8 February, SUSHI retreated in two down-channels (white) on its 4-hour chart and flipped the 20-EMA (red) from its support to resistance. Thus, SUSHI marked a nearly 30% retracement in just the last 13 days.
This trajectory confirmed the increasing bearish vigor. Now, any close above the 20 EMA would affirm the possibility of a strong breakout.
At press time, SUSHI was trading at $3.743. The RSI recovered but still failed to cross the 42-hurdle. It still skewed in favor of the sellers after an 11 point surge over the last day. Moreover, even the CMF declined below the half-line, indicating a slight bearish edge.