Chainlink: What to expect with LINK preparing for a breakout from a squeeze zone

LINK seemed like it was poised for a strong bullish breakout after low price volatility in the last two weeks of May. However, Its price action confirmed that its long-term descending resistance line was still active through a bearish reversal. The resistance line is part of LINK’s wedge pattern which is rapidly approaching the tight squeeze zone.
LINK fell roughly 43% after peaking at $9.65 on 9 June before the bears took over. This resulted in a retracement after coming into contact with the descending resistance line. The price seems to have found support at $5.28 which is within the same ballpark as its bottom level in May.
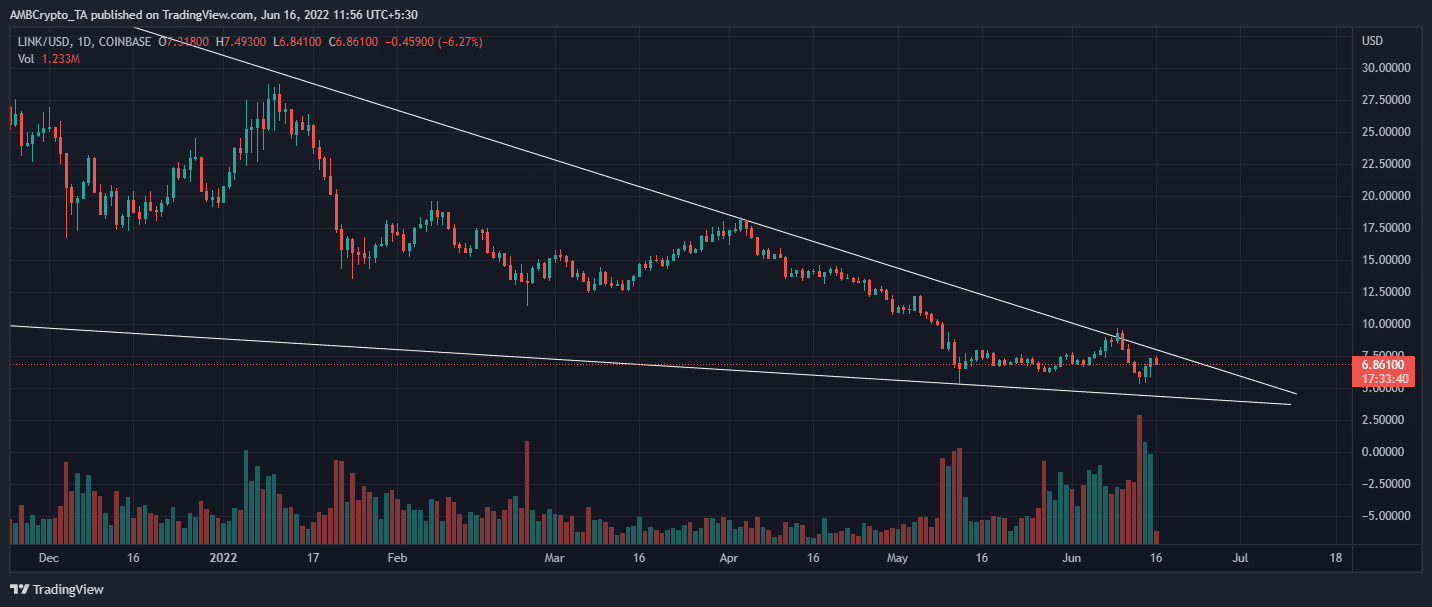
The market is not out of the woods yet and prevailing FUD suggests that the downturn might not be over. Additional selling pressure can potentially push LINK below the buy wall near May lows and towards the support line.
Such an outcome would likely push towards the $4.6 price level. Another possible outcome is a rally back towards the descending support, for another retest of a bullish breakout.
Can on-chain metrics provide more clarity on LINK’s price action?
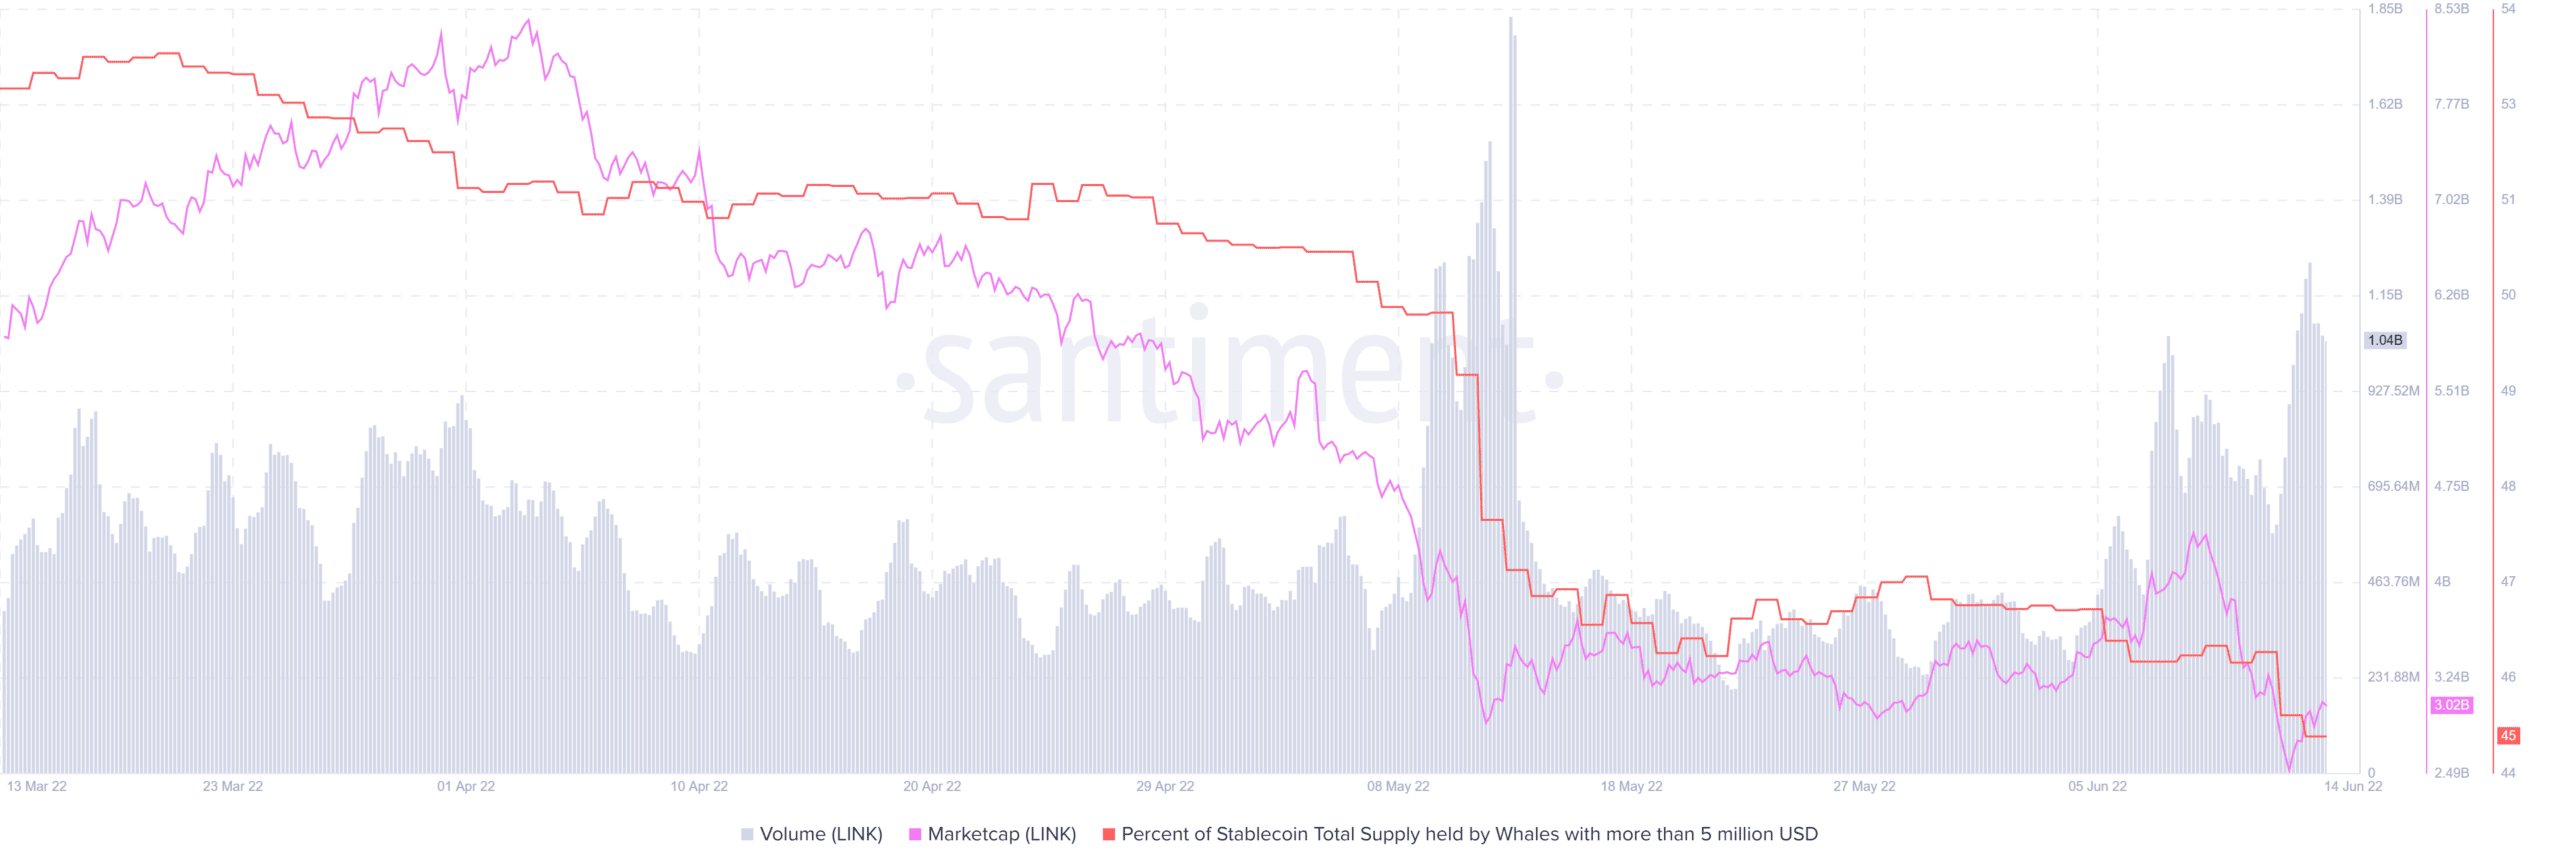
LINK’s on-chain volumes increased significantly since the start of June. The same time that its supply held by whales metric registered outflows. This suggests that it was selling volume that increased.
However, the market cap registered a notable increase up until 10 June. The divergence between market cap and supply held by whales suggests that there was profit taking which eventually led to the selloff.
The above observation was also consistent with the supply by balance on addresses. The addresses holding more than 10 million coins controlled 62.54% of LINK by 31 May but had dropped to 61.77% by 9 June.
They dropped to 59.53% by 15 June. Addresses holding between 1 million and 10 million LINK dropped from 15.83% on 31 May but increased slightly to 16.375 by 9 June. They also increased their holdings to 17.92% by 15 May.
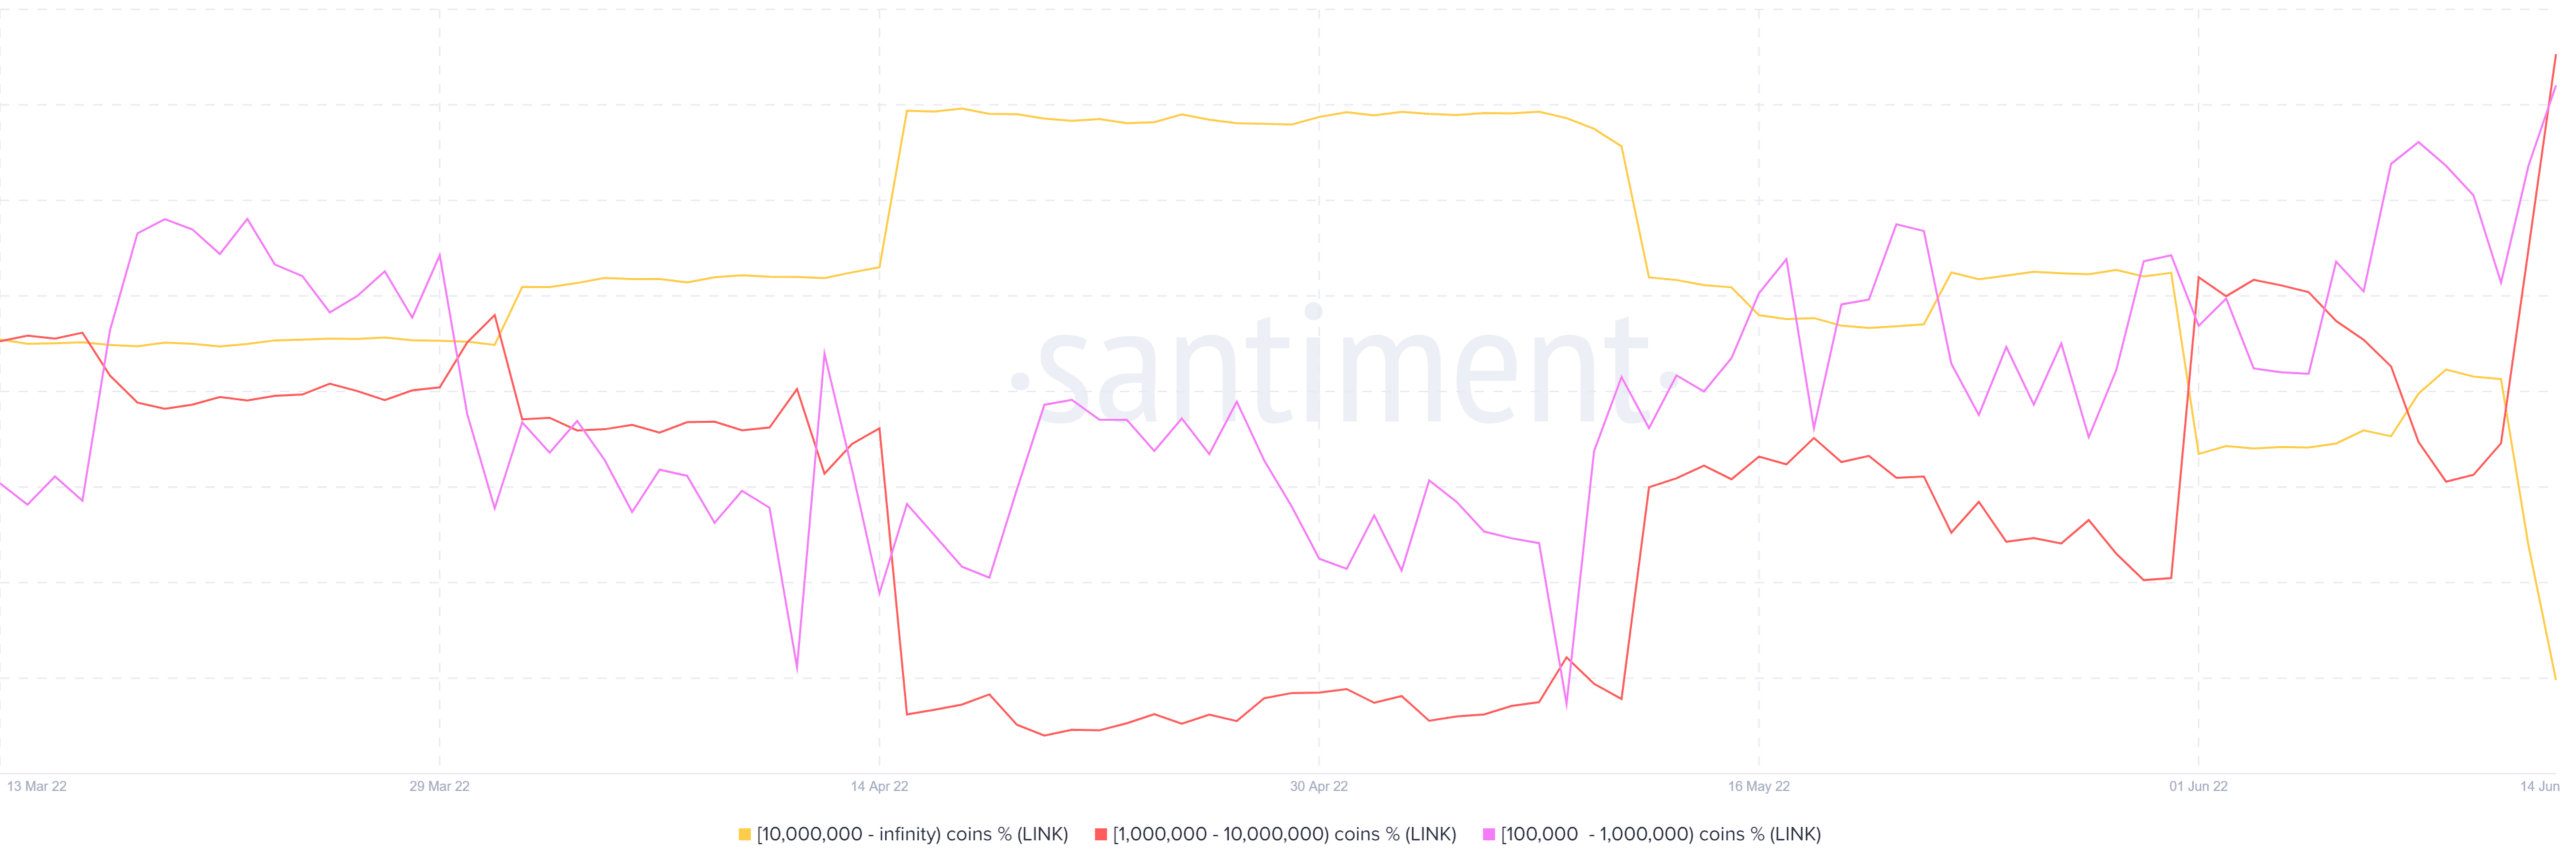
Addresses holding between 100,000 and 1 million LINK increased their holdings from 8.33% on 31 May to 8.55% on 15 June.
Conclusion
The increase in addresses in the lower categories explains why LINK managed to find support near May lows. However, it still reveals that whales are selling. LINK might thus fail to find enough buying pressure to support more upside. However, the markets are subject to sudden changes, and accumulation by whales might result in a different outcome.