ChainLink
Chainlink’s mixed on-chain signals: LINK prices to suffer?
Chainlink price trend showed that it was attempting to rebound, and other metrics show that the network remains busy.
- LINK has seen consecutive uptrends in the last two days.
- It has remained in a bull trend despite its brief drops.
New data indicates that Chainlink [LINK] has become the leading network in the Real World Asset category in terms of development activity. Although its price is experiencing a positive trend, the number of active addresses is declining.
Chainlink leads in development activity
According to data from Santiment, Chainlink ranks highest in development activity among Real World Assets (RWAs).
The chart listed 24 other RWAs, with LINK scoring 452 in development activity over the last 30 days. To highlight LINK’s dominance, the second-place network scored only around 35.
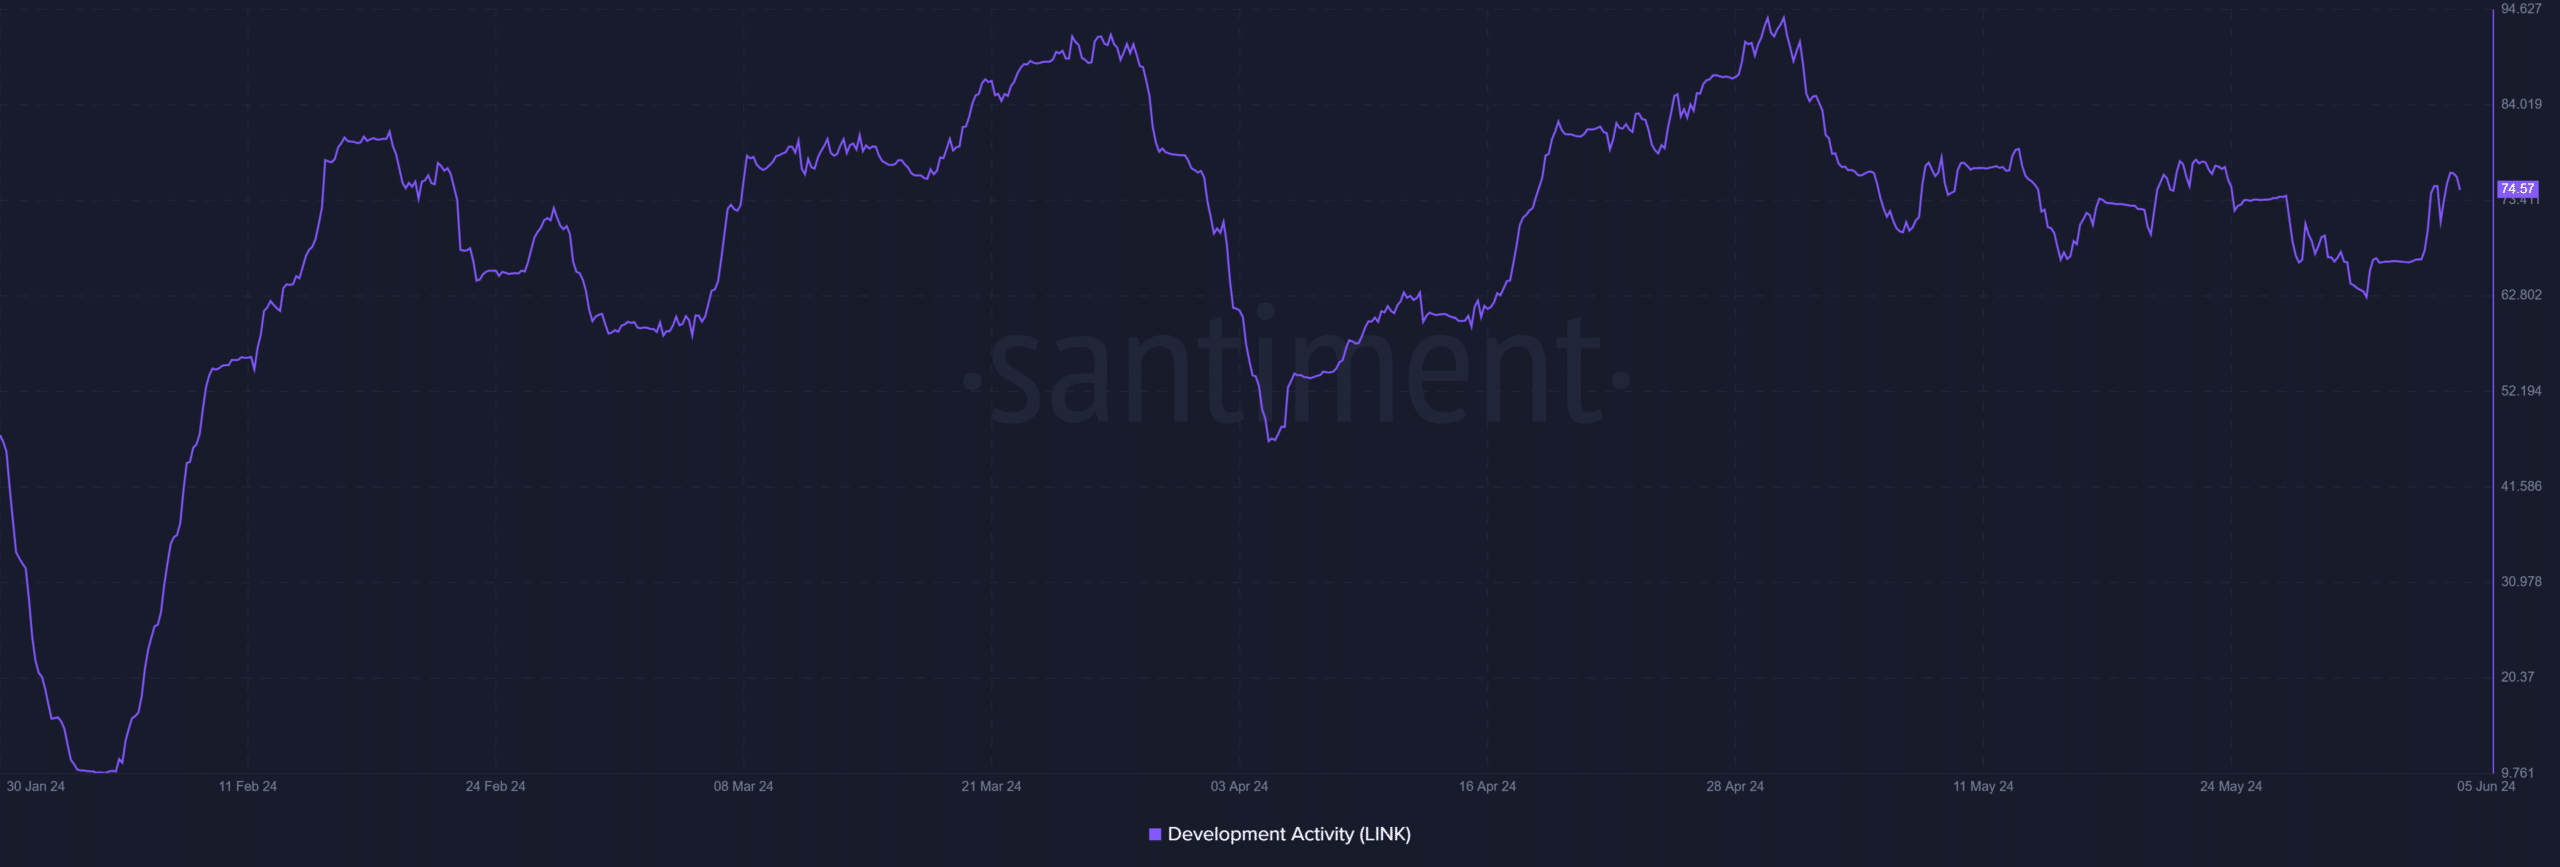
An analysis of Chainlink’s development activity on Santiment showed that the increase in this metric began in January.
Although there was a sharp drop in April, it quickly rebounded within the same month. Since then, development activity has continued to rise and has not returned to its previous lows.
As of this writing, Chainlink’s development activity was around 74.5.
Active addresses decline
An analysis of other on-chain metrics indicated they were less active than development activity. Specifically, the number of active addresses on the network has shown a slight decline.
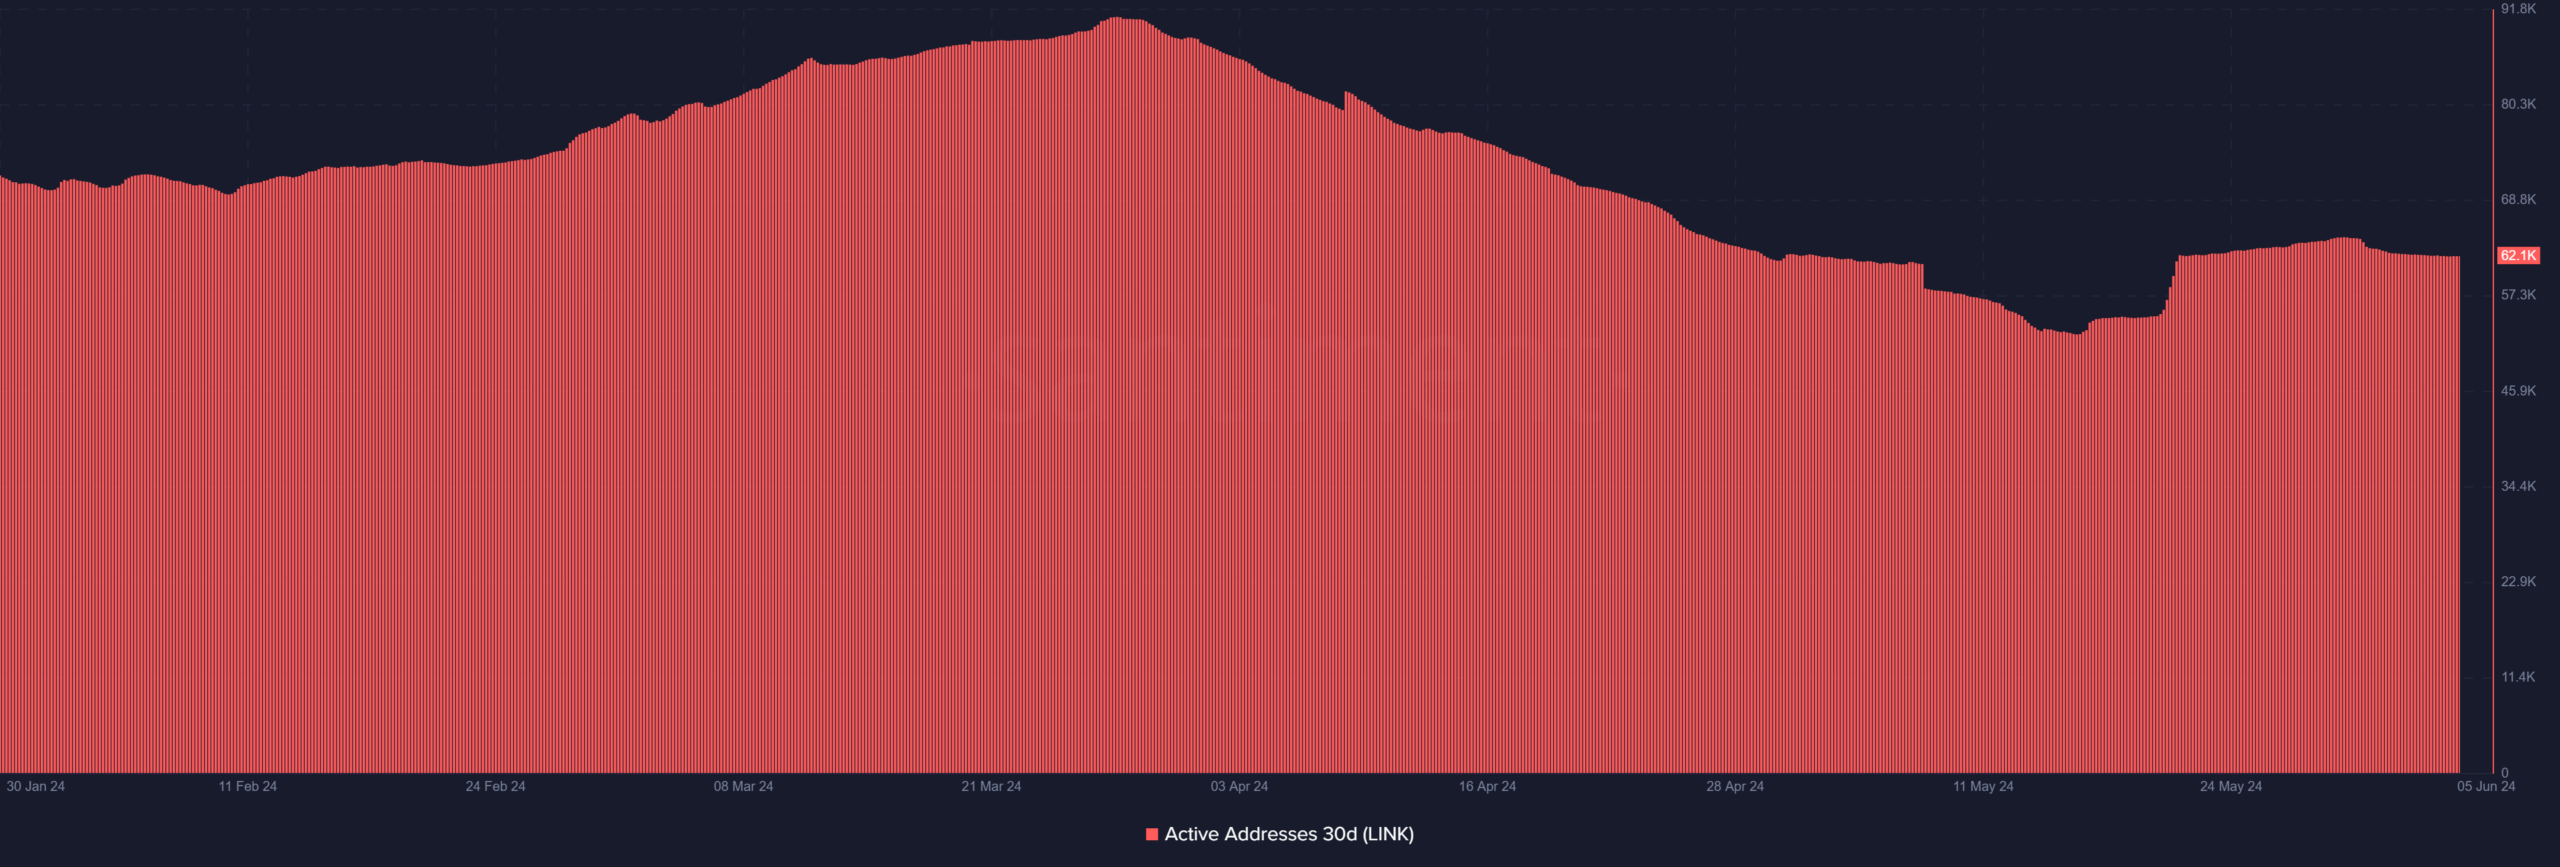
Source: Santiment
The 30-day active addresses chart on Santiment showed a slight decline from 31st May to the present.
On 31st May, the number of active addresses was 63,300. As of this writing, the number has decreased to around 62,100.
Previously, the number of active addresses had exceeded 70,000 and even reached over 80,000 at some points in the past few months.
LINK’s uptrend not enough
As of this writing, Chainlink was trading at around $17.8, with a less than 1% increase. This marked the second consecutive uptrend after it rose to the $17.7 price range with a similar less than 1% increase on 4th June.
However, these uptrends have not been sufficient to offset the significant declines Chainlink experienced in the last few days.
Chainlink’s short moving average (yellow line) was still trending below its long moving average (blue line), indicating a not-so-positive price trend.
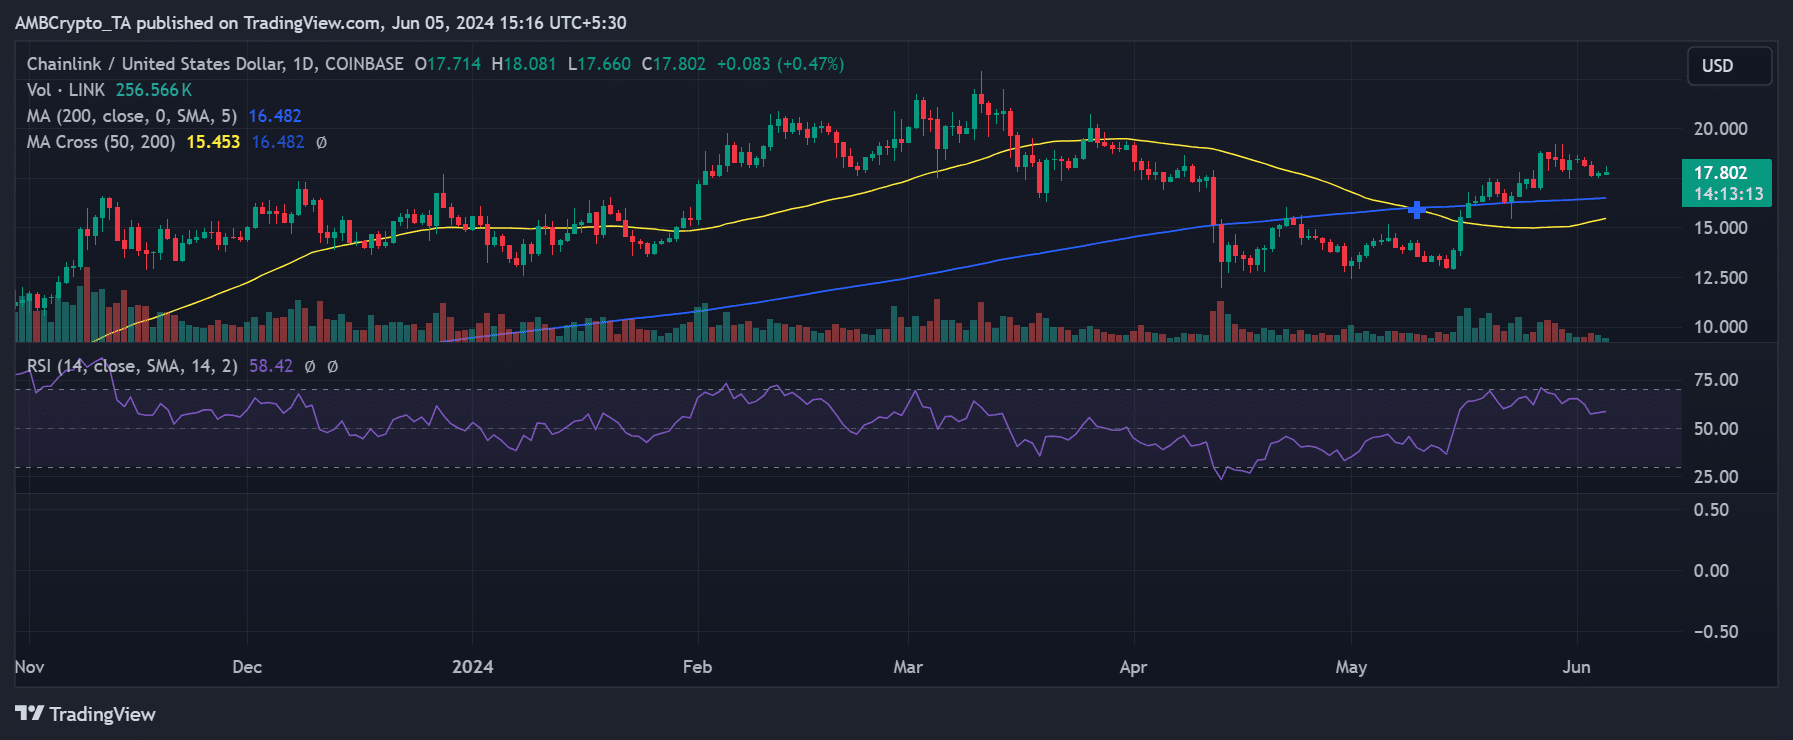
Source: TradingView
Realistic or not, here’s LINK market cap in BTC’s terms
Despite this, the current price is above both moving averages.
Additionally, an analysis of its Relative Strength Index (RSI) shows that LINK is currently in a bull trend, with the RSI above 56 at the time of this writing.