


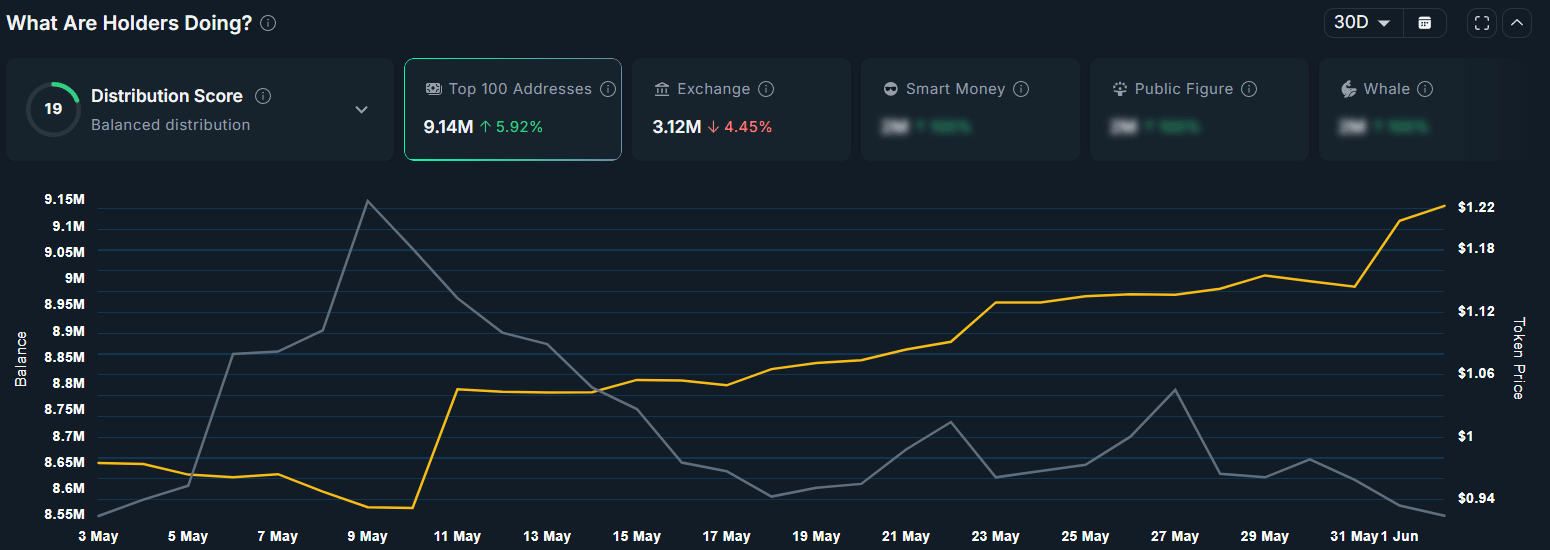


Despite some bullish indicators, FIL has been on a downtrend since December 2024. In fact, by June 2026, the altcoin had lost approximately 87% of its value during this period.
Looking at the weekly chart, FIL appeared to be on a long-term downtrend with strong selling pressure. Not only because the price was trading below the 200-day Exponential Moving Average (EMA), but also because the crypto lost the major support level around $2.50. This level has acted as a key support zone multiple times between 2019 and 2025.

Despite the sustained price decline, the level around $0.94, along with the nearby $0.77-zone, seemed to be acting as a local support area for the altcoin. In addition, FIL was forming a descending trendline as the price faced rejection at the trendline resistance.
A breakout above this trendline or a weekly candle close above $1.30 could potentially end the bearish trend and open the door for an upside move, with the price possibly reaching $2.50. However, as long as FIL remains below the trendline resistance, the broader outlook will favor the bears.
On the weekly chart, the Average Directional Index (ADX) had fallen to 12.15, indicating that FIL lacked strong directional momentum.
On the daily timeframe, FIL seemed to be trading within a narrow consolidation range following a prolonged downtrend. At the time of writing, the asset was finding support at the key $0.95-level after holding it since April 2026.

If FIL breaks below this support and closes a daily candle under $0.95, it could open the door for another decline of approximately 16% – Potentially pushing the price towards the $0.77-level.
However, if FIL continues to hold above the $0.95-support level, the short-term bearish outlook could be invalidated, and the price may rise toward the $1.20-level.
Meanwhile, FIL’s Average Directional Index (ADX) stood at 15.42 – Evidence of weak directional strength.


