Clues from Bitcoin liquidation heatmap: Why a move to $105k is likely
The liquidity at $102k and $105k were attractive targets for Bitcoin prices to move to in the coming days.

- Overleveraged positions in the futures market made it harder for a BTC breakout.
- The reset and liquidation cascades are necessary for a long-term healthy uptrend.
Bitcoin [BTC] struggled to break out past the $100k level even though it poked its head above the psychological level multiple times within the past week.
A BTC correction to $94.2k was seen on Monday, the 9th of December. What could be in store for Bitcoin traders next?
Liquidations reach $1.7 billion
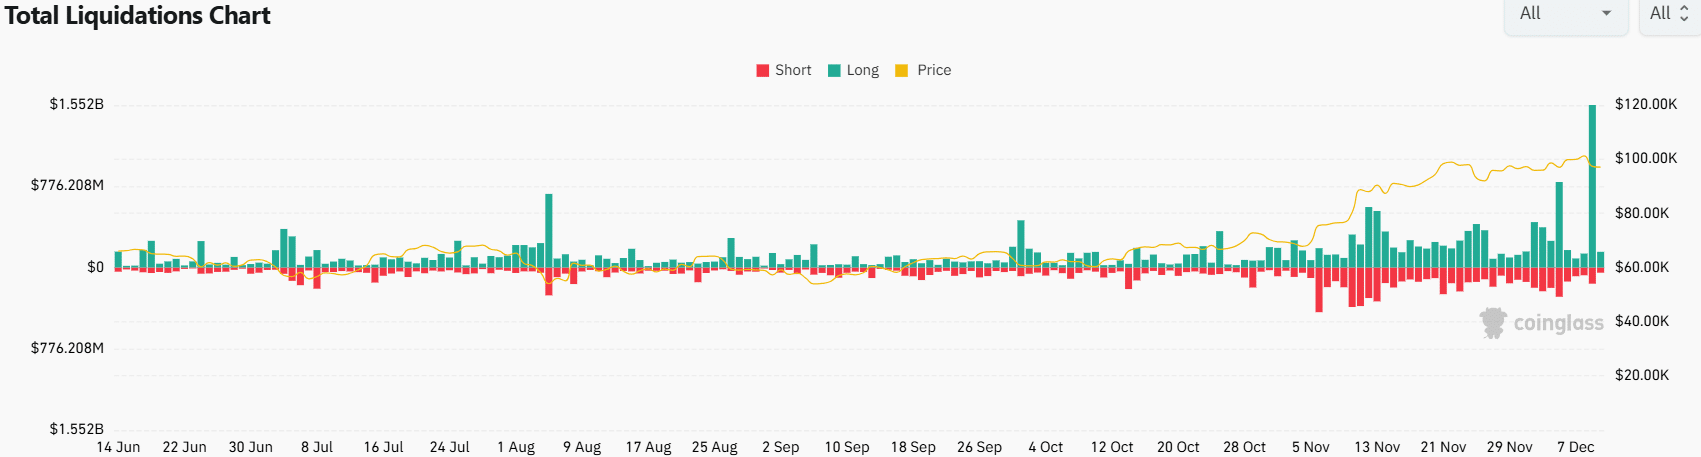
In a single day, the total liquidations reached a whopping $1.7 billion for just the Bitcoin pairs. This was likely the result of an intense tug of war in the futures market. Overleveraged longs and shorts clustered around the $100k mark were wiped out.
The 5th of December also saw heightened volatility as the price bounced between key liquidity pockets. On that day, close to $1.1 billion worth of positions were liquidated in the BTC market.
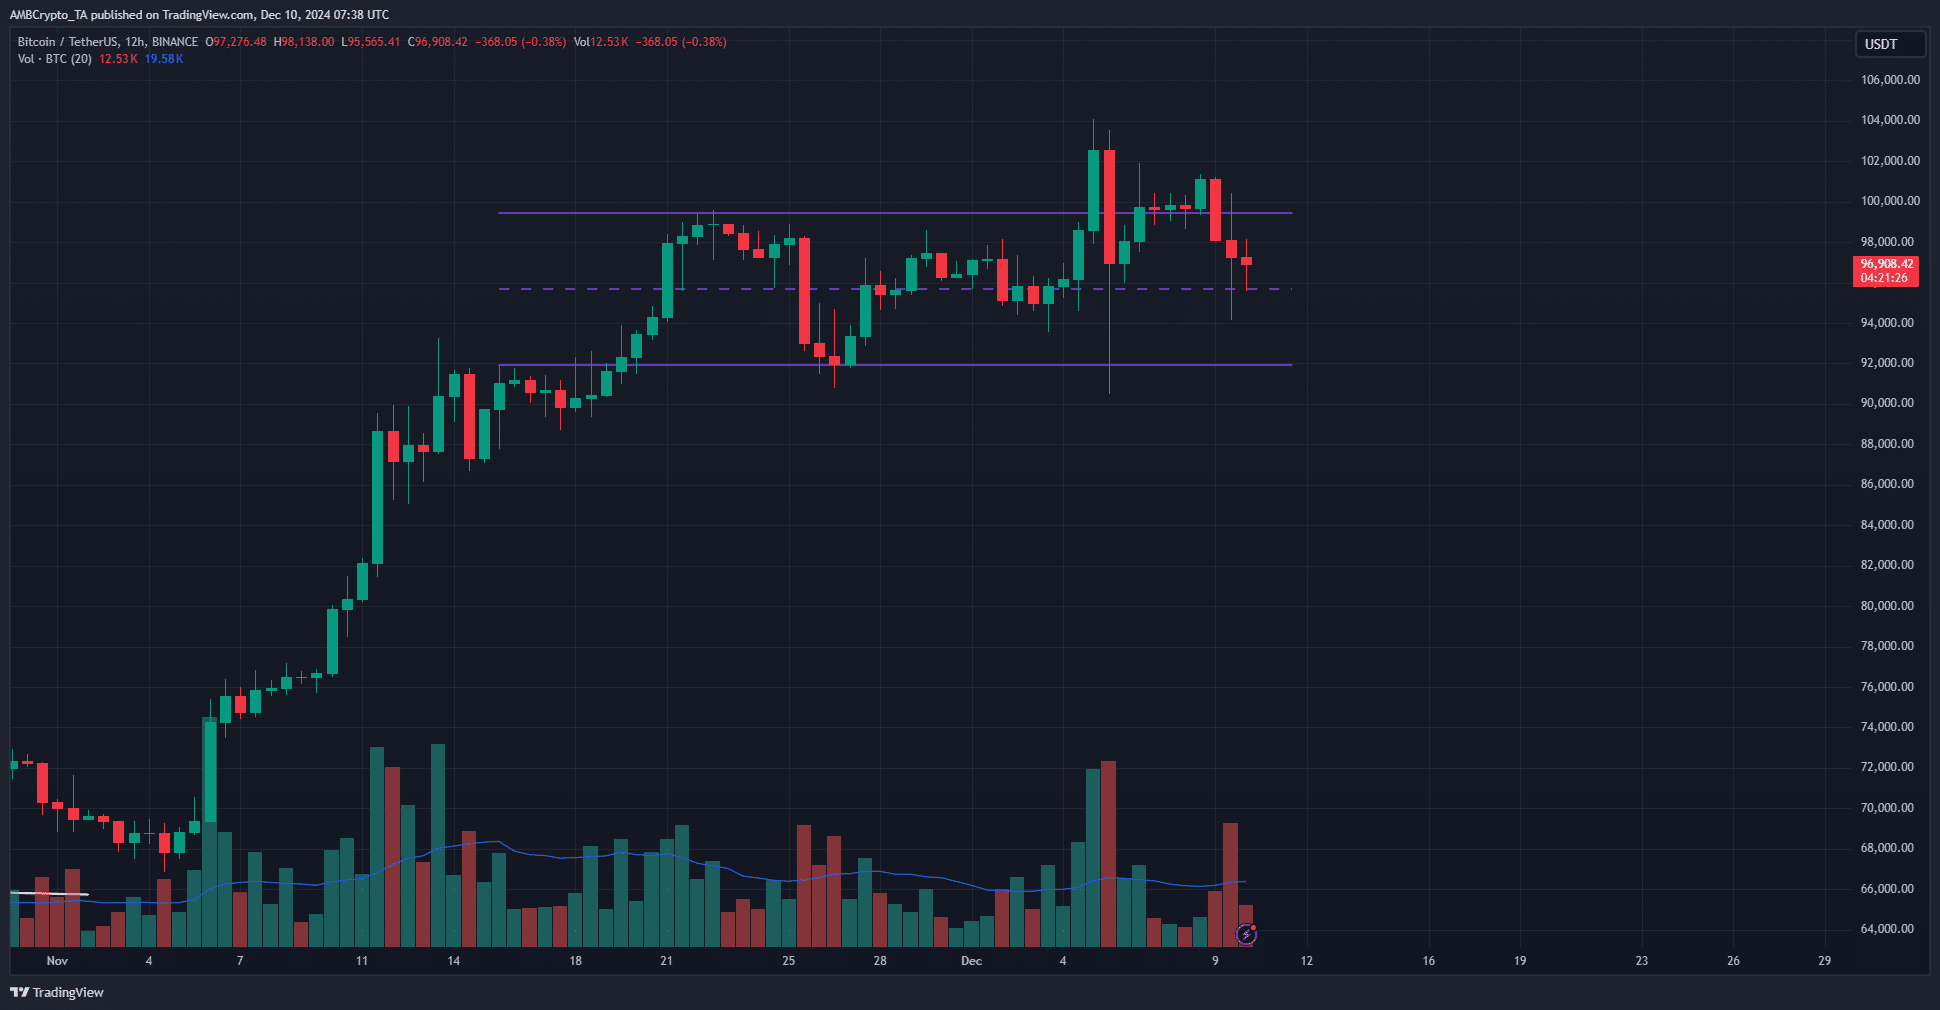
The 12-hour price chart showed that the king of crypto was back near the mid-range support level at $95.8k. It could fall lower to the $94k or even the $90k levels before the bulls can regain control.
Bitcoin liquidation heatmap shows higher is likelier
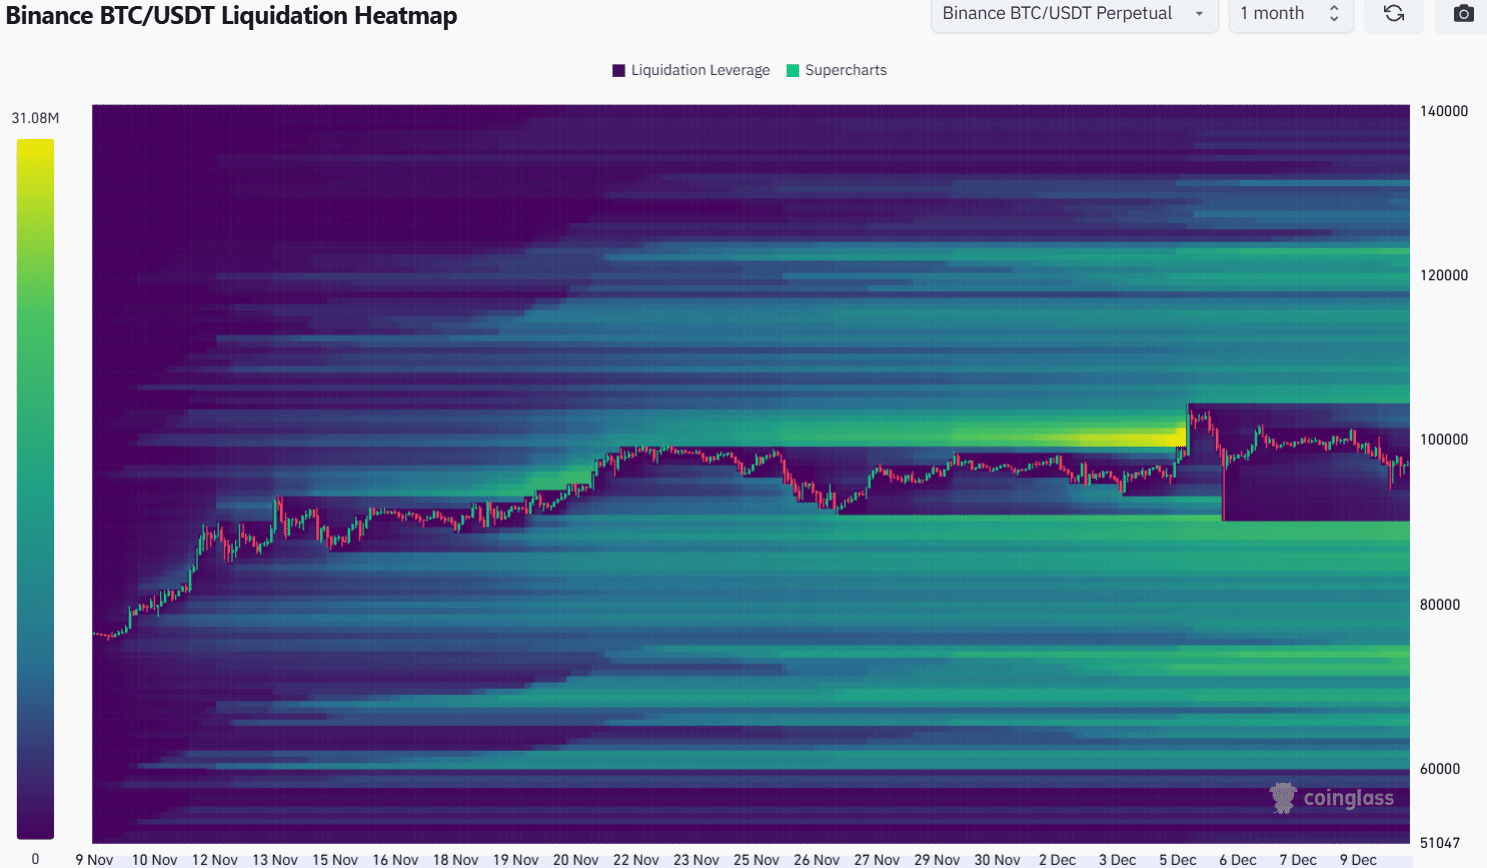
AMBCrypto’s analysis of the 1-month liquidation heatmap showed that high liquidity clusters have been efficiently built and wiped out over the past ten days.
In late November and early December, the tantalizing approach of the $100k mark set of a liquidity hunt that reached $104k.
Hours later, a retracement to the $90.5k support from the 26th of November swept another key liquidity zone.
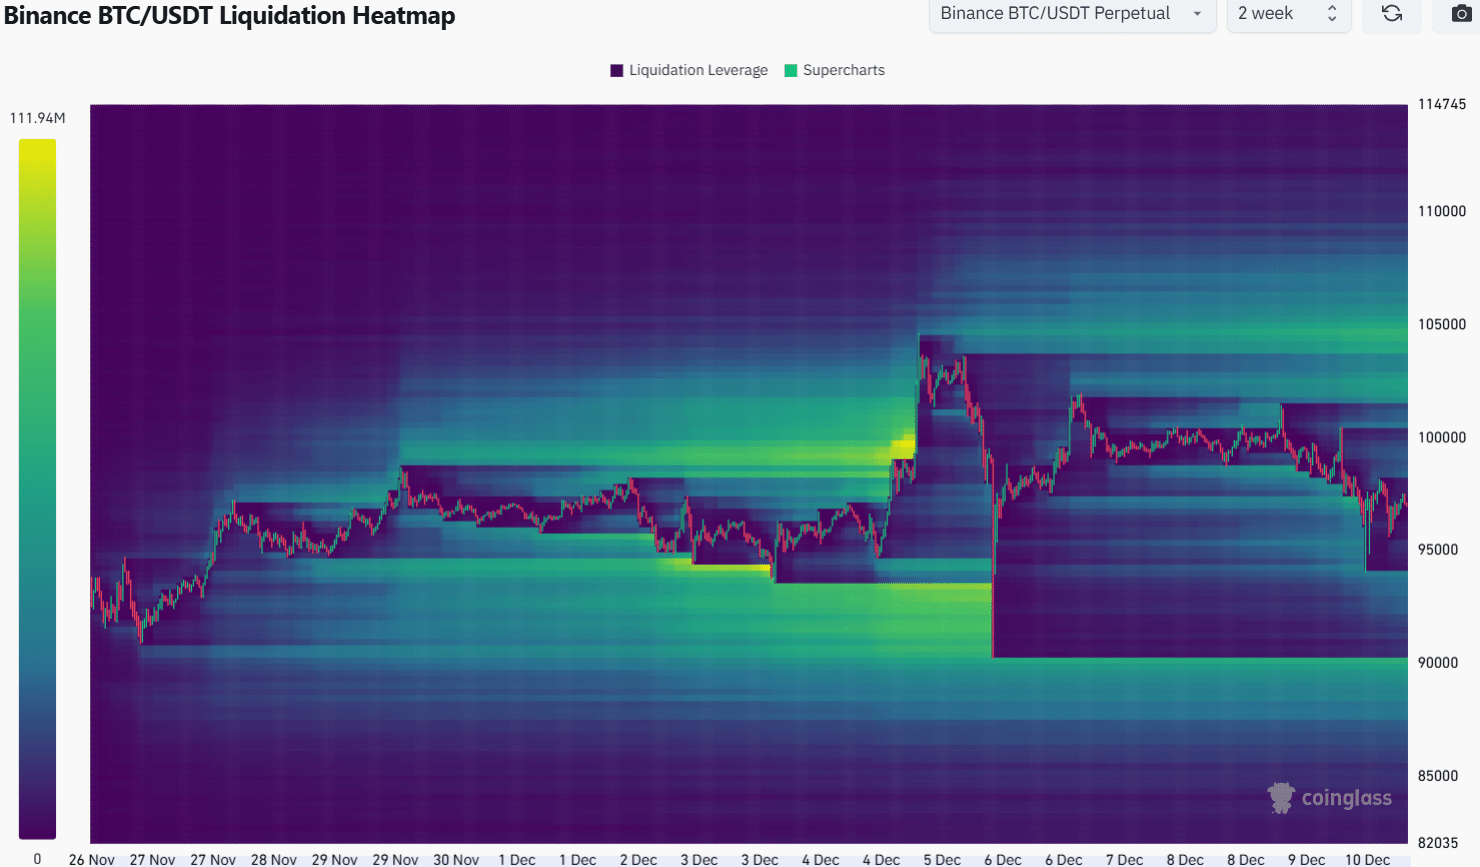
The 1-month lookback period showed that another retracement toward $90k or lower was possible. Zooming in on the 2-week heatmap, the liquidity building around $105k was stronger than what was present at the $90k mark.
Read Bitcoin’s [BTC] Price Prediction 2024-25
The liquidity at $102k was also an attractive target. Hence, a move northward to $102k and $105k was slightly more likely. Despite this view, traders should be prepared for a drop to $89k and manage their risk accordingly.
The break of the short-term support at $94k can foreshadow a deeper drop.
Disclaimer: The information presented does not constitute financial, investment, trading, or other types of advice and is solely the writer’s opinion


