Coinbase Premium flashes warning signs for Ethereum’s price – Explained
The $3.4k resistance zone needs to be reclaimed before swing traders can adopt a bullish bias.

- Drop in new addresses was indicative of the wider lack of ETH demand
- Price action and Coinbase Premium pointed towards firm selling pressure in recent weeks
Ethereum [ETH] has shed 12.44% of its value in the last 30 days, compared to Bitcoin’s [BTC] losses of 4.74% at press time. In fact, ETH has struggled to defend key support levels in the ;ast six weeks. Its affinity to the $3k level and thereabouts has given rise to many jokes made at the expense of ETH holders and bulls.
Despite the bearish sentiment, however, whale accumulation has continued. The $30 million withdrawal from Binance was not representative of market sentiment. In fact, the price action and other metrics gave more bearish than bullish signs.
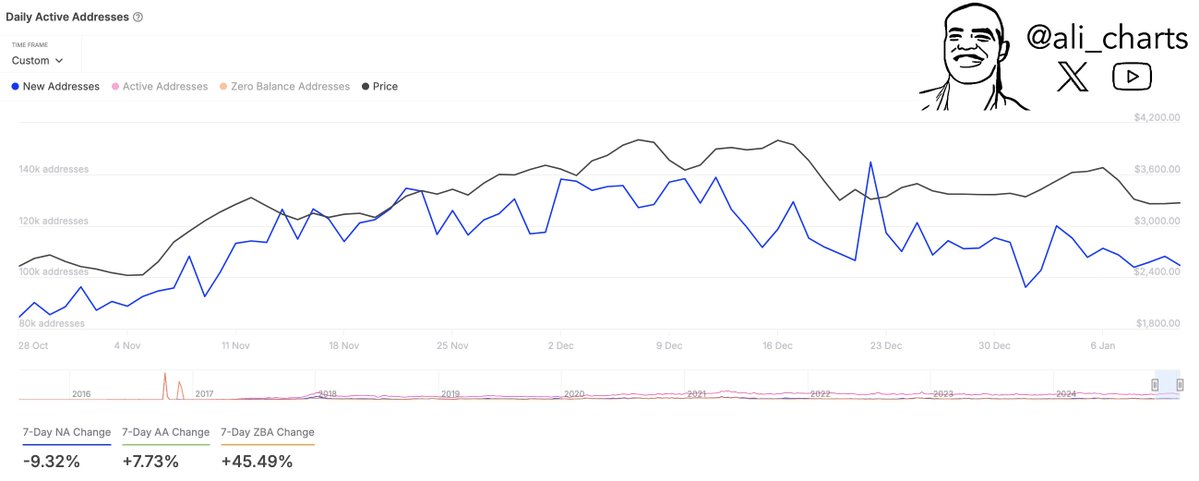
In a post on X (formerly Twitter) crypto analyst Ali Martinez noted that the network growth has been slowing down. The new addresses change over the past week (7-day NA) was -9.32%. This indicated reduced adoption and demand from newcomers to the chain.
On the other hand, the 7-day active address change saw a 7.7% positive swing. This alluded to fewer newcomers, but higher trading and network activity over the past week.
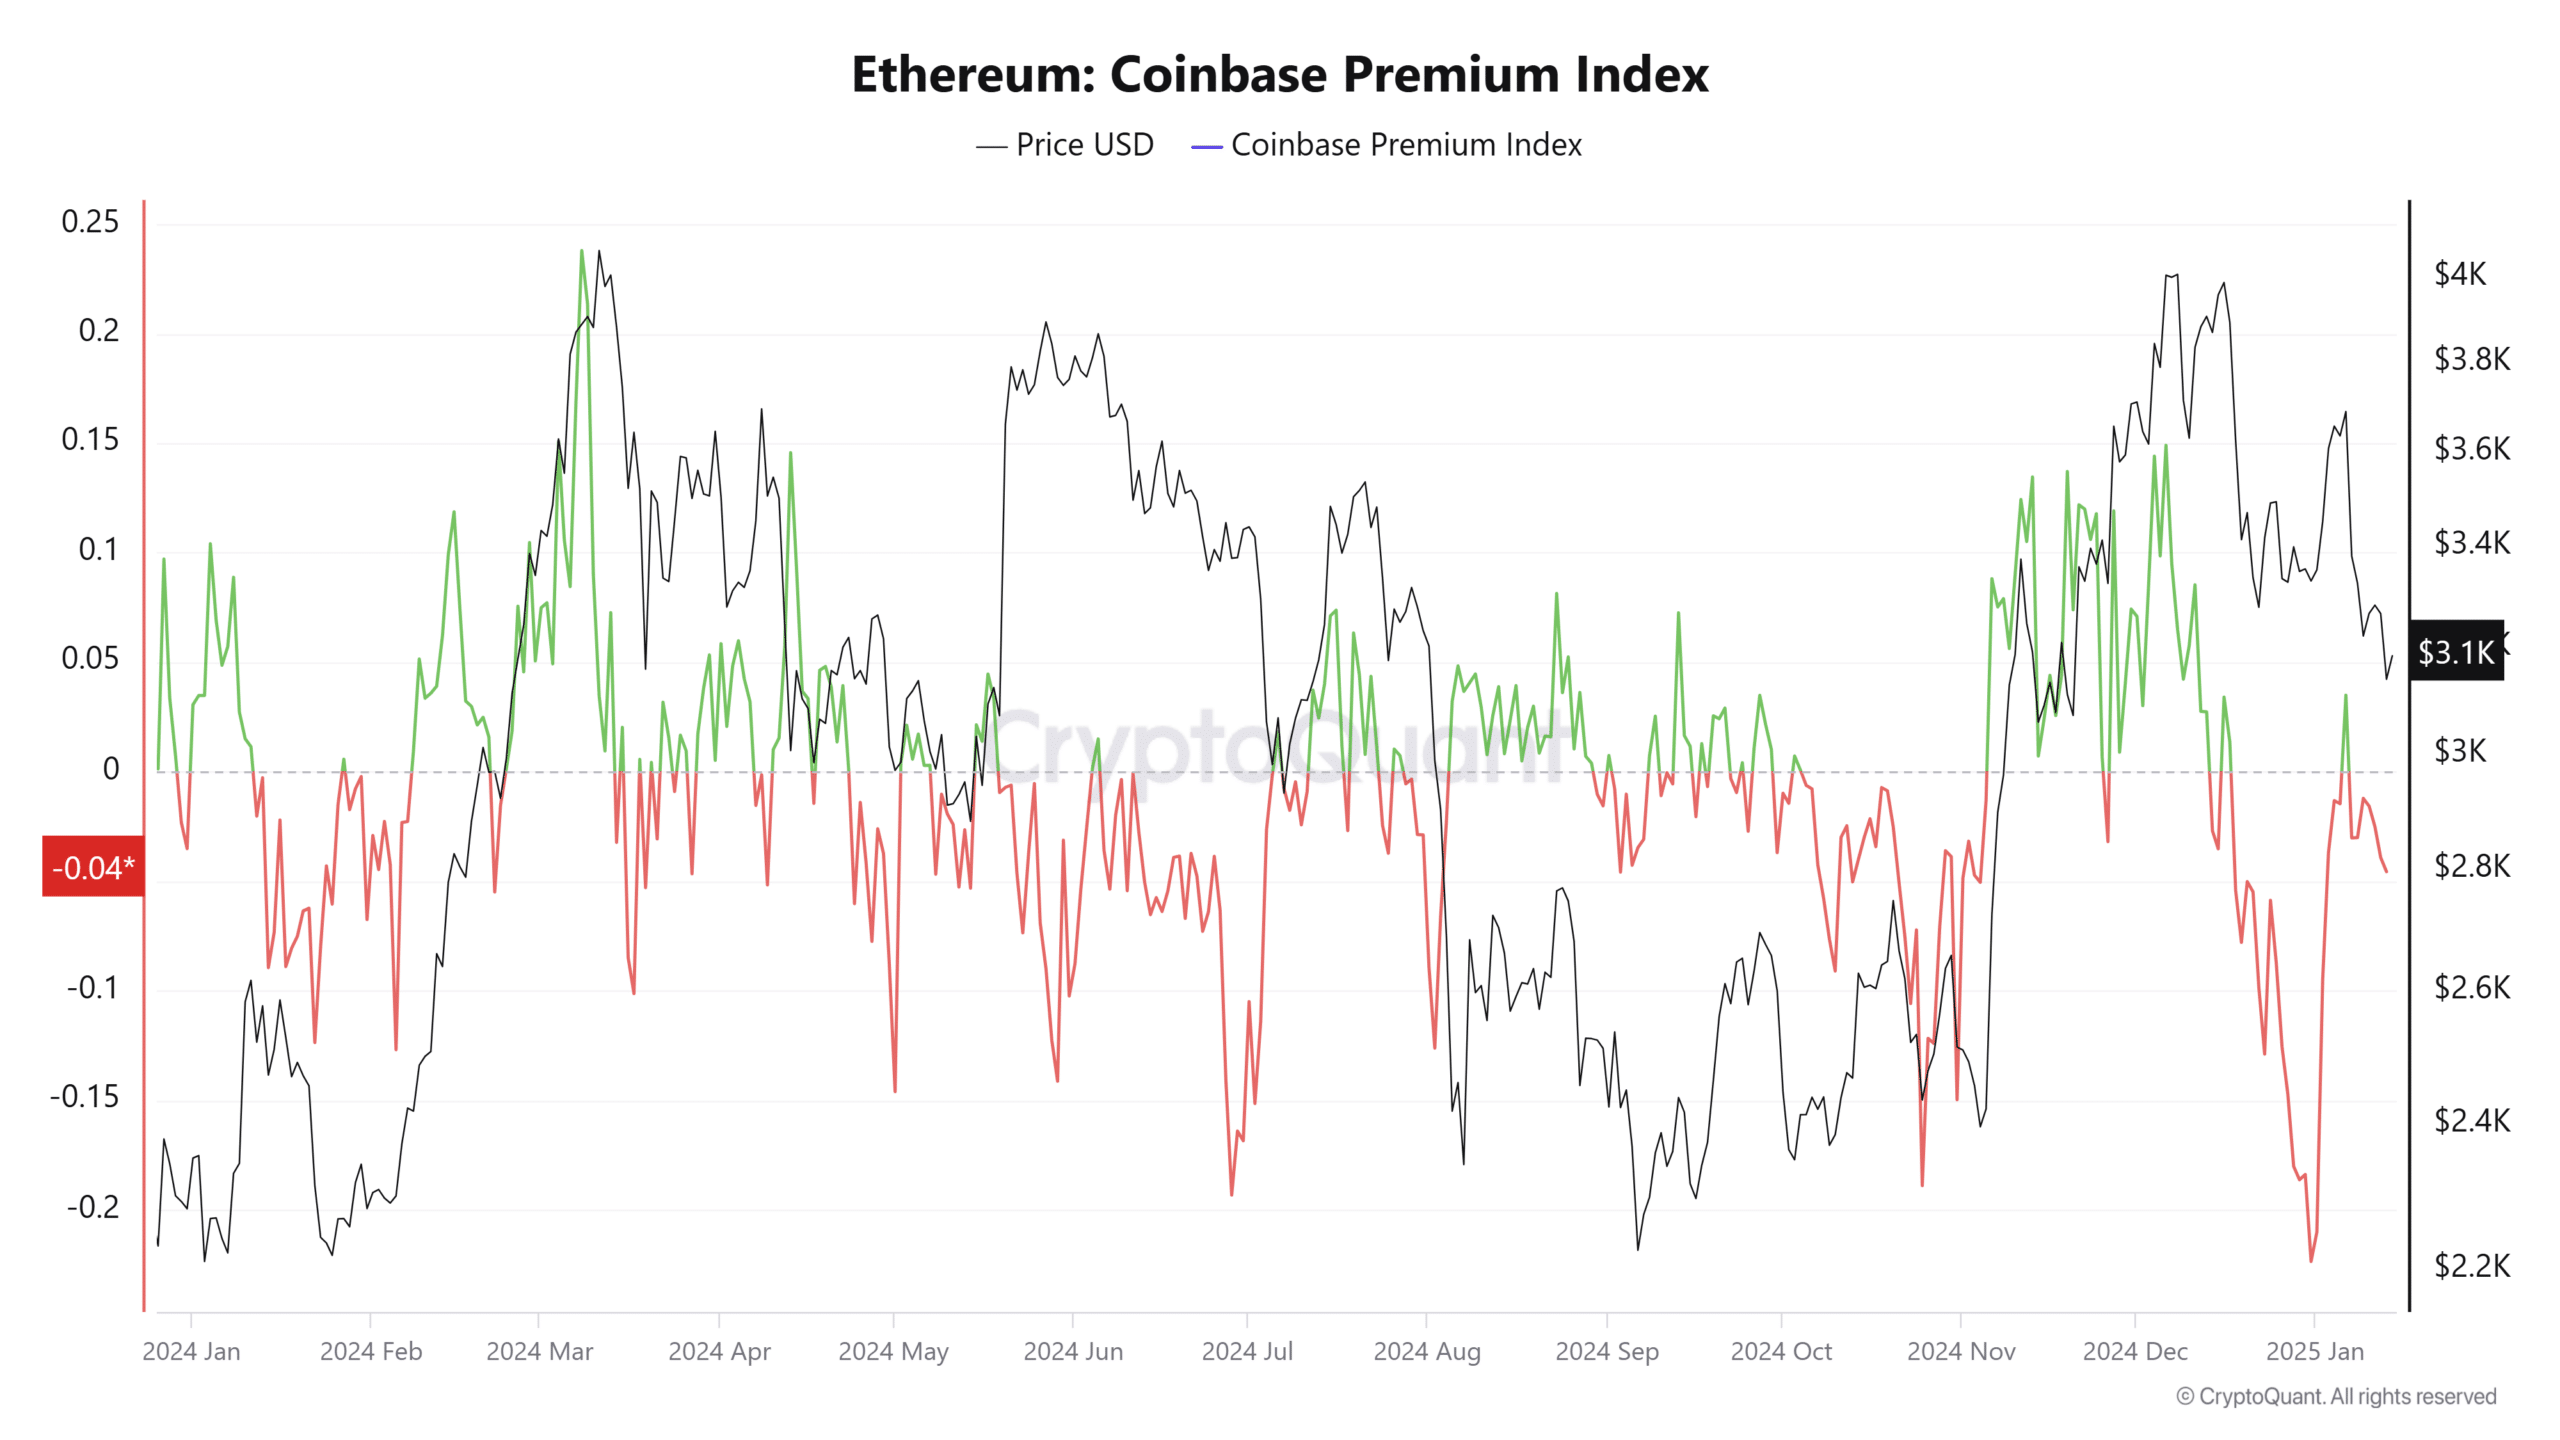
Looking back over a longer period, the Coinbase Premium has been in negative territory for a majority of the past month. This metric tracks the percentage difference between Ethereum prices on Coinbase and Binance, giving some insight into the behavior of U.S-based investors.
The negative premium on Coinbase implied greater selling pressure and weak buying from U.S-based participants. It also underlined the cautious approach to ETH from these traders.
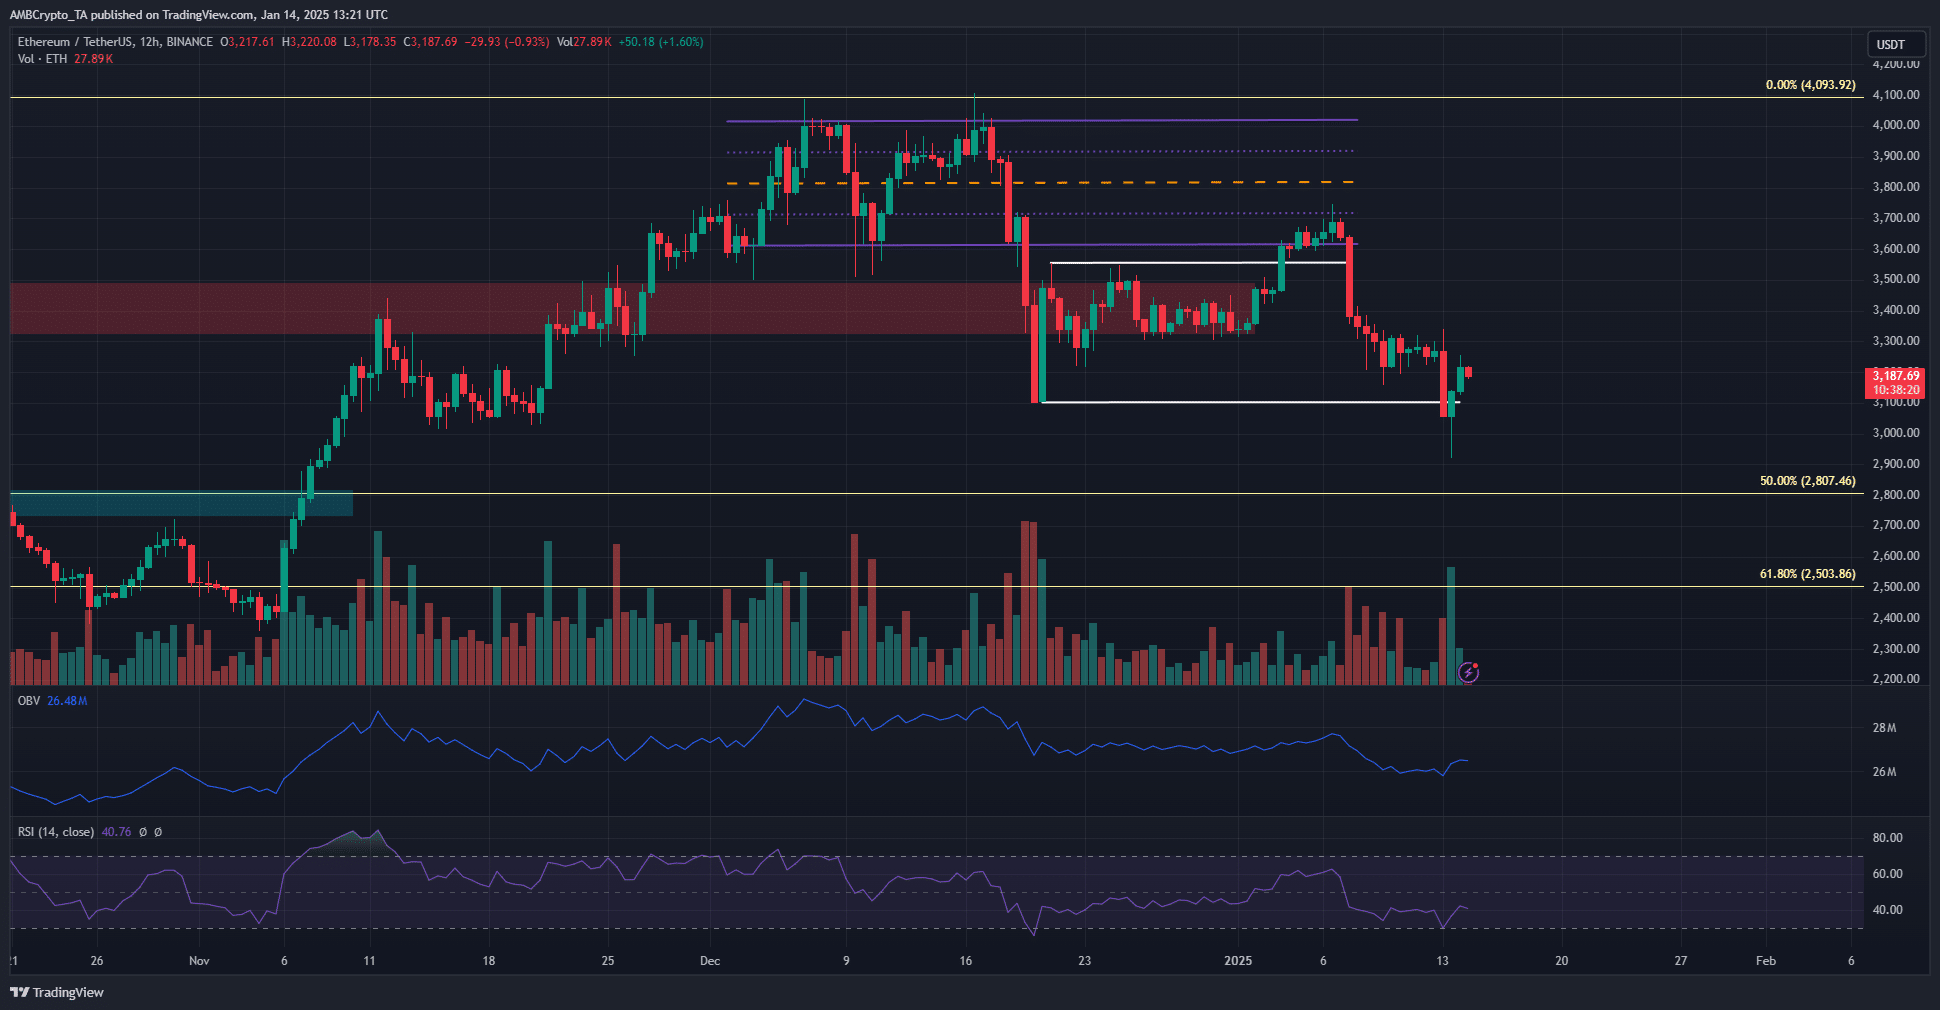
The price action over the past two months also highlighted caution and an eagerness to sell ETH. The range formation in the first half of December gave way as BTC crashed from $108k to $92k. While BTC was trading at $96.5k at press time, ETH formed lower lows and was valued just under $3.2k.
Is your portfolio green? Check the Ethereum Profit Calculator
Finally, the OBV highlighted the steady selling pressure since December by marking a series of lower highs. The RSI also noted the prevalent bearish momentum.
As things stand, the $3.4k resistance zone needs to be reclaimed before swing traders can adopt a bullish bias.


