Cosmos [ATOM] bounces from low-range support, what’s next?
ATOM ranged between key levels, as market uncertainty hampered its short-term prospects.
![Cosmos [ATOM] bounces from low-range support, what's next?](https://ambcrypto.com/wp-content/uploads/2023/05/AMBCrypto_ATOM_bearish_momentum_1200x900.png)
Disclaimer: The information presented does not constitute financial, investment, trading, or other types of advice and is solely the writer’s opinion.
- Market uncertainty confined ATOM to a compact range.
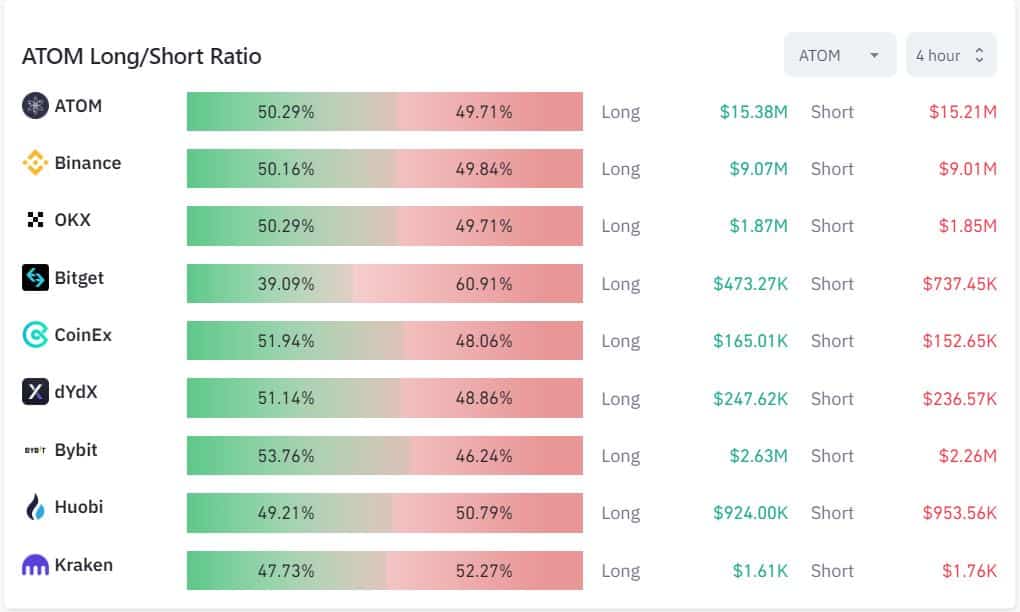
- Longs and shorts neutralized each other in the futures market.
ATOM retained its bearish leaning, despite a mild bullish bounce that saw the altcoin record 8% gains from 10 May to 15 May.
Bitcoin’s [BTC] descent beneath the $28k mark showed that the general market trend remained bearish and bounces were treated as momentary rather than a trend reversal.
However, ATOM ranged between key support and resistance level. Can traders expect any of these levels to be broken?
Read Cosmos [ATOM] Price Prediction 2023-24
Bulls and bears tussle for a range breakout
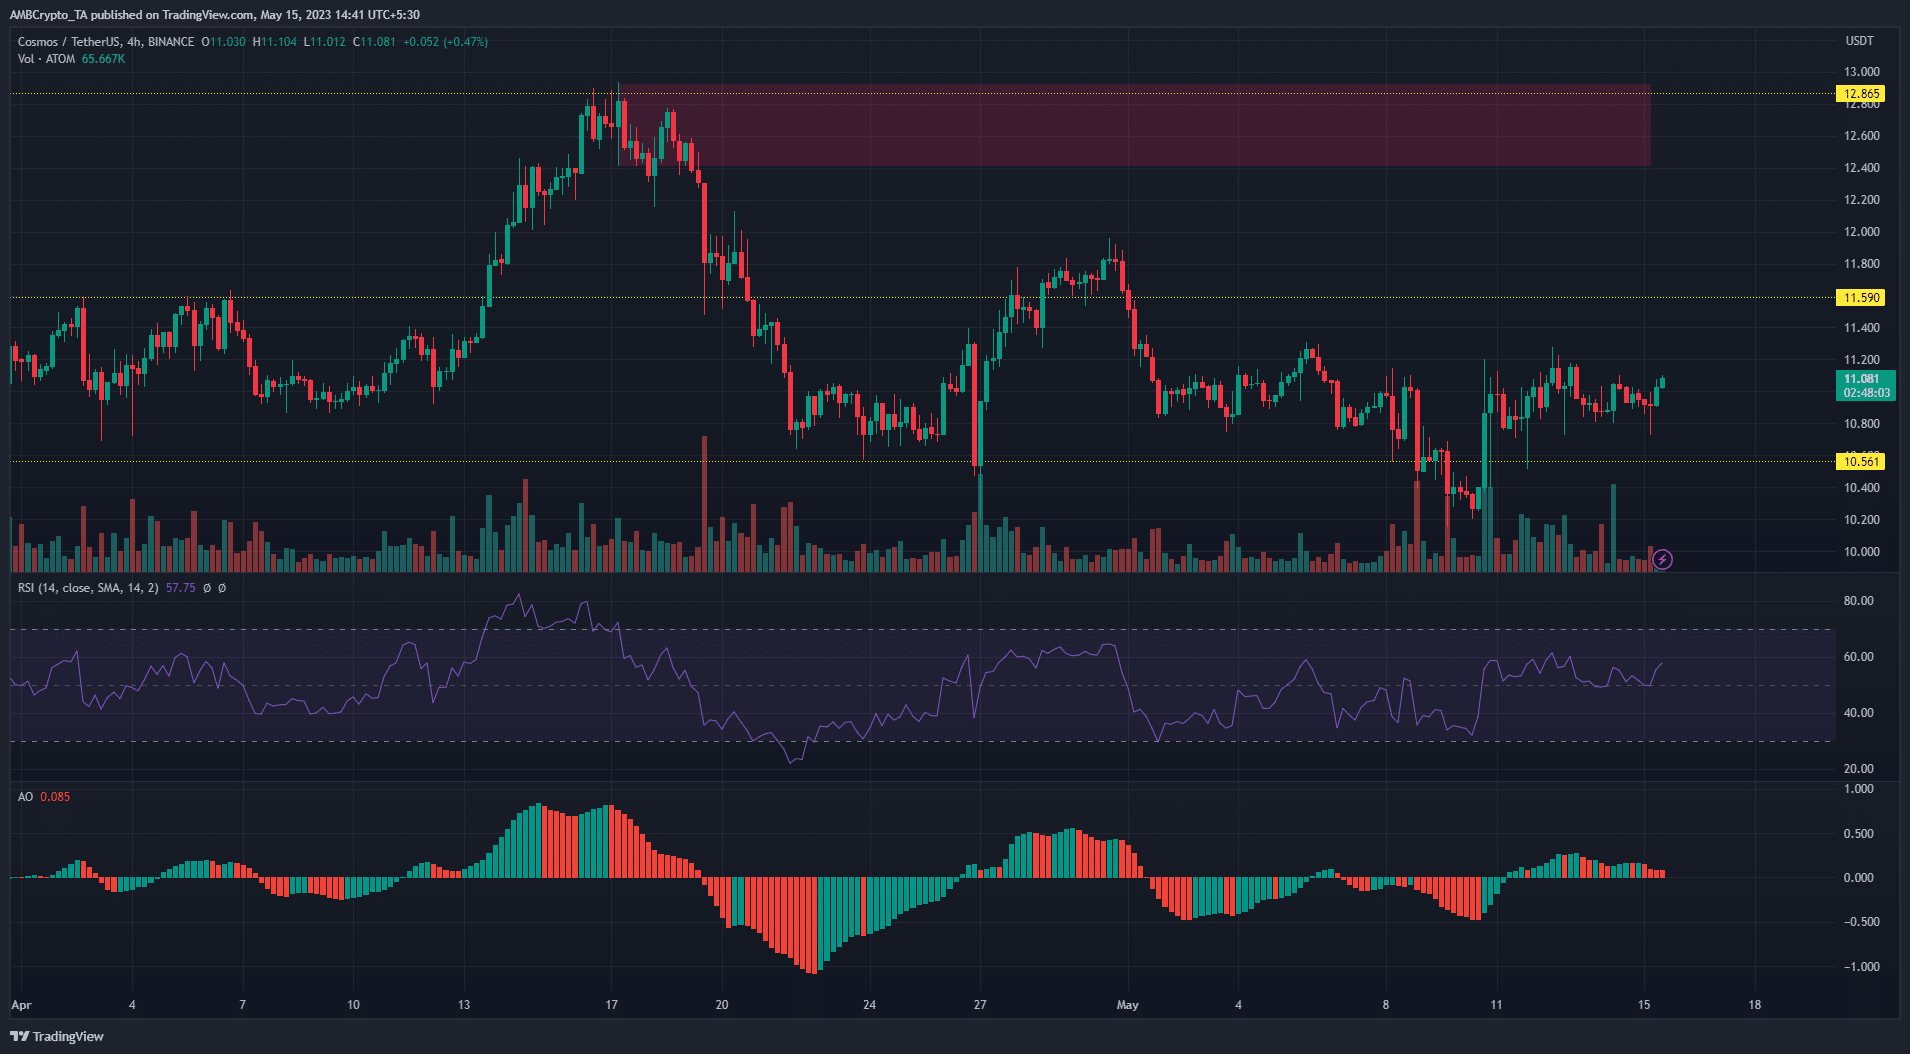
ATOM’s downward spiral from mid-April was cushioned at the key $10.5 support level. Afterward, prices traded within a compact range of $10.5 to $11.5.
Bears swiftly curtailed a bullish breakout above the $11.5 resistance on 29 April to bring the price back into the range. A similar attempt by bears to breach the $10.5 support on 9 May was quickly reversed by bulls to keep the price in the range.
Mixed signals from the on-chart indicators did little to give any confirmation. The Awesome Oscillator (AO) stayed above the zero line.
However, it flashed a mix of green and red bars. The Relative Strength Indicator (RSI) also hovered just above the neutral 50 and it stood at 58, as of press time. This suggested that buyers might just be edging ahead of sellers.
A significant pointer for ATOM’s next move will be what happens when the price approaches the resistance ($11.5) or support ($10.5). A retest of the $10.5 support level could see bears achieve their aim of pushing prices lower.
Conversely, a significant rally by bulls could take them above the $11.5 resistance level.
Neutral position for longs and shorts amidst fluctuating funding rates.
Is your portfolio green? Check ATOM Profit Calculator
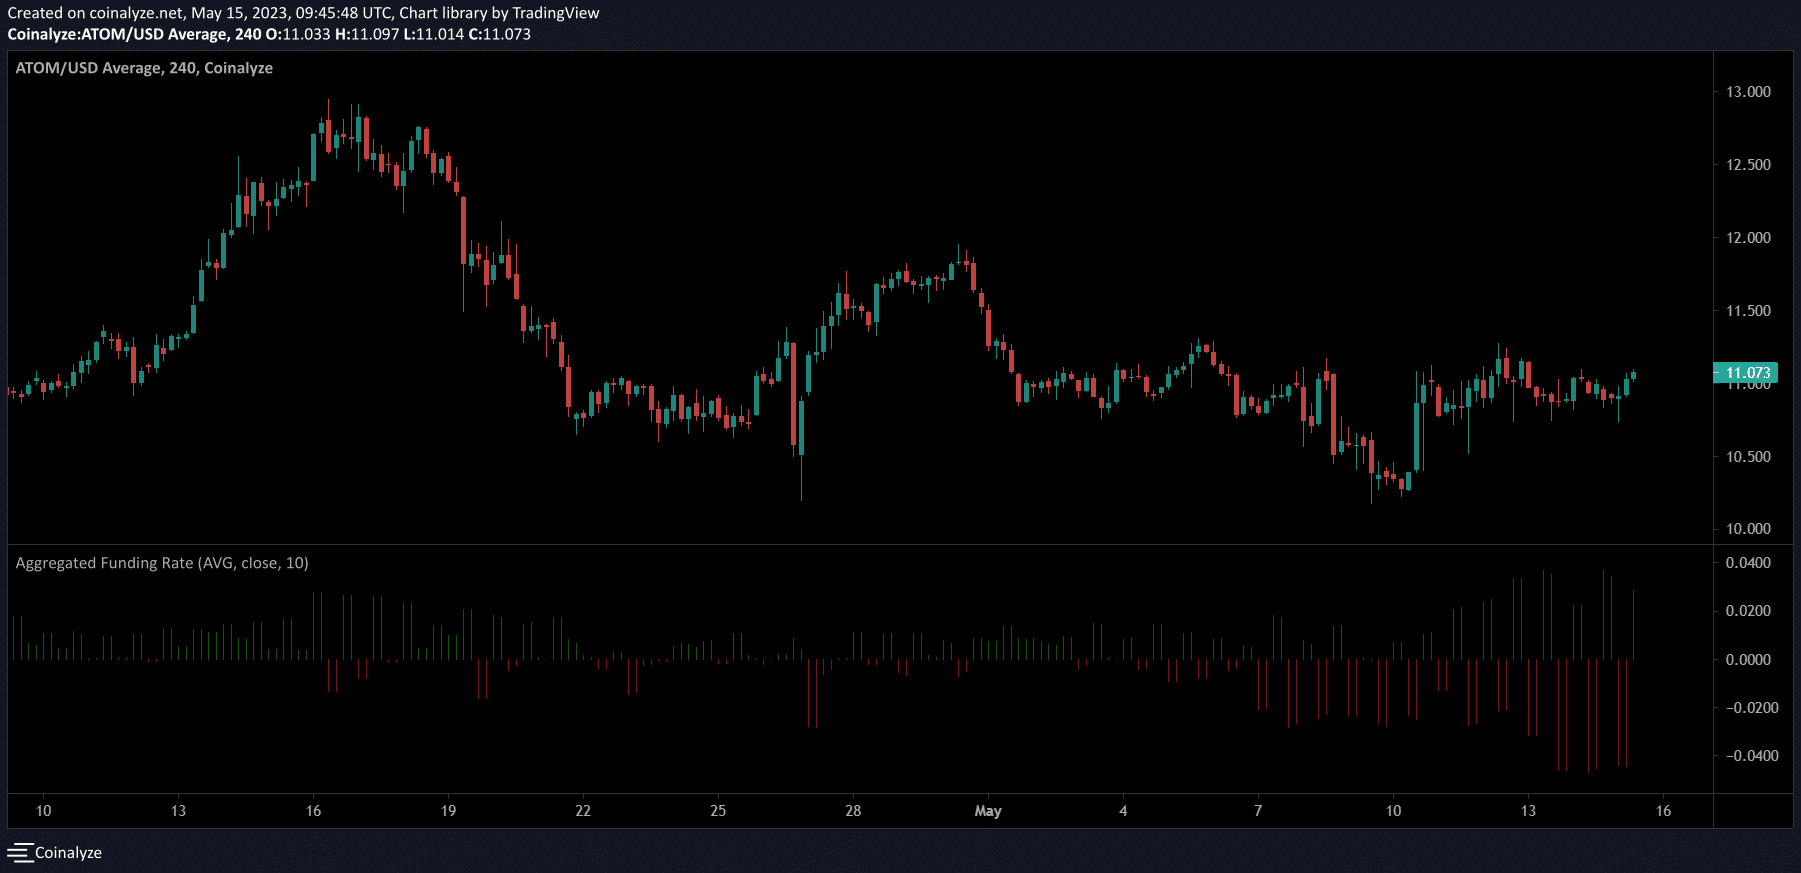
The four-hour chart from Coinalyze showed that funding rates fluctuated between positive and negative, since 26 April. ATOM’s fluctuating funding rates hinted at wavering demand in the futures markets. This could give bears an advantage.
In addition, the exchange long/short ratio showed that buyers and sellers canceled each other out. This portrayed the uncertainty regarding ATOM’s short-term moves.