Cosmos [ATOM]: End of the long-term bearish bias is…
ATOM's bearish momentum stalled at key support level. However, this could be an opportunity for the bulls to rally, but traders may need to maintain caution.

Disclaimer: The information presented does not constitute financial, investment, trading, or other types of advice and is solely the writer’s opinion.
- ATOM’s bearish momentum had the bears with the upper hand at the time of writing
- However, ATOM could see a reversal as more traders held longer positions
ATOM’s bearish momentum from mid-March has seen the altcoin’s price drop by over 20%. Despite a bullish rally in mid-April, the intense selling pressure has seen ATOM crash to $10.51, as of press time.
Read Cosmos’ [ATOM] Price Prediction 2023-24
While Bitcoin [BTC] and the general crypto market experienced mild gains in the past few days, ATOM’s price has remained around this key support level. What can traders expect next?
Bearish momentum stalls at key support level
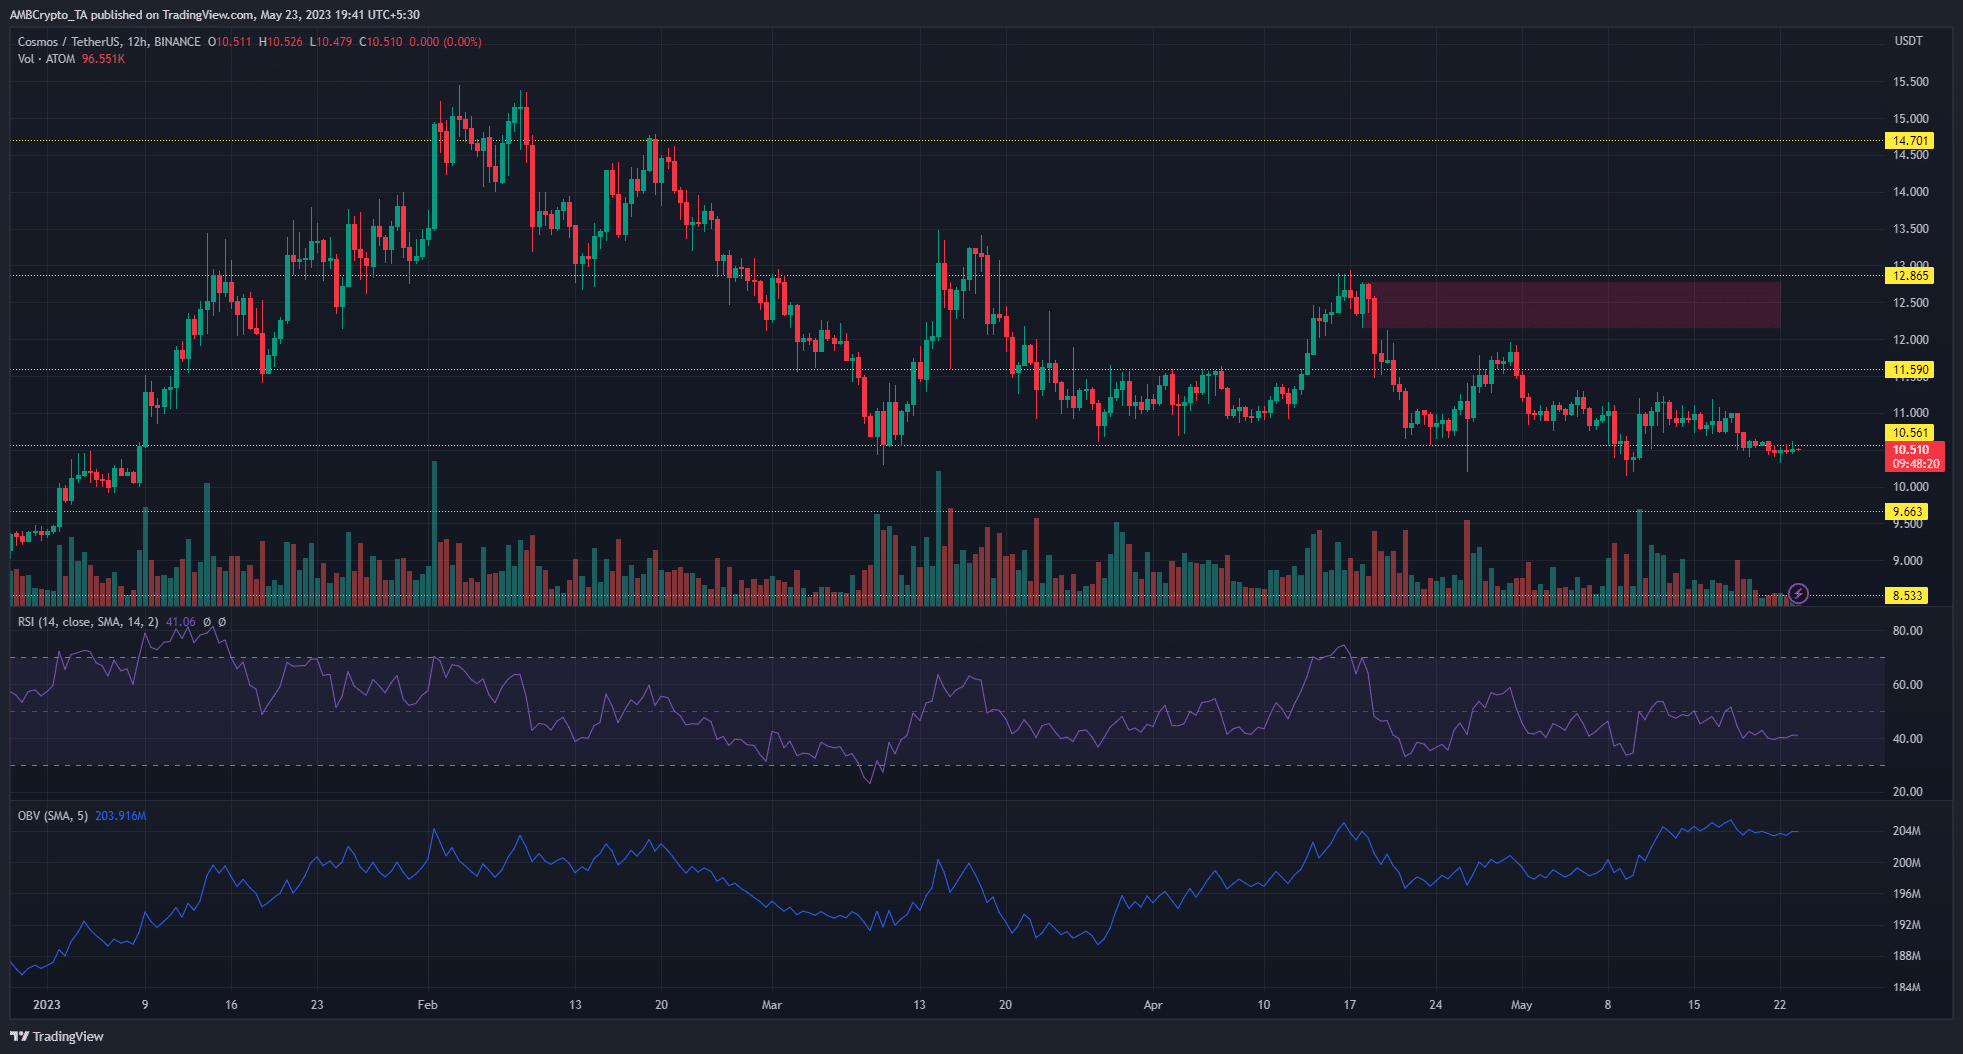
Bears have retained the upper hand in dictating ATOM’s price movement over the past three months. However, ATOM’s recent price action showed that bears have found the $10.56 price zone very tough to crack. This price zone heralded ATOM’s price rally in January, reiterating the strength of buyers at this support level.
Generally, the retests of a support level after the first test are weaker, but bulls have refused to give up their hold of the $10.56 support level. Price has hovered above and under this support level for the past seven days to hint at waning selling pressure.
While bulls haven’t been able to trigger a sustained reversal from this level, on-chart indicators hinted at its potential. The On Balance Volume (OBV) indicator maintained a slight uptrend which suggested demand was present for ATOM. Although the Relative Strength Indicator (RSI) dipped under the neutral 50, it stood at 42 to also hint at a possible reversal.
The 12-hour chart showed that a significant bullish candle close above the $10.56 support level could rally ATOM toward the key resistance at $11.59. Alternatively, if bears successfully flip the $10.56 support level to resistance, ATOM’s price could reach the January low of $9.66.
How much are 1,10,100 ATOMs worth today?
Market sentiment slightly favored bulls
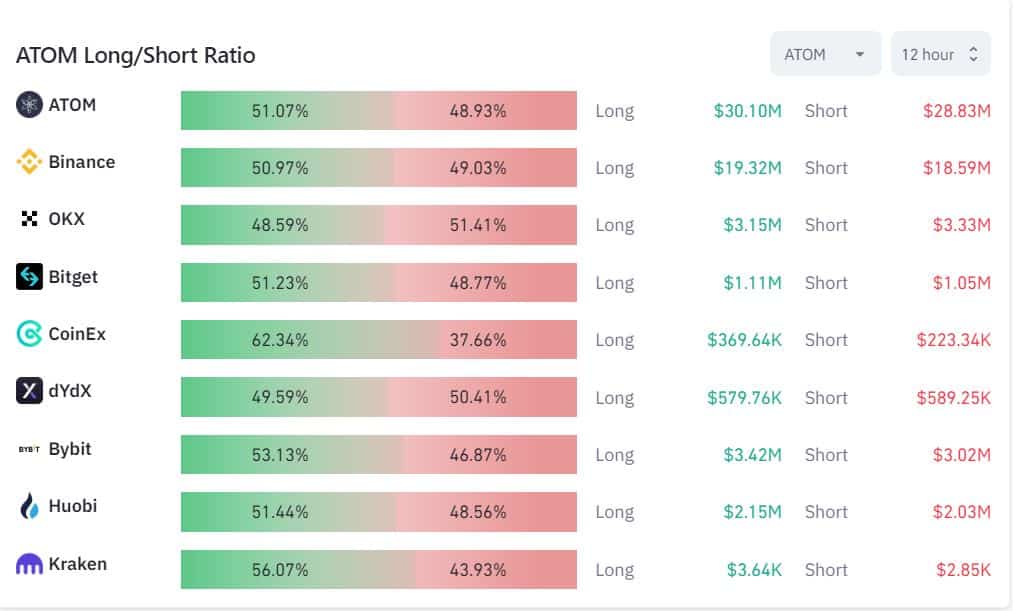
The long/short ratio on the 12-hour timeframe revealed that market sentiment leaned slightly in favor of a bullish rebound. Data from Coinglass showed that longs held a 51.07% advantage, as of press time.
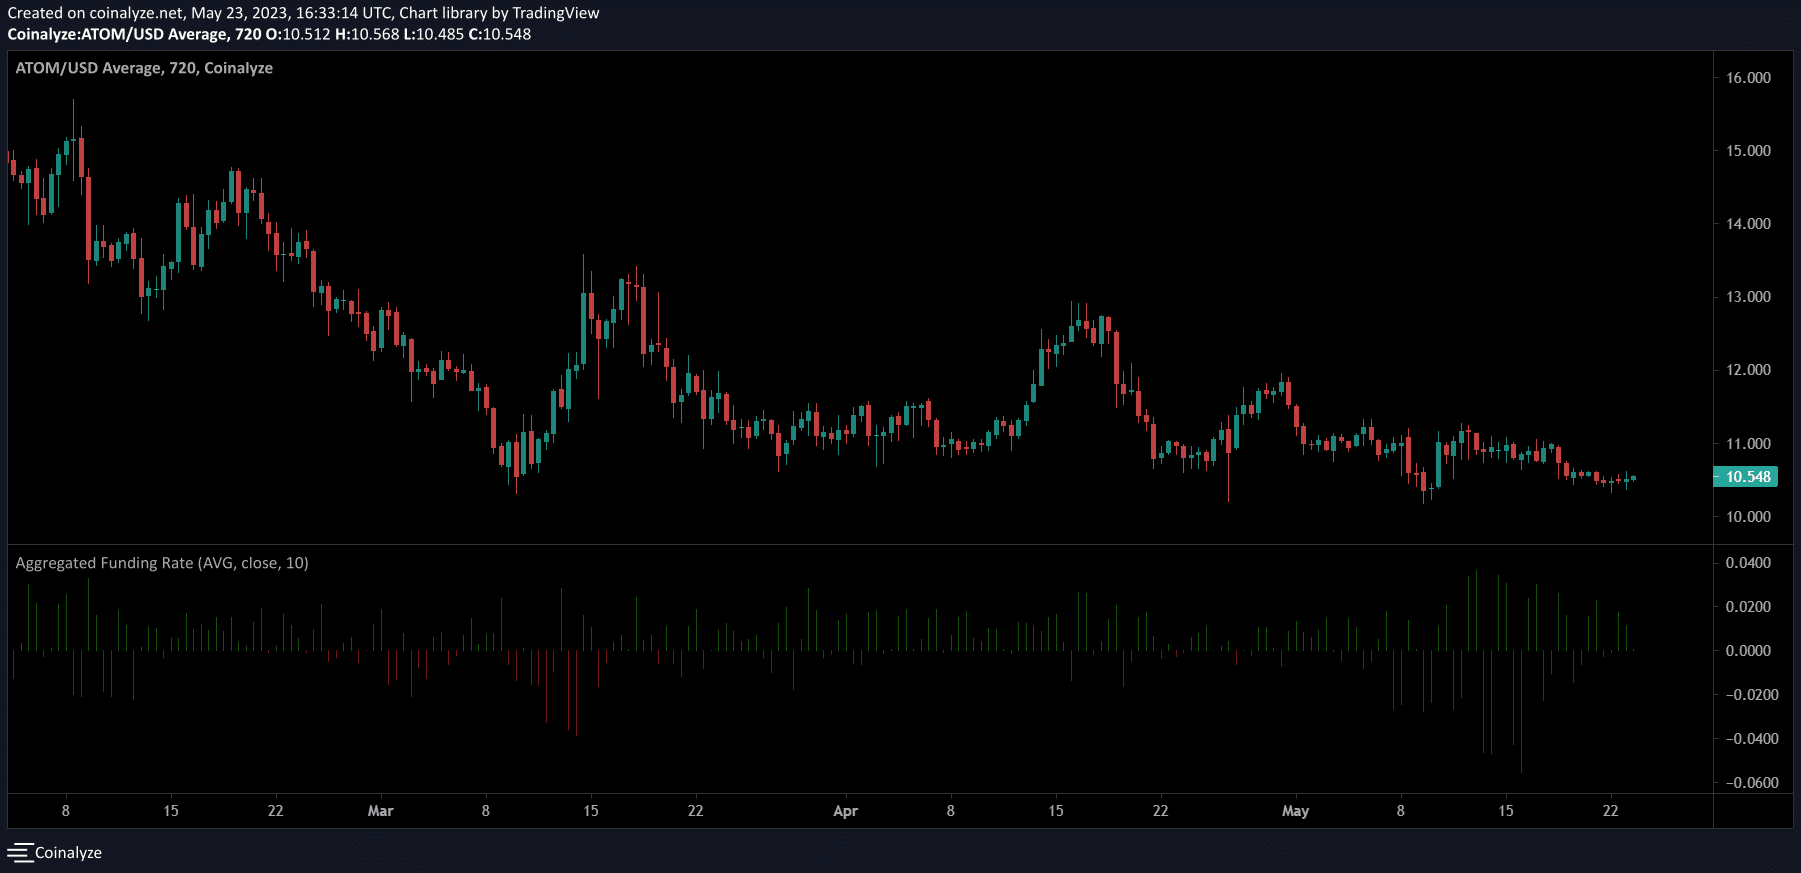
However, the fluctuating funding rate showed market speculators were adopting a watchful approach toward ATOM. Traders should exercise caution and watch for potential price movements at the key support level before entering new positions.