Cosmos collects liquidity and prepares for a move up, but only if ATOM…

Disclaimer: The findings of the following analysis are the sole opinions of the writer and should not be considered investment advice.
Cosmos’ funding rate was strongly negative, according to the 1-Day Funding Rate data on Coinglass. This meant that short positions paid the long positions periodically, and showed speculators were bearishly positioned over the previous day.
Indeed, a fall from $14.6 to $13.5 was seen, before a bounce to $14. A closer inspection of the price charts showed a bearish move over the past week.
ATOM- 12-Hour Chart
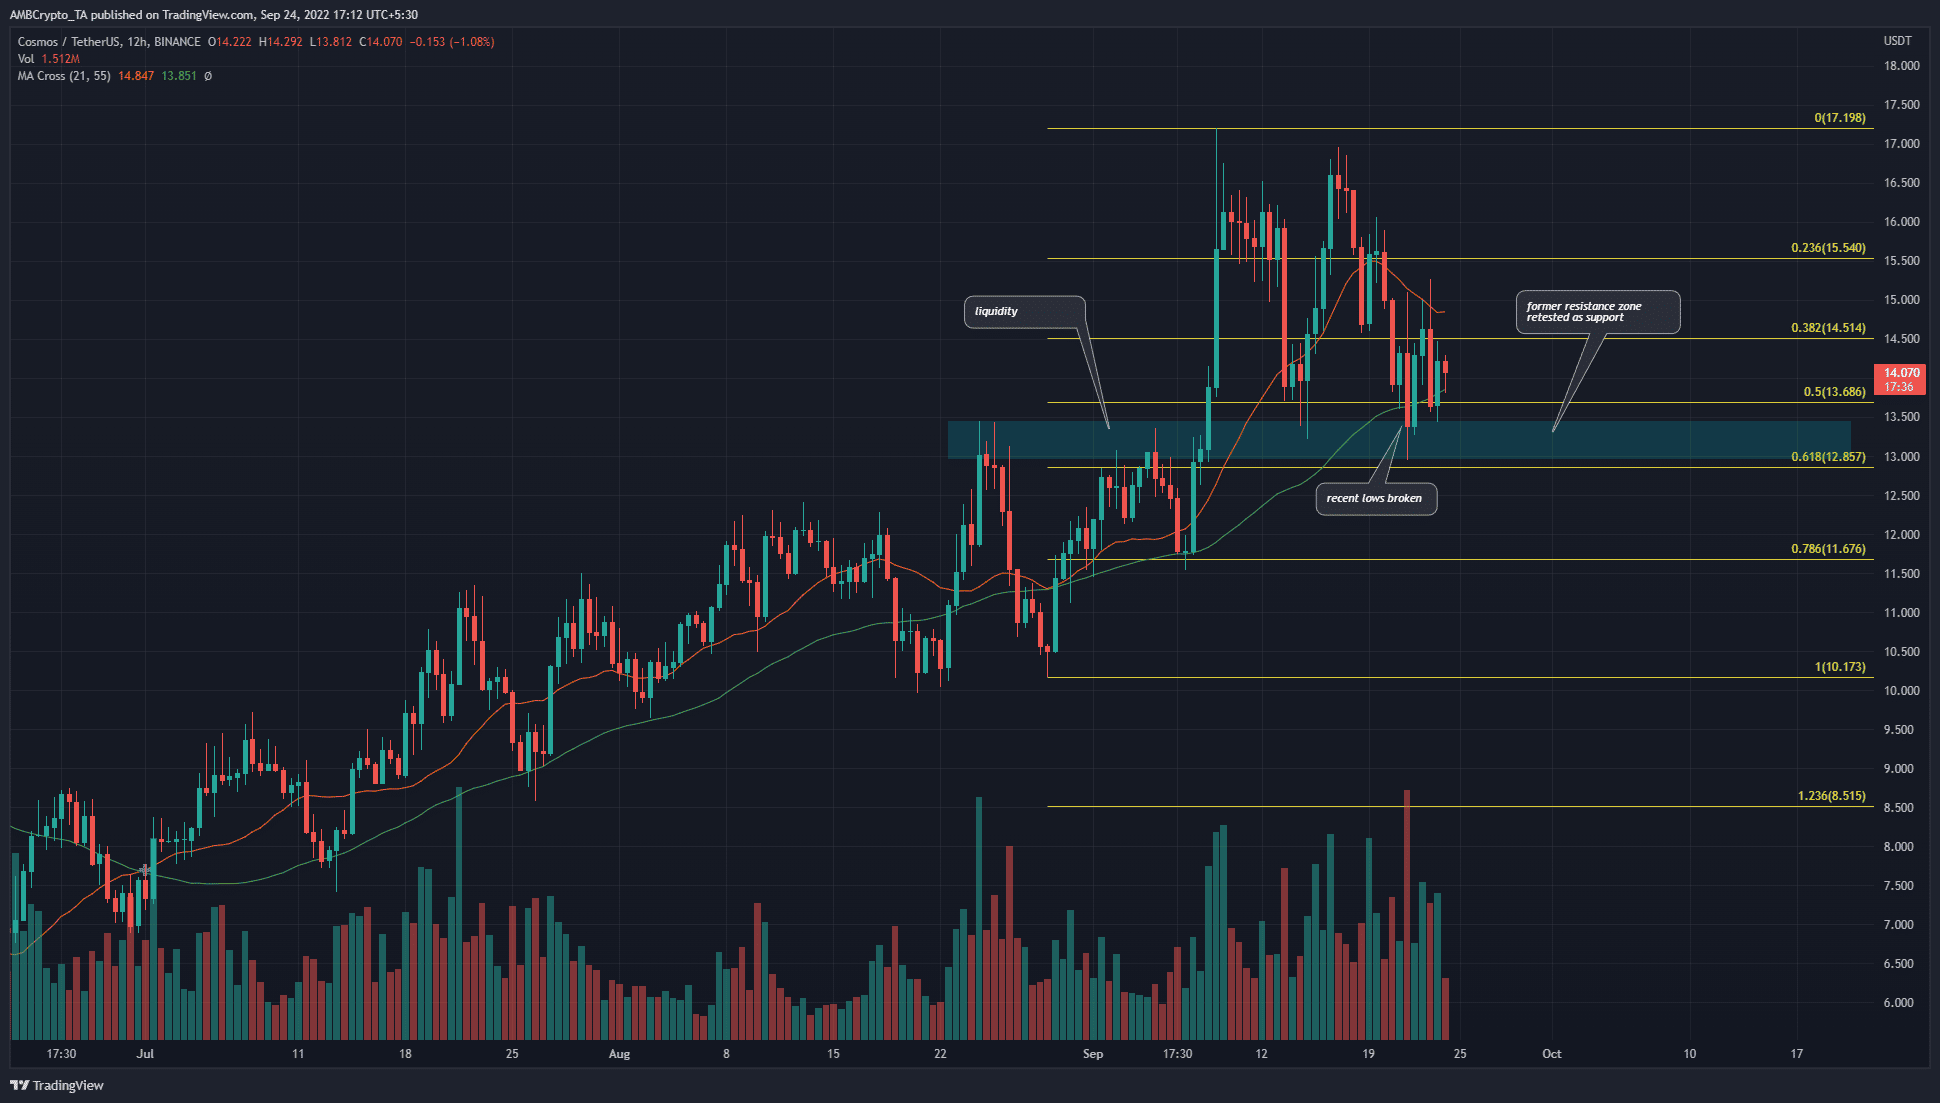
ATOM took a 20% hit from the $16.5 mark to reach a crucial zone of support at $13 over the past week. Highlighted in cyan, this zone of liquidity has been important since mid-August. It acted as resistance up to early September and was decisively broken.
The trading volume has also been sizeable in September. Over the next few days, a retest of the support zone could offer a buying opportunity. Yet, it must be remembered that Bitcoin has a bearish bias until the $19.6k mark can be broken.
The fact that the $13.87 low from mid-September was broken meant the market has a bearish bias on the higher timeframe. A daily session close below $12.85-$13 would suggest another plunge toward the $11.67 mark.
The Fibonacci retracement levels (yellow) showed the 61.8% level to lie at $12.85. This level had confluence with the support zone, further reinforcing its significance.
Rationale
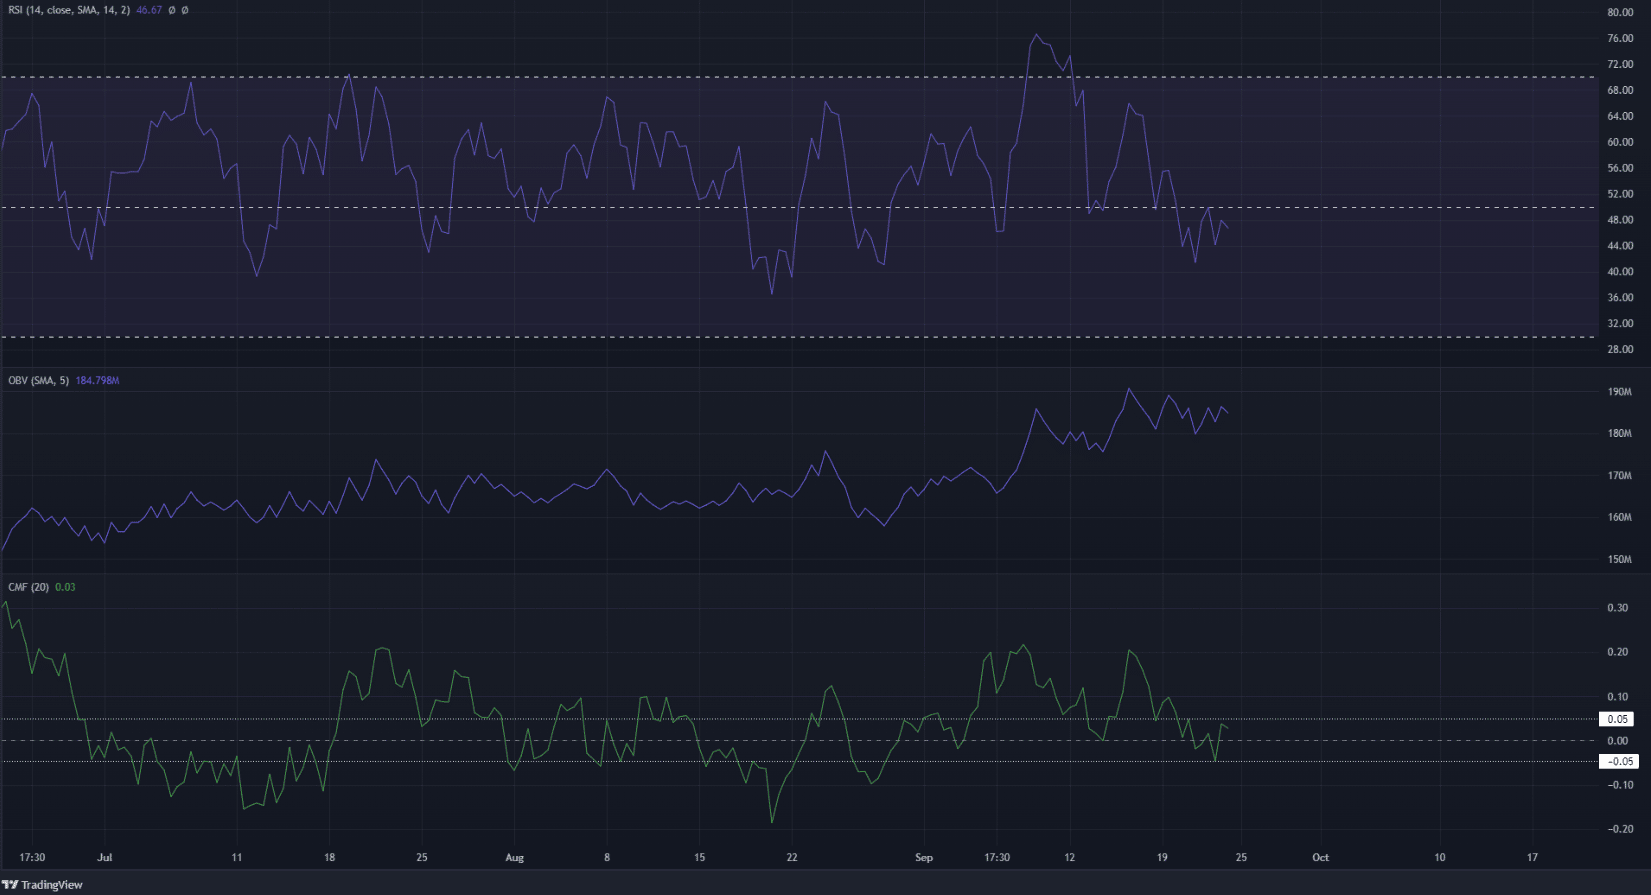
The Relative Strength Index (RSI) slipped below neutral 50 and hinted at a flip in momentum toward bearish. In contrast, the On-Balance Volume (OBV) was on an uptrend to show strong buying volume in recent weeks. The Chaikin Money Flow (CMF) also fell toward the neutral zone.
The inference from the indicators was a mixed bunch, with bearish momentum but without heavy selling volume.
Conclusion
The fall to the support zone at $13 meant traders and investors might have a buying opportunity on their hands. A daily session close below $12.85 would indicate ATOM was headed toward the $11.6 mark. A successful defense of the $13 region over the next week could start ATOM on a move back toward the $16.6 highs. Patience and low-risk positions could be the way to navigate the Cosmos charts.