Cosmos, EOS, Aave Price Analysis: 27 March

On shorter timeframes, a reversal in momentum toward bullish appeared to be in progress for coins such as Cosmos and Aave. There were still some important levels of resistance to overcome on the path to recovery. EOS climbed above $4 and faced a region of supply.
Cosmos [ATOM]

Source: ATOM/USD on TradingView
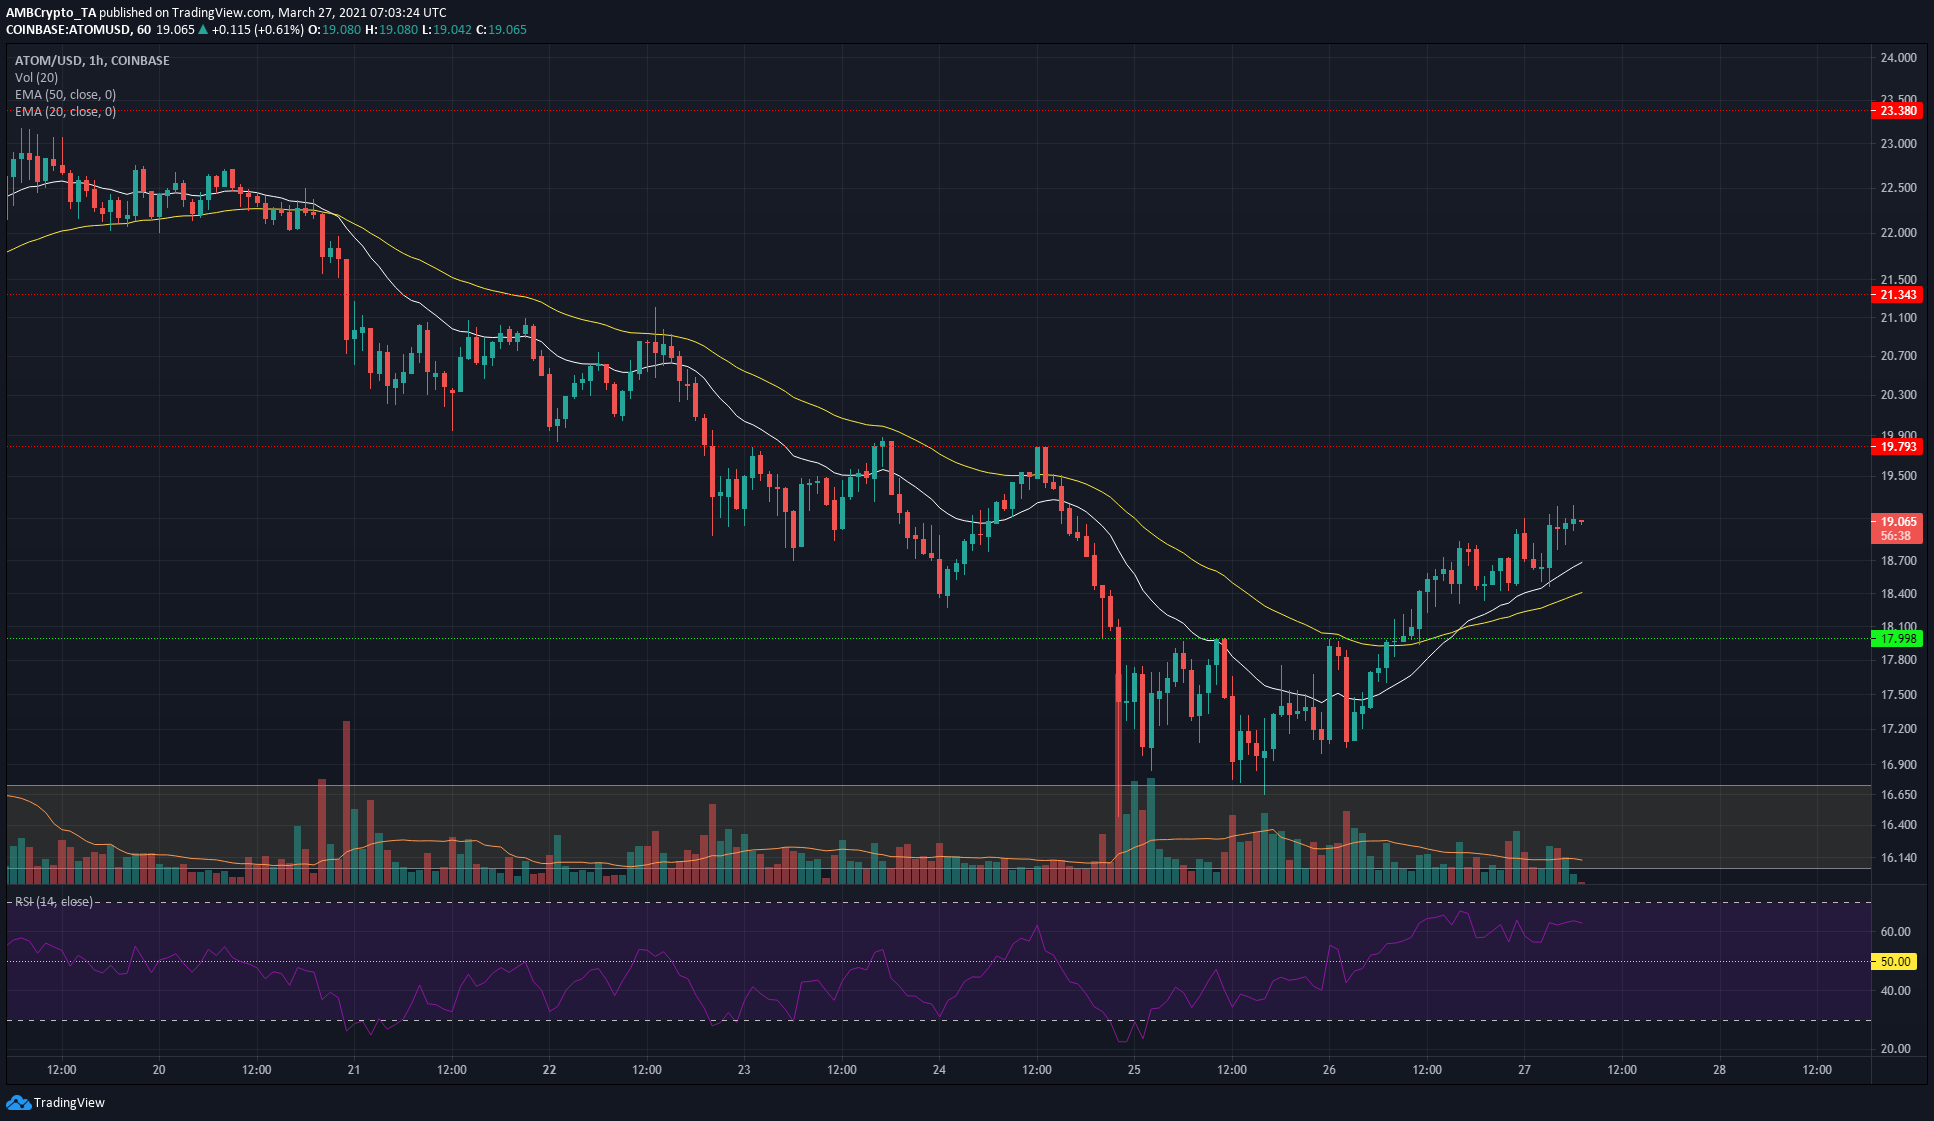
ATOM tested the region of demand at $16-$16.7 and bounced to flip the $18 level from resistance to support. 20 EMA (white) was moving above 50 EMA (yellow) to show short-term bullish momentum.
RSI climbed above neutral 50 and showed a value of 64 at the time of writing, reaffirming upward momentum behind ATOM.
The $19.8 and $21 are the next levels of resistance for ATOM bulls to overcome.
EOS

Source: EOS/USDT on TradingView
There were some signs of bullishness behind EOS, but it was too early to enter a long position.
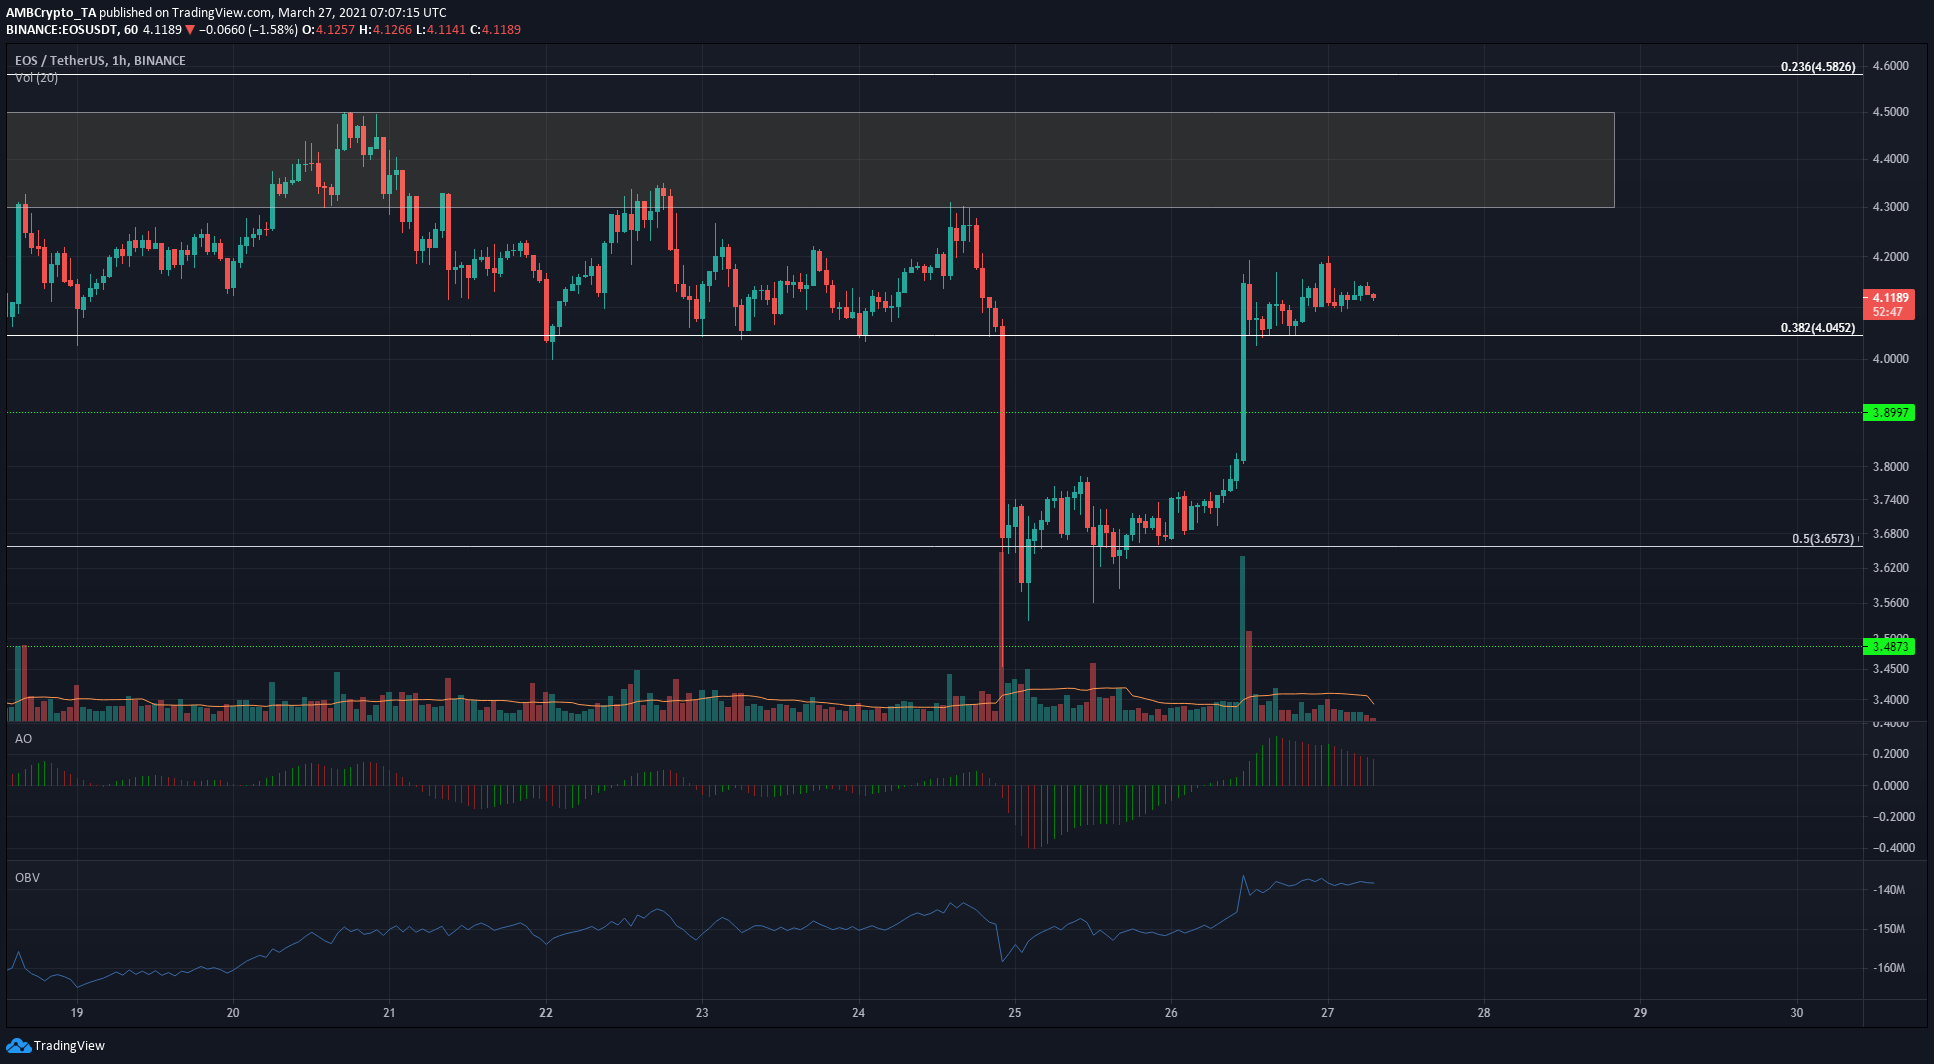
The region of supply at $4.3-$4.5 was immediately overhead for EOS, even as the price floated above the $4 retracement level which served as support. In the short-term, a retest of the $4.04 level can be used to enter a scalp long, targeting $4.3.
OBV has been trending upward in the past couple of days, and this buying pressure could see the supply zone tested. However, a tight stop-loss at $3.98 is recommended. Awesome Oscillator was receding and the waning short-term bullishness could see a minor dip back to $4.04.
In the longer-term outlook, 50% retracement level at $3.6 has been defended, based on a larger move of EOS from $2.38 to $5.6. This defense hinted at bullish resilience, which will be confirmed by flipping the supply region to one of demand in the coming days.
Aave [AAVE]

Source: AAVE/USDT on TradingView
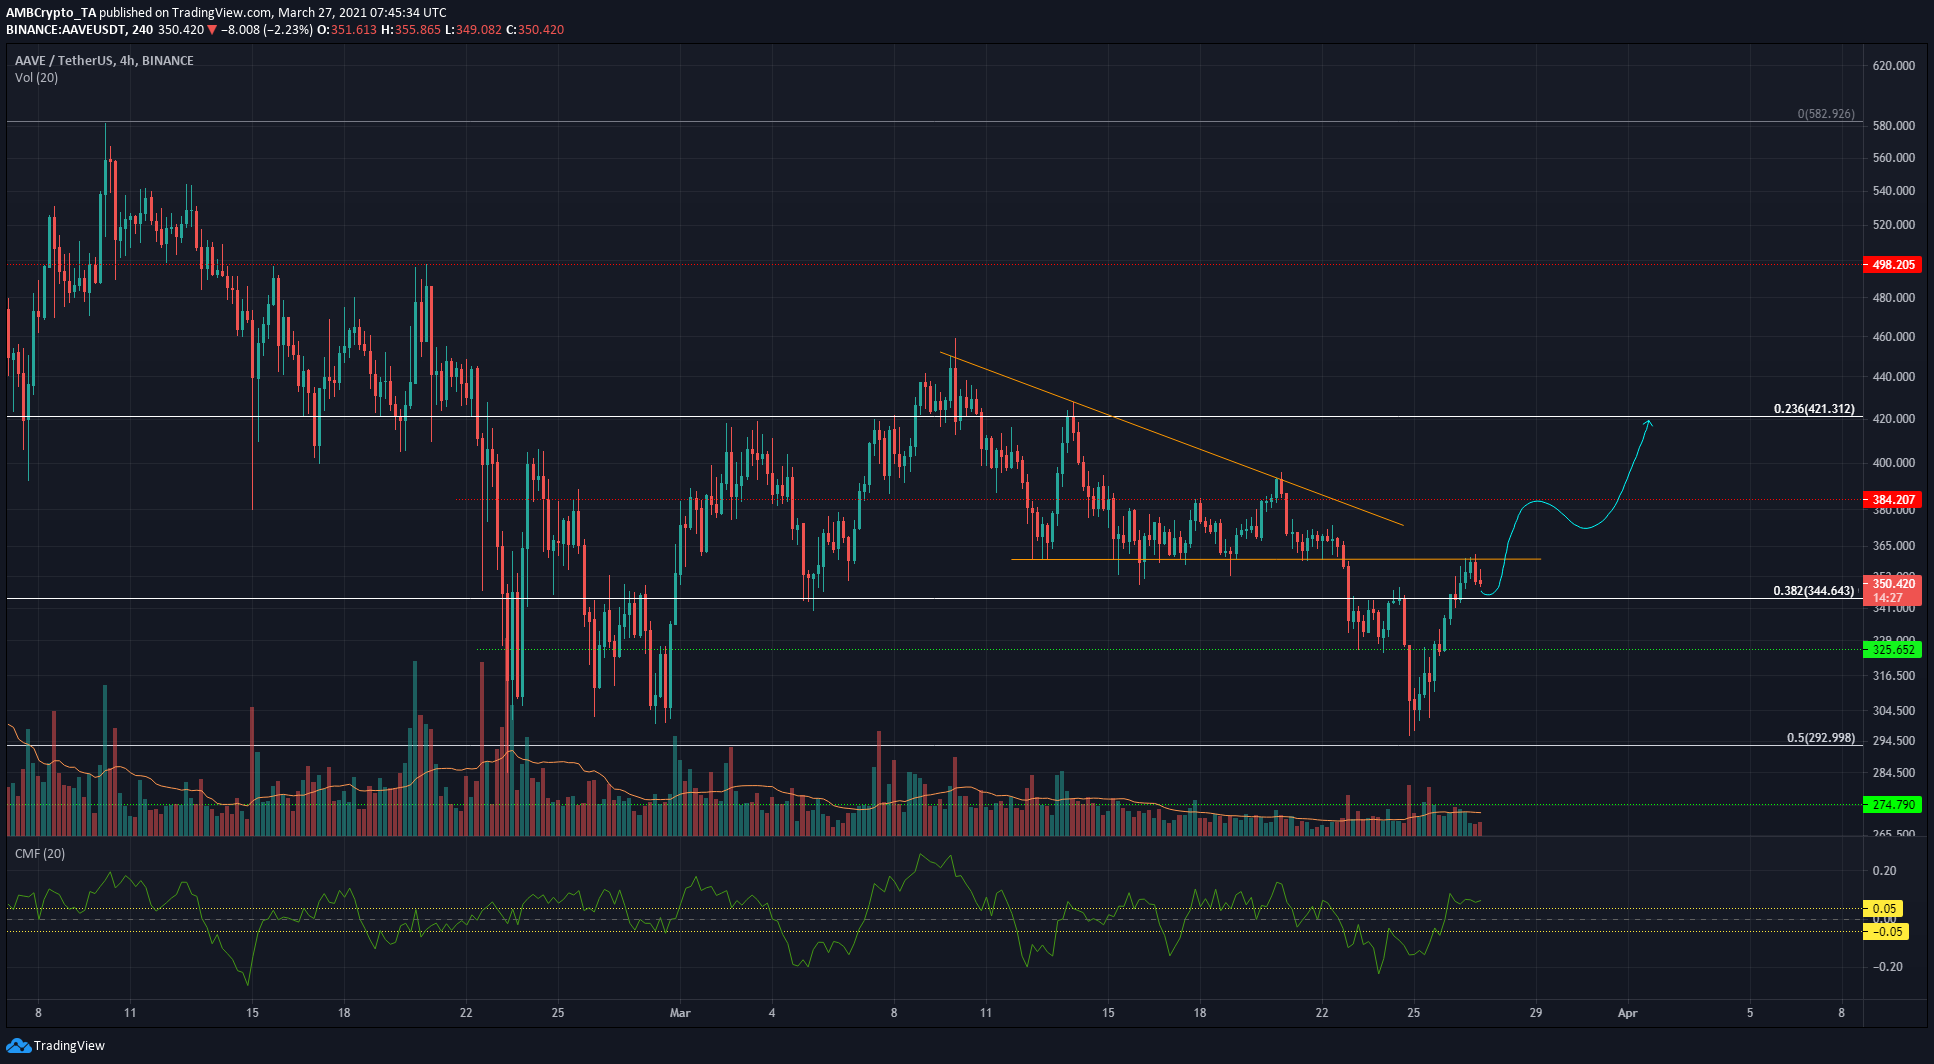
Marked in cyan is a bullish scenario for AAVE. The breakdown beneath the descending triangle (orange) saw a strong bounce near the $300 mark, to retest $360. The 38.2% retracement level at $344 has become of crucial importance now. The $340-$350 region needs to see strong buying pressure for the bullish case to materialize.
Losing the $344 level once more will likely see AAVE forced to drop to $300 again. Chaikin Money Flow showed buyers were dominant with net capital flowing into the market on the 4-hour chart.


