Cosmos surges nearly 10% in 24 hours – Will the momentum last?
ATOM’s price rallied by over 9% in the last 24 hours. While its price rose, Cosmos’ network activity also went up.
- Bullish sentiment around ATOM has increased substantially over the last 24 hours.
- After a comfortable rally, a few of the market indicators turned bearish on ATOM.
While most cryptos initiated their bull rallies in mid-October, Cosmos [ATOM] was late to join the party. The token’s price started gaining upward momentum on 29 October and soon after ATOM’s price went up in double digits. Though its price action was delayed, Cosmos’ network activity has been growing for quite a few weeks now.
Read Cosmos Hub’s [ATOM] Price Prediction 2023-24
Cosmos is surprising investors
After a wait, ATOM finally began its bull rally as its price was up by more than 10% over the last couple of days. In fact, according to CoinMarketCap, ATOM’s price surged by over 9% in just the last 24 hours.
At the time of writing, it was trading at $7.93 with a market capitalization of over $2.9 billion. Cosmos’ 24-hour trading volume also spiked by 189%, acting as a foundation for the price uptrend.
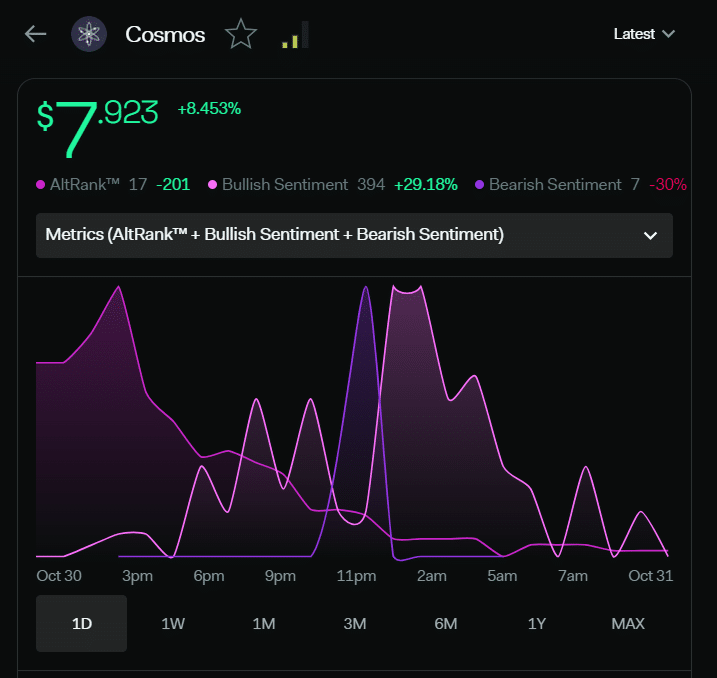
LunarCrush’s data revealed that investors were highly confident in ATOM. This was evident from the fact that in the last 24 hours, bullish sentiment around ATOM increased.
Its Altrank also improved considerably, which is generally perceived as a bullish signal, suggesting a further hike in its value.
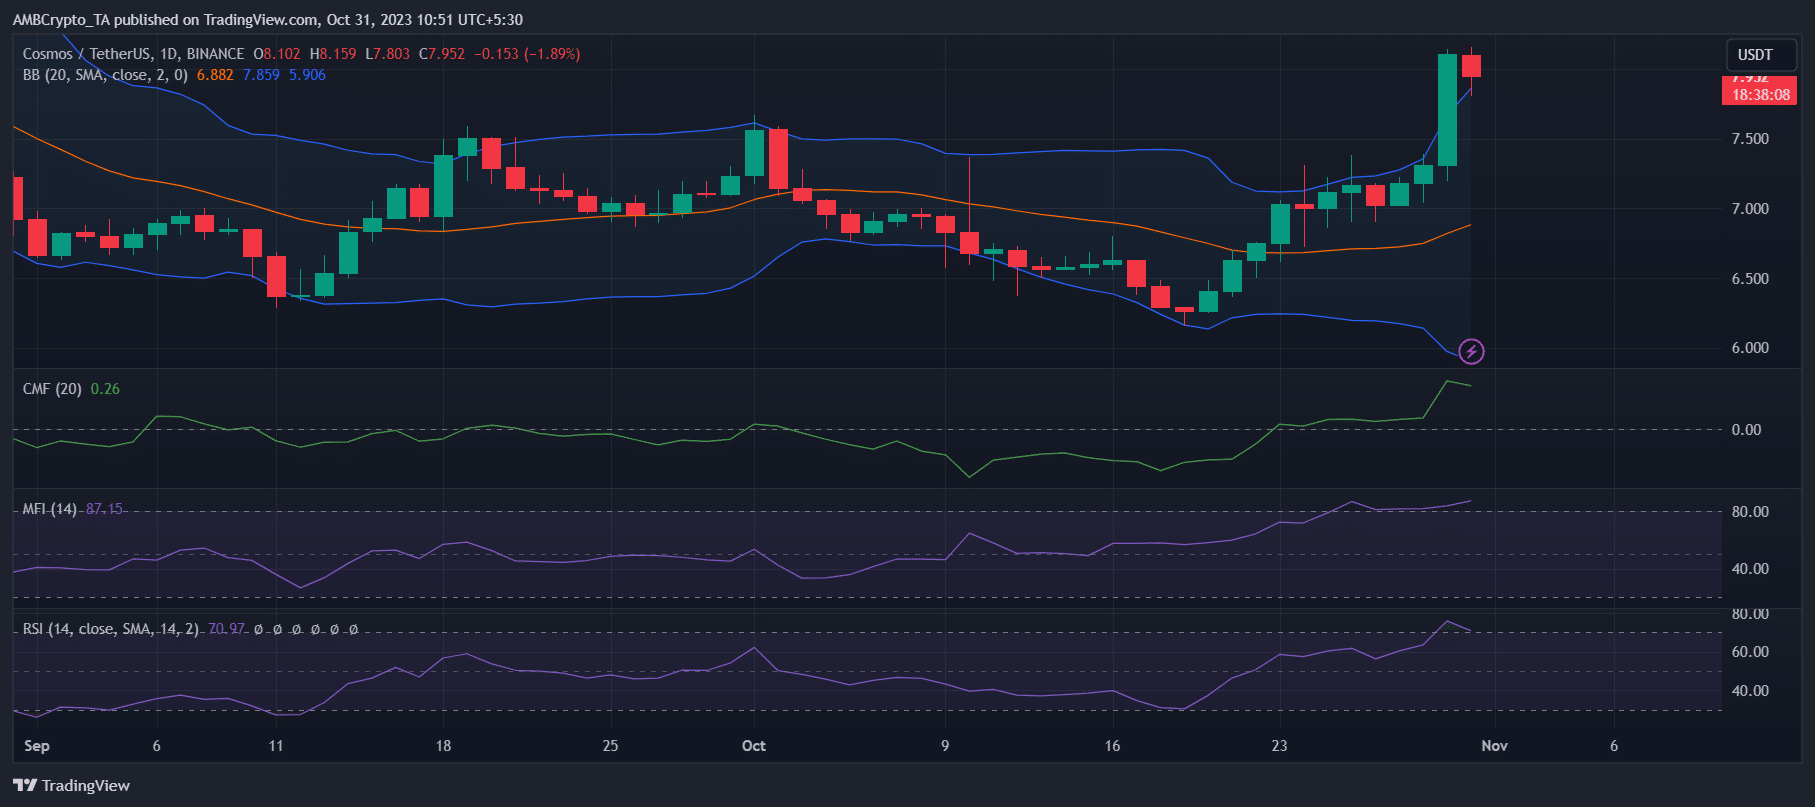
A look at ATOM’s daily chart gave more insight into the token’s bull rally. ATOM’s Relative Strength Index (RSI) and Money Flow Index (MFI) both went up over the last few days. The same remained true with its Chaikin Money Flow (CMF), which was a positive signal.
However, the scenario was changing as Cosmos’ RSI and MFI entered the overbought zone. Its CMF also registered a slight downtick. On top of that, ATOM’s price touched the upper limit of the Bollinger Bands, which can cause a trend reversal in the days to follow.
A closer look at ATOM’s ecosystem
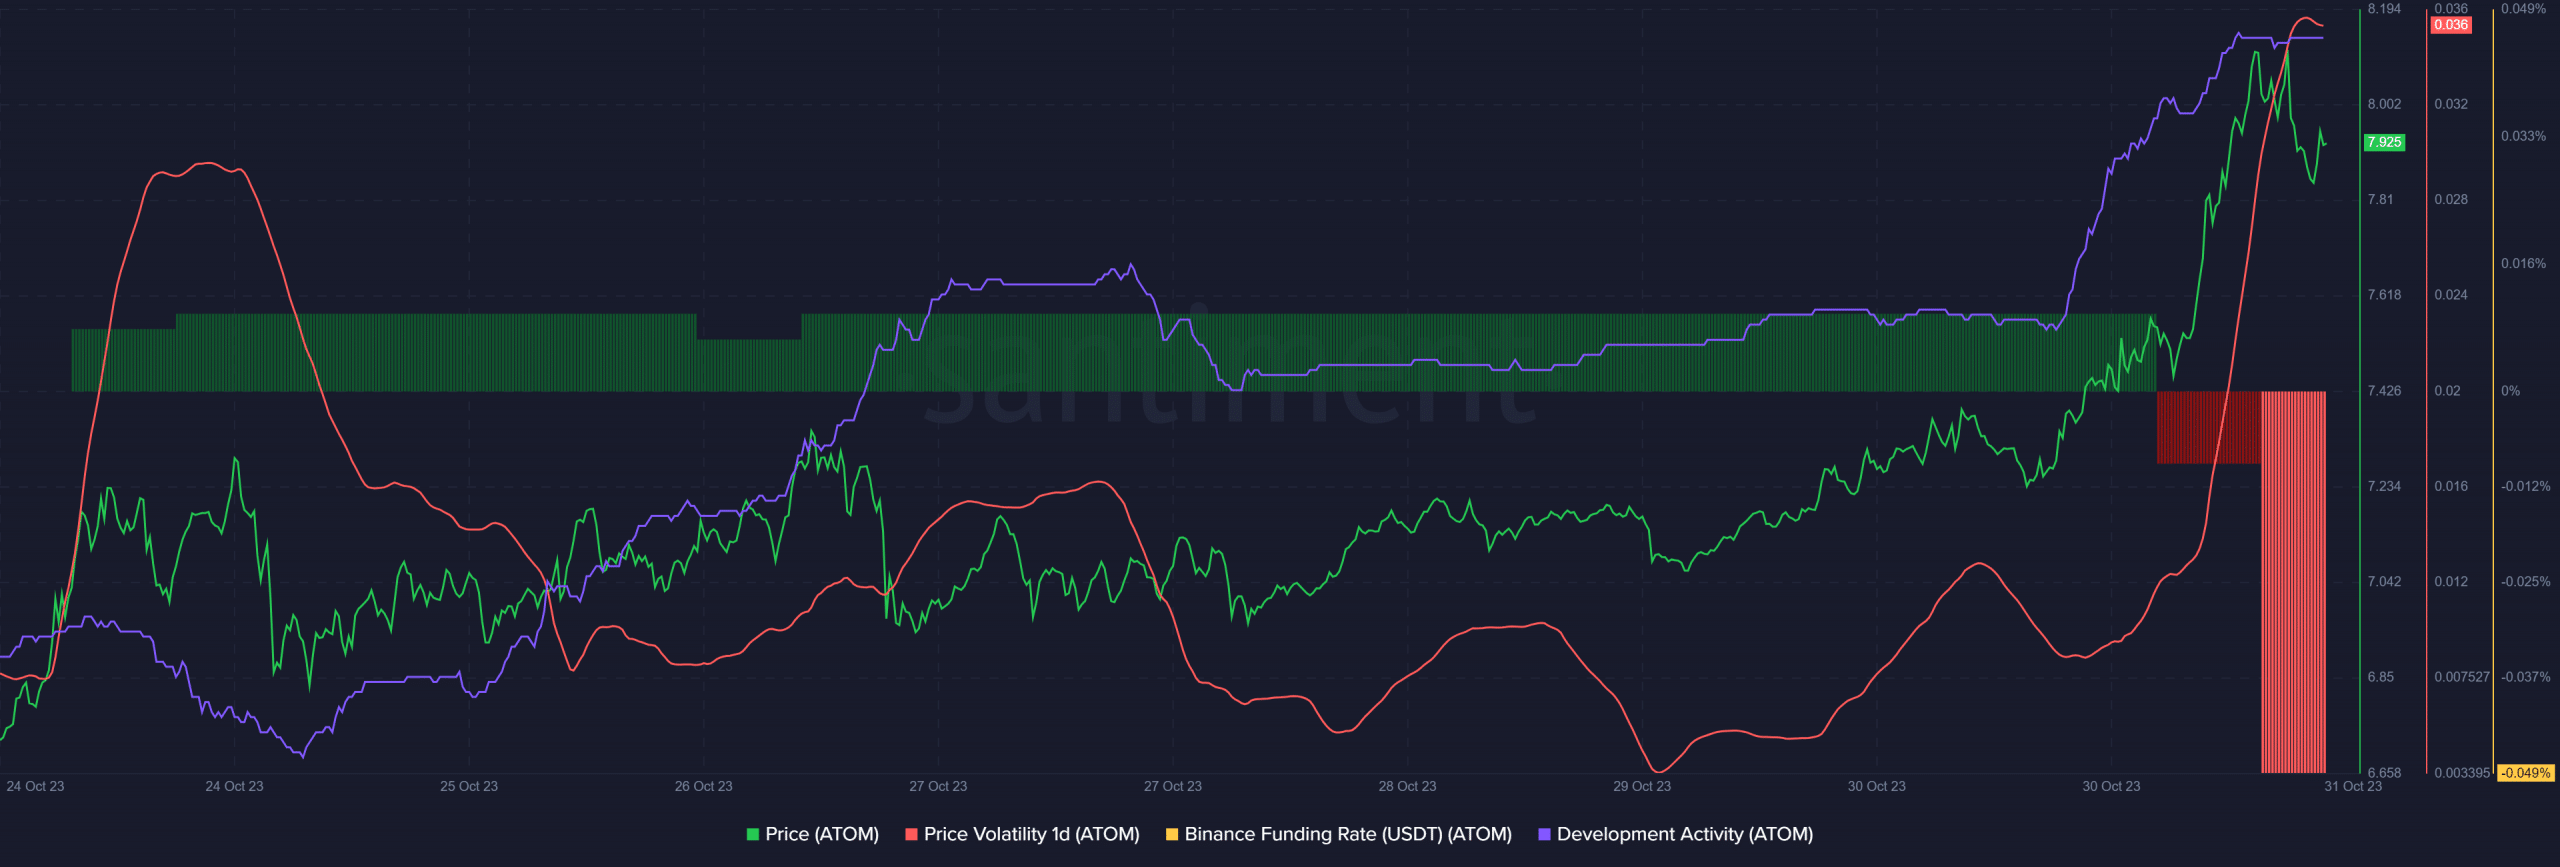
Like the indicators, a few of the metrics also looked bearish. For instance, ATOM’s Binance Funding Rate recently turned red.
This meant the derivatives buyers were reluctant to purchase the token at a higher price. However, its 1-day Price Volatility spiked substantially. Another positive signal was Cosmos’ high Development Activity.
Realistic or not, here’s ATOM’s market cap in BTC terms
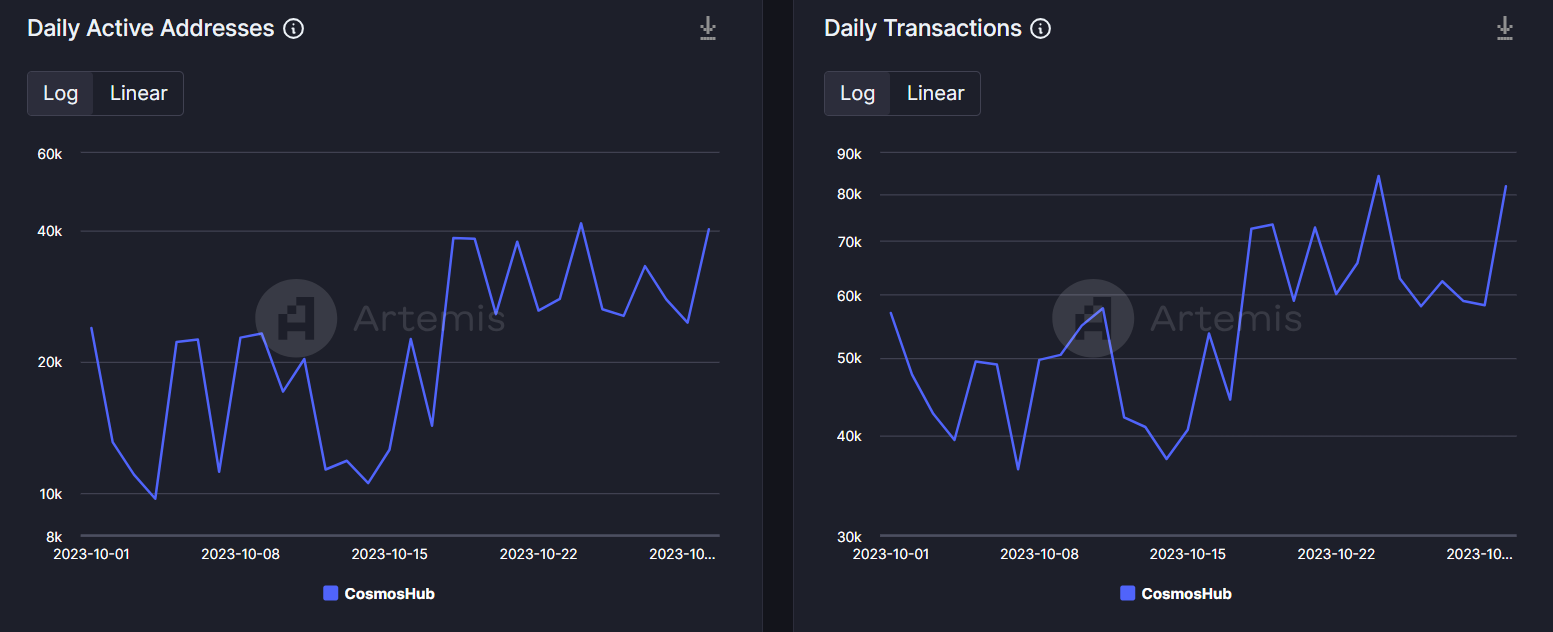
It was interesting to note that while its price took some time to move up, the blockchain’s network activity gained momentum for quite a few weeks.
As per Artemis’ data, Cosmos’ daily active addresses and daily transactions increased over the past month, suggesting increased usage and adoption. Apart from this, ATOM’s performance in the DeFi space was also commendable, as its TVL surged substantially in the recent past.