Cosmos, Tron, NEAR Price Analysis: 27 January

With the market flashing relatively low volatility over the past two days, Tron and NEAR saw bearish patterns while flashing weak near-term technical indications.
On the other hand, Cosmos broke down from its flag and pole. Now, the $32.5-makr would be crucial for the bulls to defend.
Cosmos (ATOM)
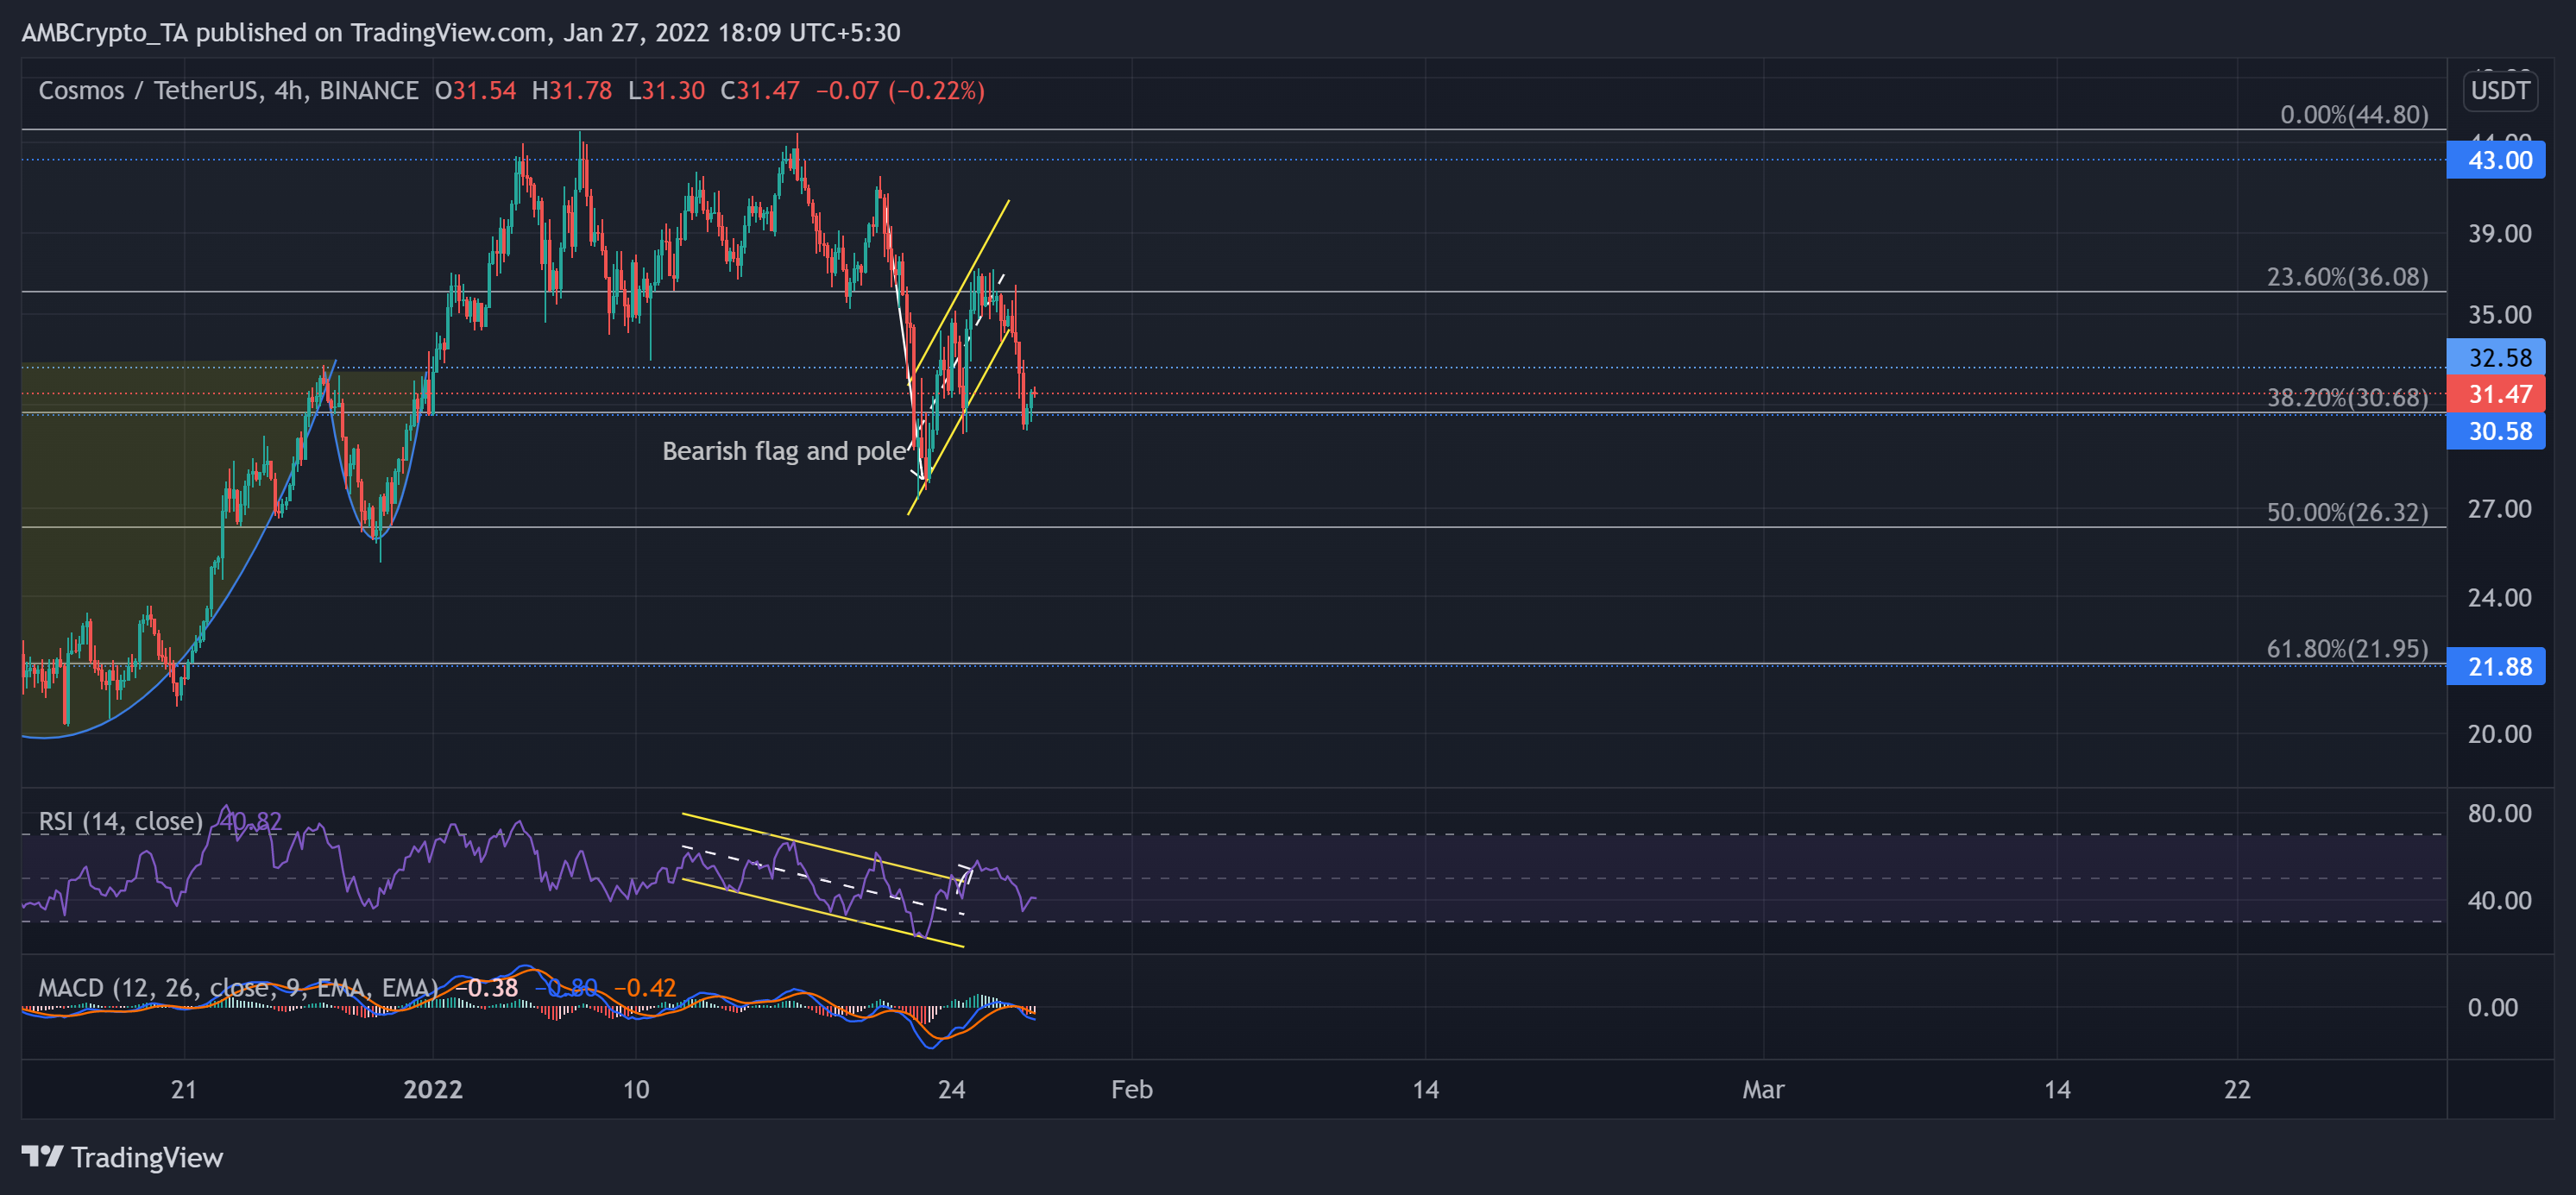
The sellers ensured the $43-mark resistance and kept exerting pressure since 17 January. The recent sell-off led ATOM to lose 35.6% of its value until 22 January.
As we saw in the previous article, ATOM saw an expected breakdown after forming a bearish flag and pole pattern. It dropped by nearly 17% in the past day only to find support at the 38.2% Fibonacci level. Now, the immediate testing grounds for the bulls stood at the $32.5-mark.
At press time, ATOM was trading at $31.47. The RSI saw a down-channel (yellow) breakout. It finally crossed the half-line but was quick to fall below it and stood weak at the time of writing. Also, MACD’s histogram plunged below the equilibrium, while its lines hinted at a bearish edge.
Tron (TRX)
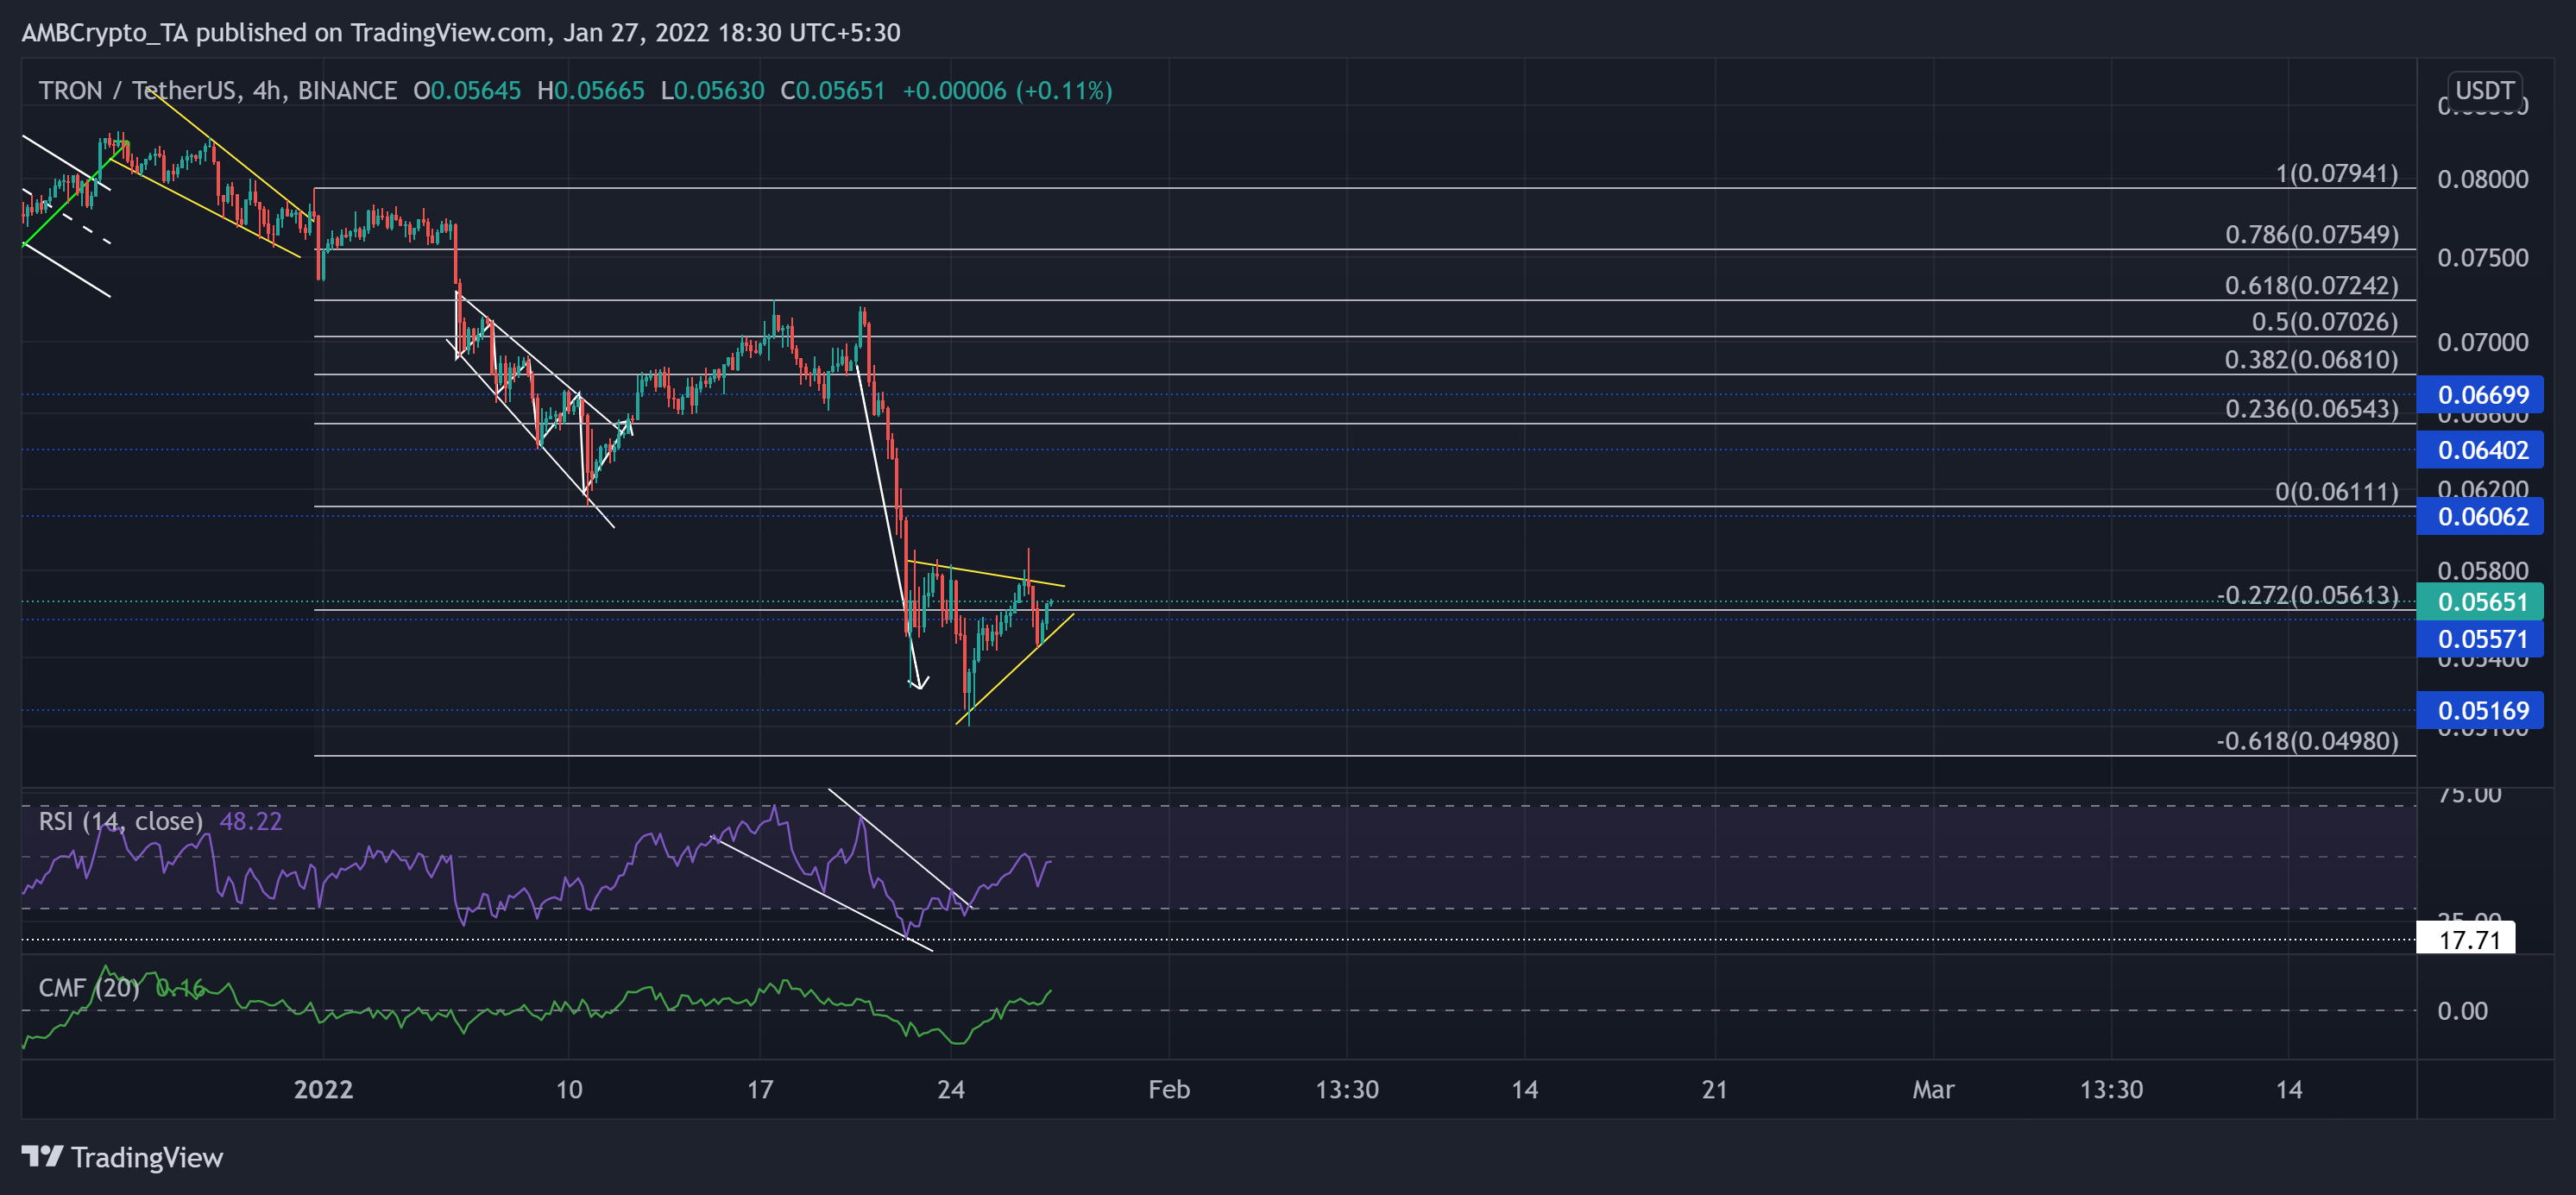
After reversing from the 61.8% Fibonacci resistance on 20 January, TRX correlated with the broader trajectory and steeply declined. The alt registered a 28.2% decline in just four days and touched its six-month low mark on 24 January.
Since the sell-off, TRX witnessed a bearish pennant pattern on its 4-hour chart. Unless the bears dwindled, the immediate resistance stood at the upper trendline of the pennant.
At press time, TRX was trading at $0.05651. after the falling wedge breakout, the RSI tested the half-line but still struggled to top the half-line. Nevertheless, the northbound CMF still kept some bullish hopes alive after crossing the zero-line.
Near Protocol (NEAR)
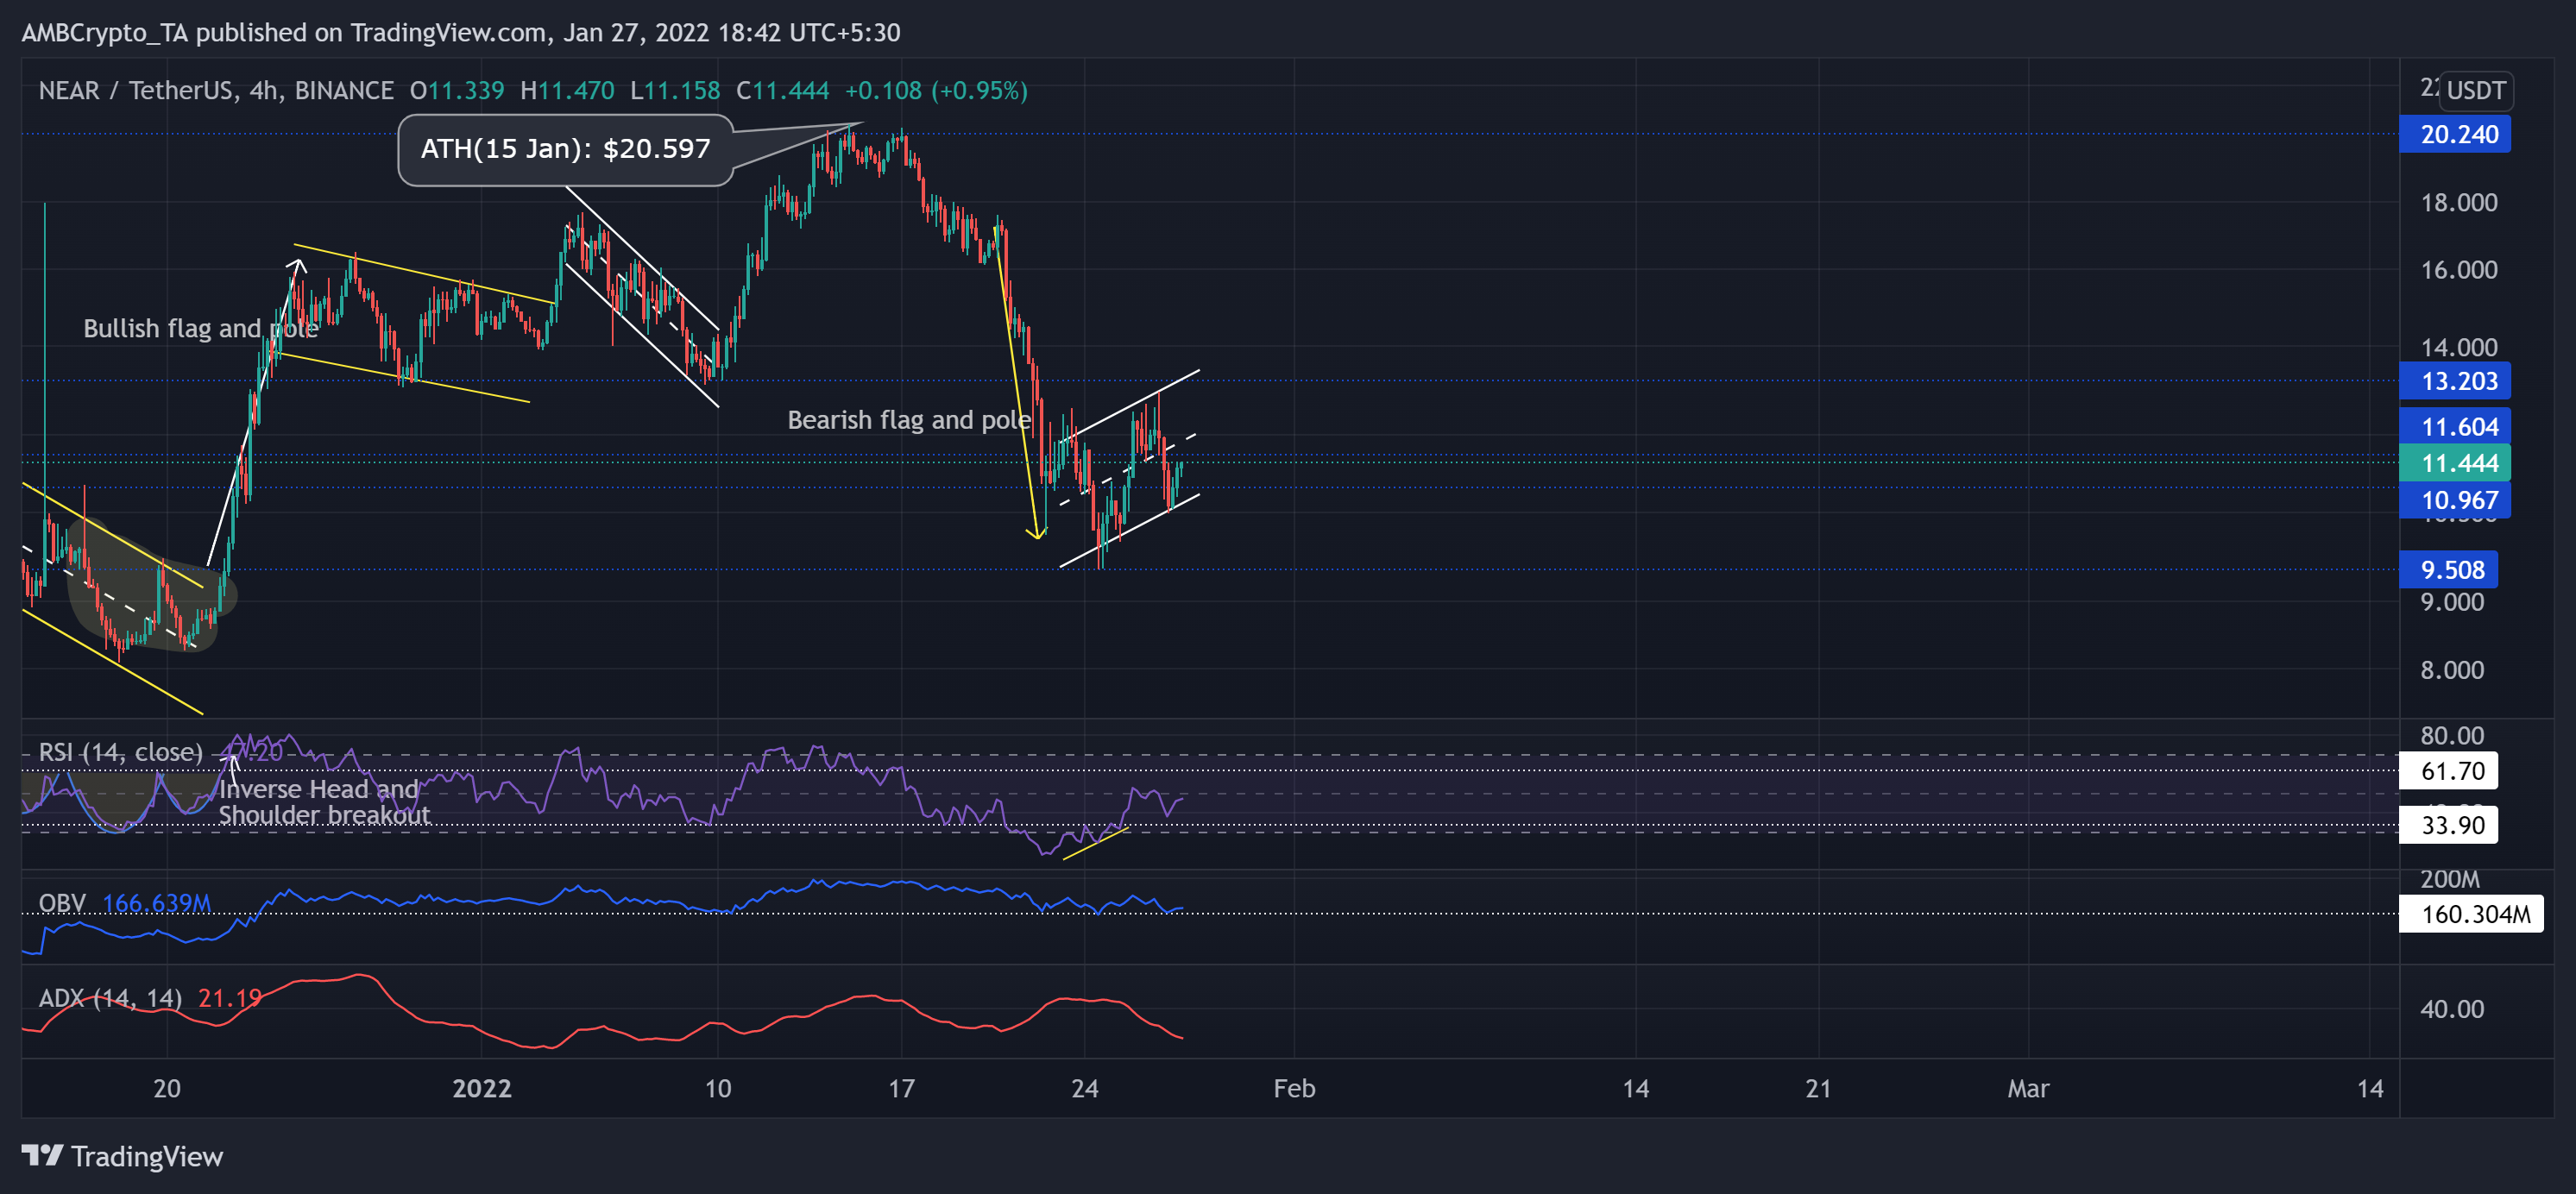
Since its ATH, NEAR lost 53.83% of its value while losing the vital $13.2-level resistance (previous support). Further, the alt witnessed a bearish flag and pole pattern on its 4-hour chart. Now, the immediate hurdle for bulls stood at the $11.6-mark.
At press time, the alt traded at $11.444. After plunging to its record low, the RSI saw a solid revival in the past five days. A sustained close above half-line would further open up a recovery possibility. Interestingly, the OBV still maintained its support that upheld higher prices over the past month. This reading displayed a potential comeback possibility for the bulls. However, the ADX depicted a weak directional trend for NEAR.