Could BCH regain its pre-FTX implosion value of $126? Here’s all you need to know

- BCH was bullish, targeting the 78.6% and 100% Fibonacci levels
- Open interest surged in the post-market crash but has since fallen back slightly
Bitcoin Cash [BCH] surged mid-week with a nostalgic aim at its pre-FTX implosion value of $126. However, it ran into several obstacles along the way, but the target remained the same. At press time, BCH was trading at $114.1, up 30% from its 9 November low ($87).
Read Bitcoin Cash’s [BCH] price prediction 2023-2024
If the bulls maintain their momentum, BCH could regain its lost glory after breaking through resistance at $117.7.
A retest of the $117.7; is a breach to the upside plausible?
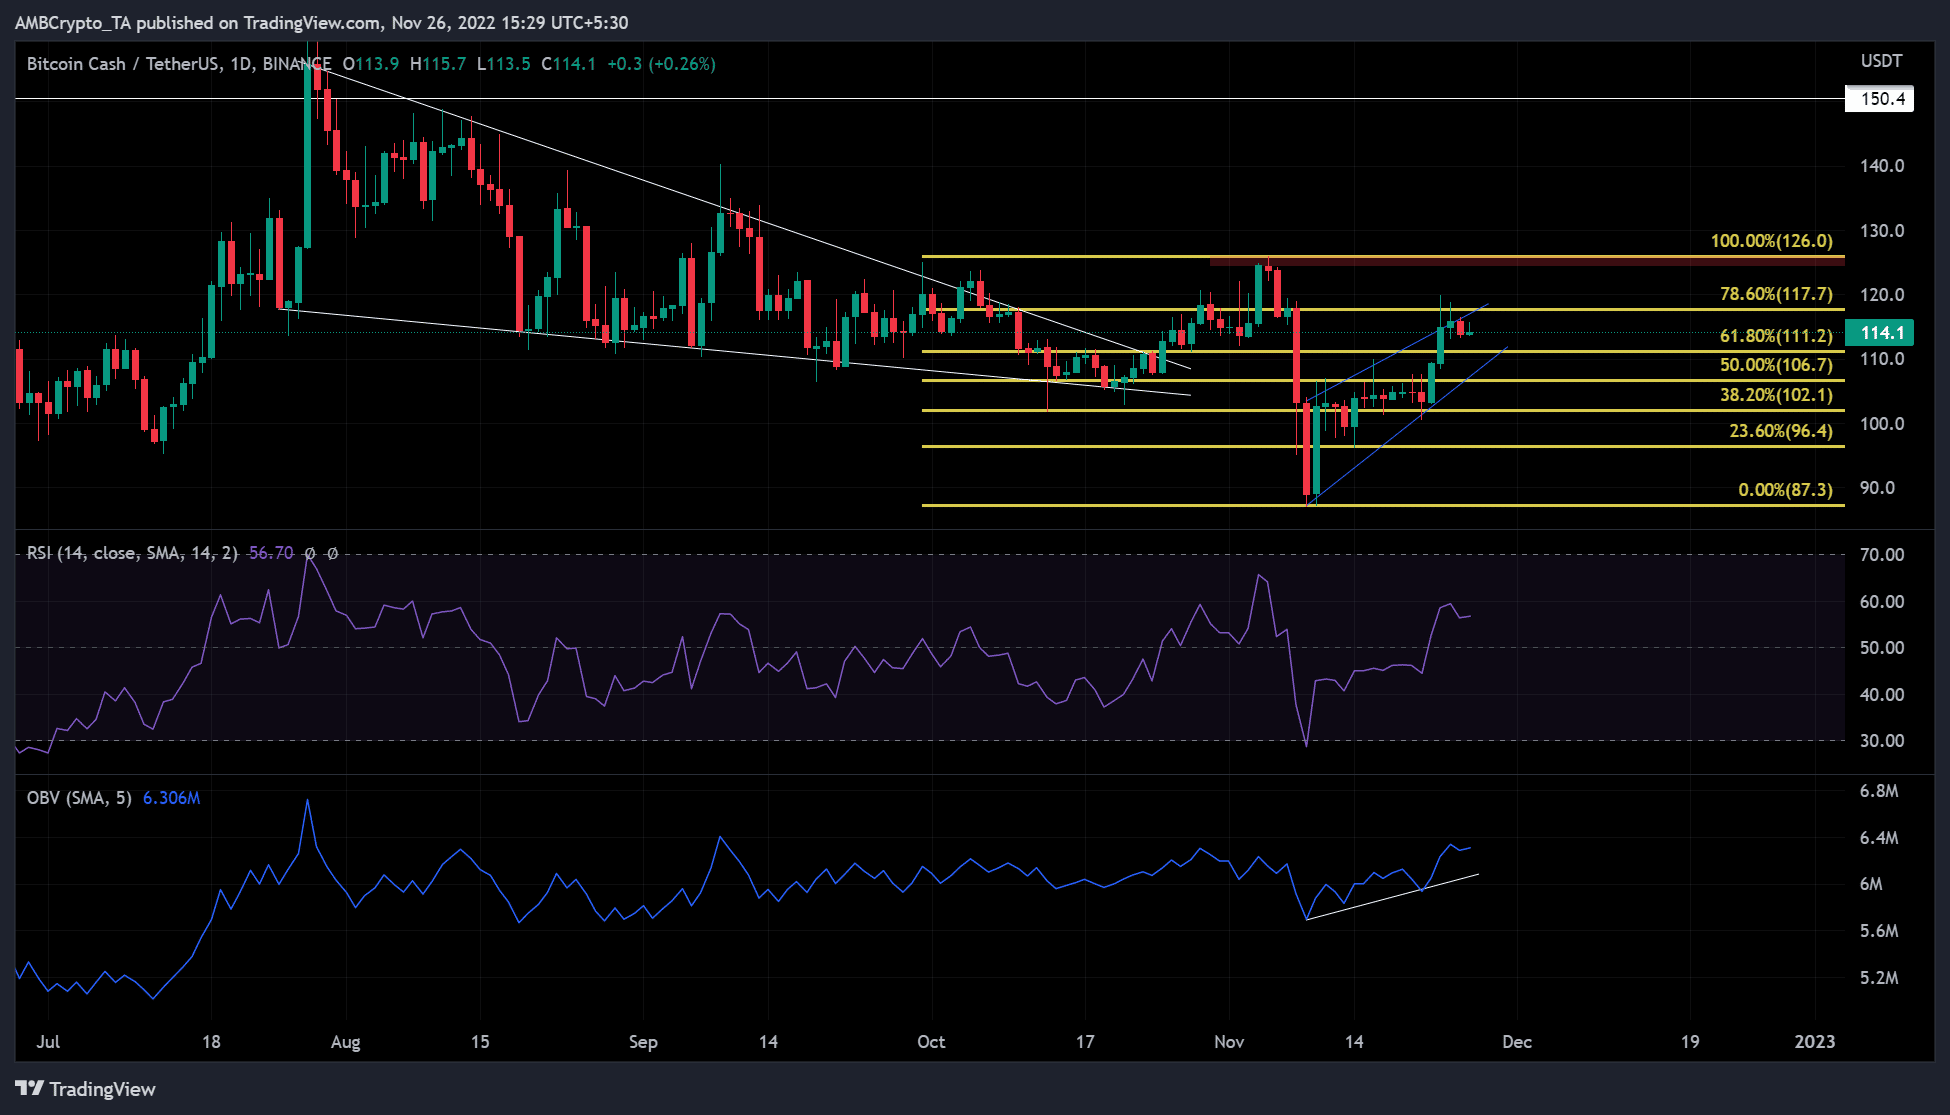
The daily chart of BCH showed mixed signals for its long-term holders. BCH formed a falling wedge pattern (white) between August and late October. Falling wedge patterns are generally bullish and lead to an upside breakout that matches their height. With the falling wedge pattern of BCH, the breakout target could have been $150.4.
But the FTX implosion broke the uptrend and forced a downtrend at $126, driving BCH’s nostalgic rally to a halt. Since 10 November, BCH initiated another price recovery.
The rally was reinforced on 22 November after BTC recaptured $16K. The Relative Strength Index (RSI) was at 56, indicating that stronger upward momentum is developing. On-Balance Volume (OBV) has also reached several highs over the past two weeks.
This indicated that BCH built up enough buying pressure to overcome the bearish order block at the 78.6% Fib level ($117.7). Therefore, BCH could break through resistance at $117.7 and target another bearish order block at the 100% Fib level ($126.0) in a couple of weeks.
However, a bearish breakout from the rising wedge would invalidate the above bias. Overall, the price action formed a rising wedge – a typical bearish pattern – over the past two weeks. In this case, a bearish breakout would send BCH down about 18% from its breakout point, based on the height of the falling wedge.
BCH’s Open Interest rose after the 8 November market crash, but…

According to Coinglass, BCH’s open interest (OI) increased after the crypto market crash. This showed that there were more derivative contracts and, therefore, more money flowed into the futures and options market. This was a strengthening market, which was consistent with the upward trend of BCH since 10 November on the daily price chart.
However, since then, the market has lost traction as BCH entered the weekend with a slightly falling OI. If the decline in OI continues over the long term, a trend reversal in addition to a price correction could be imminent.
Increasing BCH negative sentiment could hurt upside momentum
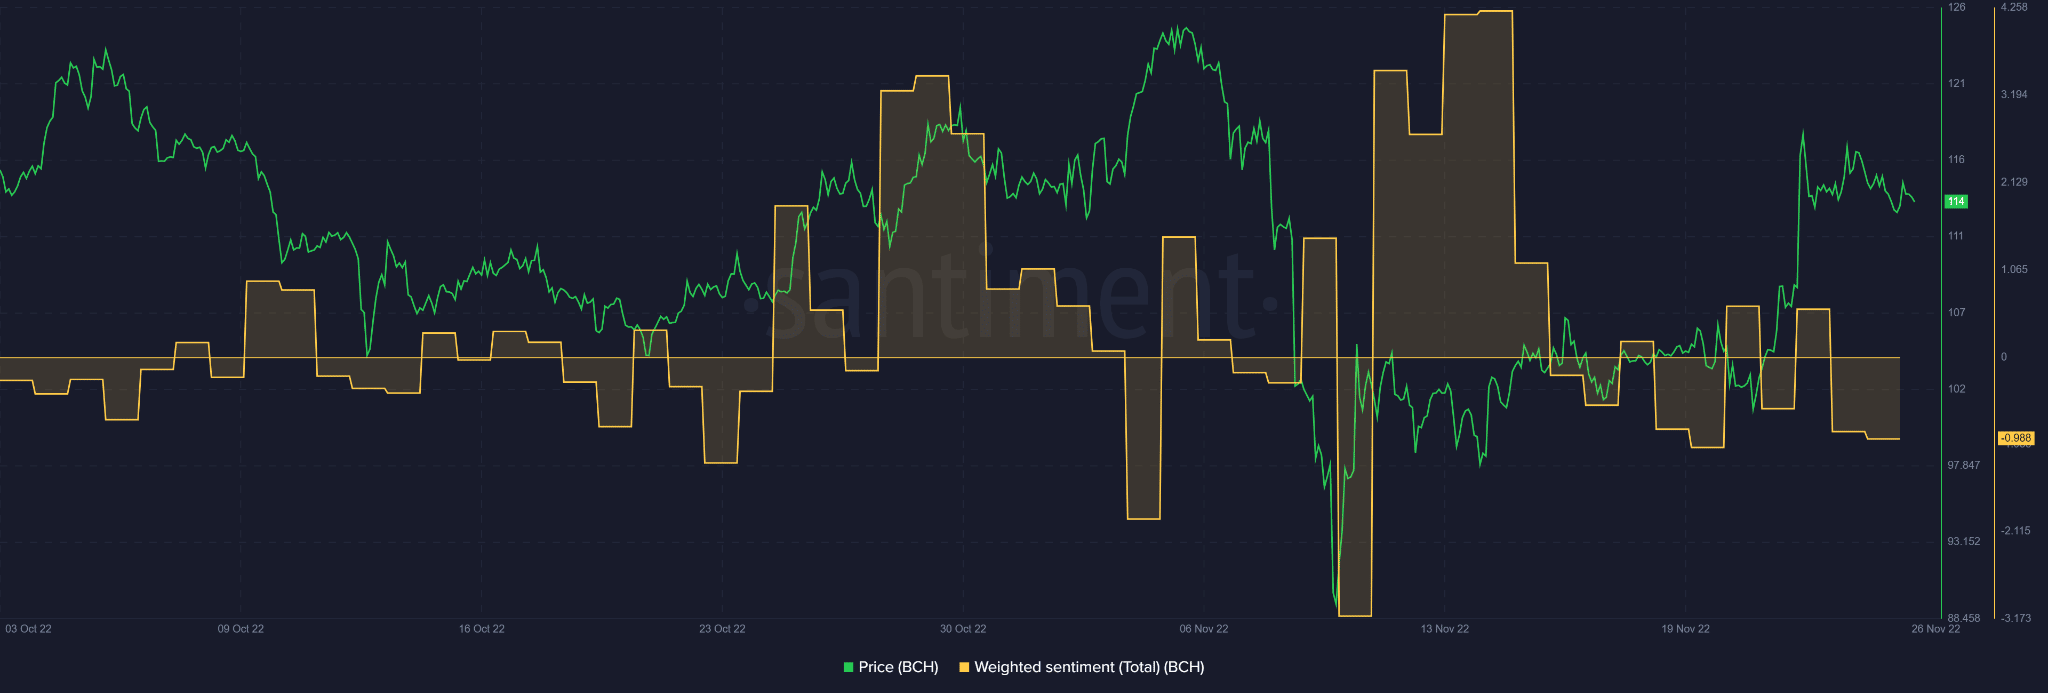
Furthermore, data from Santiment showed a negative sentiment extending slightly southward at the time of publication. Throughout Q3, BCH prices showed a positive correlation with the sentiment. Thus, if negative sentiment persists over the long term, a price correction could be likely.
Therefore, BCH ‘s sensitivity to BTC and overall weighted sentiment should be among the most important factors before long-term holders of BCH positions trade.


