
Bitcoin’s invisible resistance isn’t price: It’s THIS on-chain imbalance

After the steep correction in the past week, the cryptocurrency market has once again been showing signs of a trend change. The altcoin market has been noting a surge in the short-term that has pulled many digital assets from the bearish zone to a bullish one, including Crypto.com, SushiSwap, and Aave.
Crypto.com Coin [CRO]
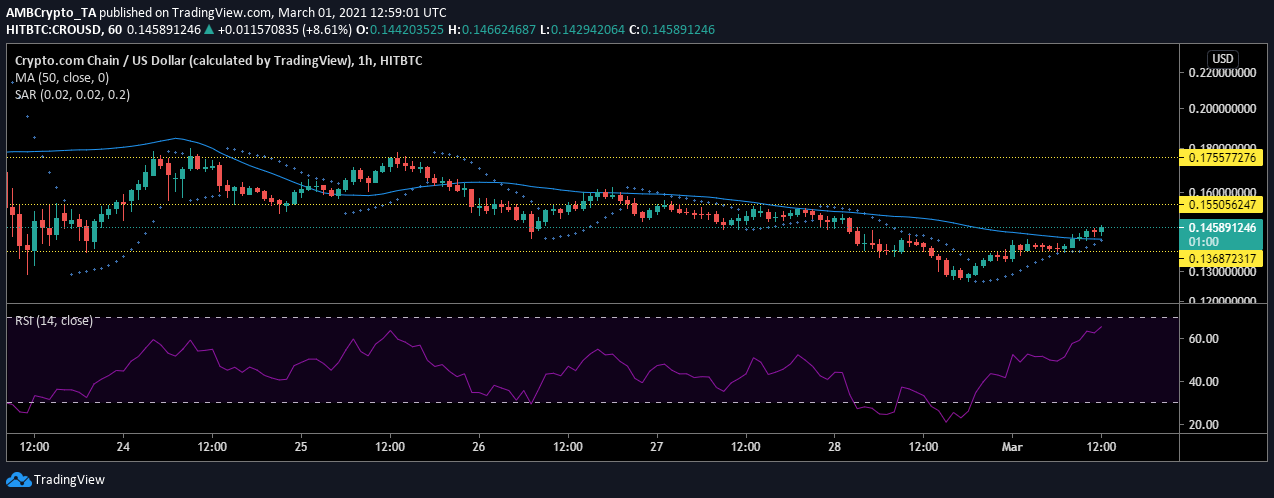
Source: CROUSD on TradingView
The above chart indicated that the Crypto.com Coin [CRO] had moved under the $0.1368 support level and dropped to $0.1263. The price witnessed a sudden surge in its value and headed above the previous support level.
At the time of writing, the CRO was being traded at $0.1460 and the trend has been flipped to a bullish one. The 50 moving average slipped under the candlesticks, indicating the price was on an uptrend. Similarly, the markers of a Parabolic SAR also aligned under the price bars suggesting the rising value of CRO.
The Relative Strength Index noted this as it reached 65 points. However, the coin may not be able to retest its resistance at $0.1550 due to a lack of momentum. Nevertheless, even if the price began to collapse the support might remain strong at $0.1368 this time.
SushiSwap [SUSHI]
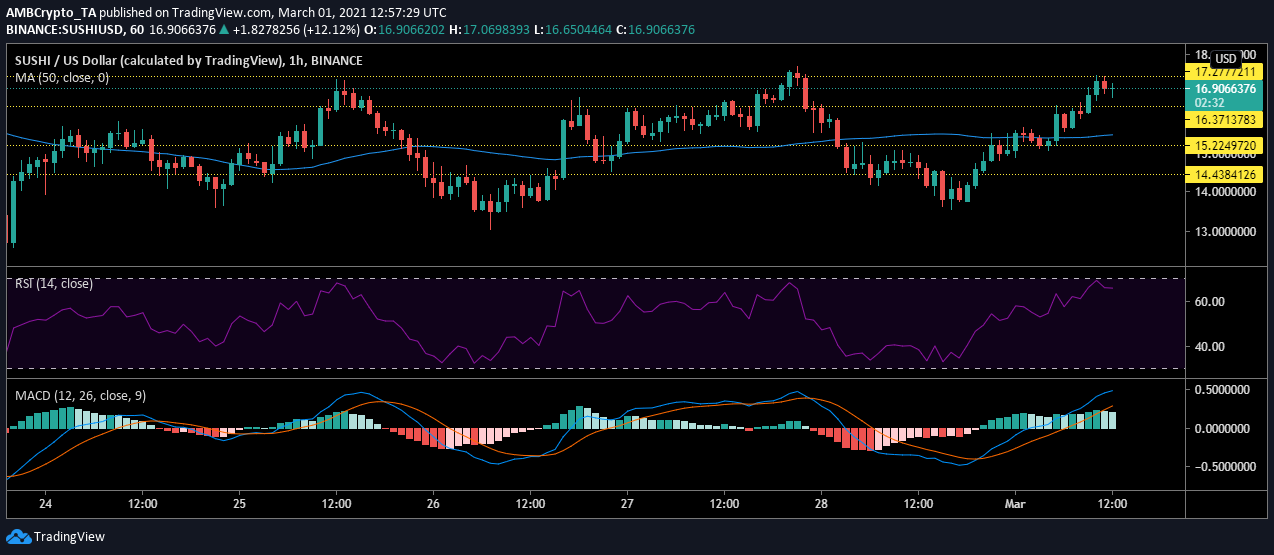
Source: SUSHIUSD on TradingView
SushiSwap has been a prominent project in the decentralized finance [DeFi] ecosystem. At the time of writing, the digital asset was testing its immediate resistance present at $17.27 while being traded at $16.76.
This was possible due to the boost that took place in the short term and put the crypto back on a bullish track. The 50 moving average moved under the candles and could provide support to the coin in case of a fallout.
The current range for SUSHI’s movement has been restricted between $16.37 and $17.27. However, as the price consolidates in this range, the relative strength index indicated that despite SUSHI moving dangerously close to the overbought zone, the sellers had entered the market and the value of the indicator was moving towards equilibrium. While the bullishness was highlighted by the MACD indicator.
Aave
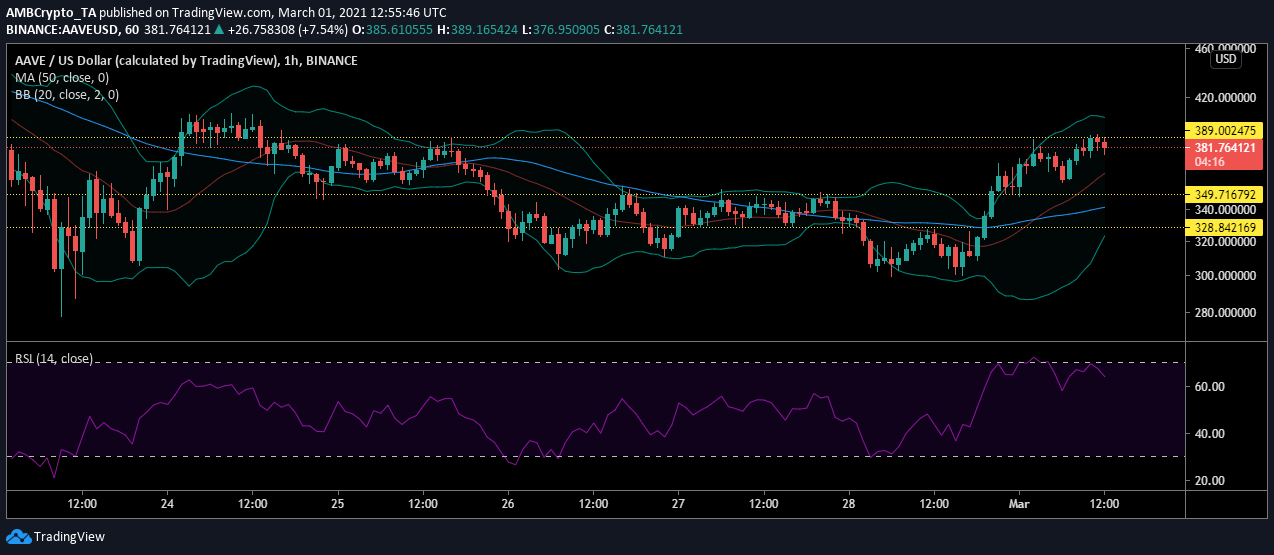
Source: AAVEUSD on TradingView
AAVE was trading at $377.10 and the selling pressure and has led to a failed attempt at breaching the resistance at $389. As the market became extremely volatile the 50 moving average and the signal line moved under the price bars confirming this uptrend.
Meanwhile, the volatility-driven market has teamed up with sellers currently as the Relative Strength Index also hit the overbought zone. Although AAVE has been close to the overbought zone for a long time, a correction in the current market could push its value to the next support at $349.


