Crypto Fear and Greed Index: Market prices at a buy zone, or is it still too risky?

- Bitcoin was oversold and extremely imbalanced, but an immediate price bounce is not guaranteed.
- A defense of the $50k support zone and some stabilization could persuade investors to bid despite the risky conditions.
The crypto market was in a state of disarray when the price of Bitcoin [BTC] was just above the $60k level a day before press time. Since then, the $49k low has been set, and further losses could arise during the New York trading session, sending participants into a panic.
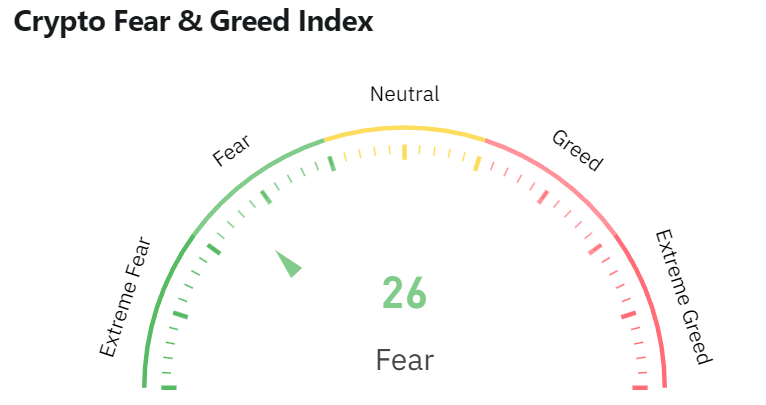
The crypto Fear and Greed index was at 31, showing fear in the market. Generally, fearful times are good for buying opportunities. Will Monday turn out to be another such moment?
Fear and Greed Index plummets after crypto prices incite alarm

Source: Coinglass
Since the 29th of July, the altcoin market capitalization is down by $163 billion, or 28%. This measures the top 125 altcoins excluding Ethereum [ETH] and of course, Bitcoin.
The two giants haven’t fared well either, losing 37.85% and 30% respectively at their lowest.
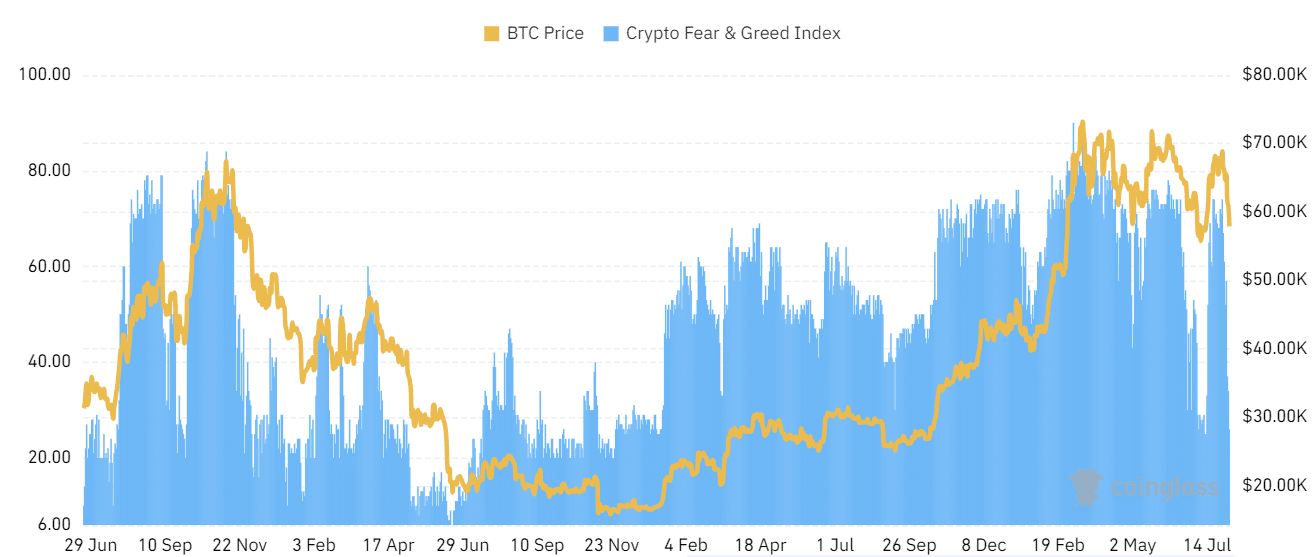
At press time, the index showed “fear” with a reading of 26. This has not been the norm for crypto in 2024, with fear readings seen on some days in the past two months.

Source: Coinglass
The most recent example was the 13th of July when the index fell to 25. The price of Bitcoin was at $57.8k then and bounced to $68.8k just two weeks later.
If history repeats itself, Bitcoin might hold on to the $50k support and climb higher.
Will the late short sellers be punished for their mistimed trades?

Source: Hyblock
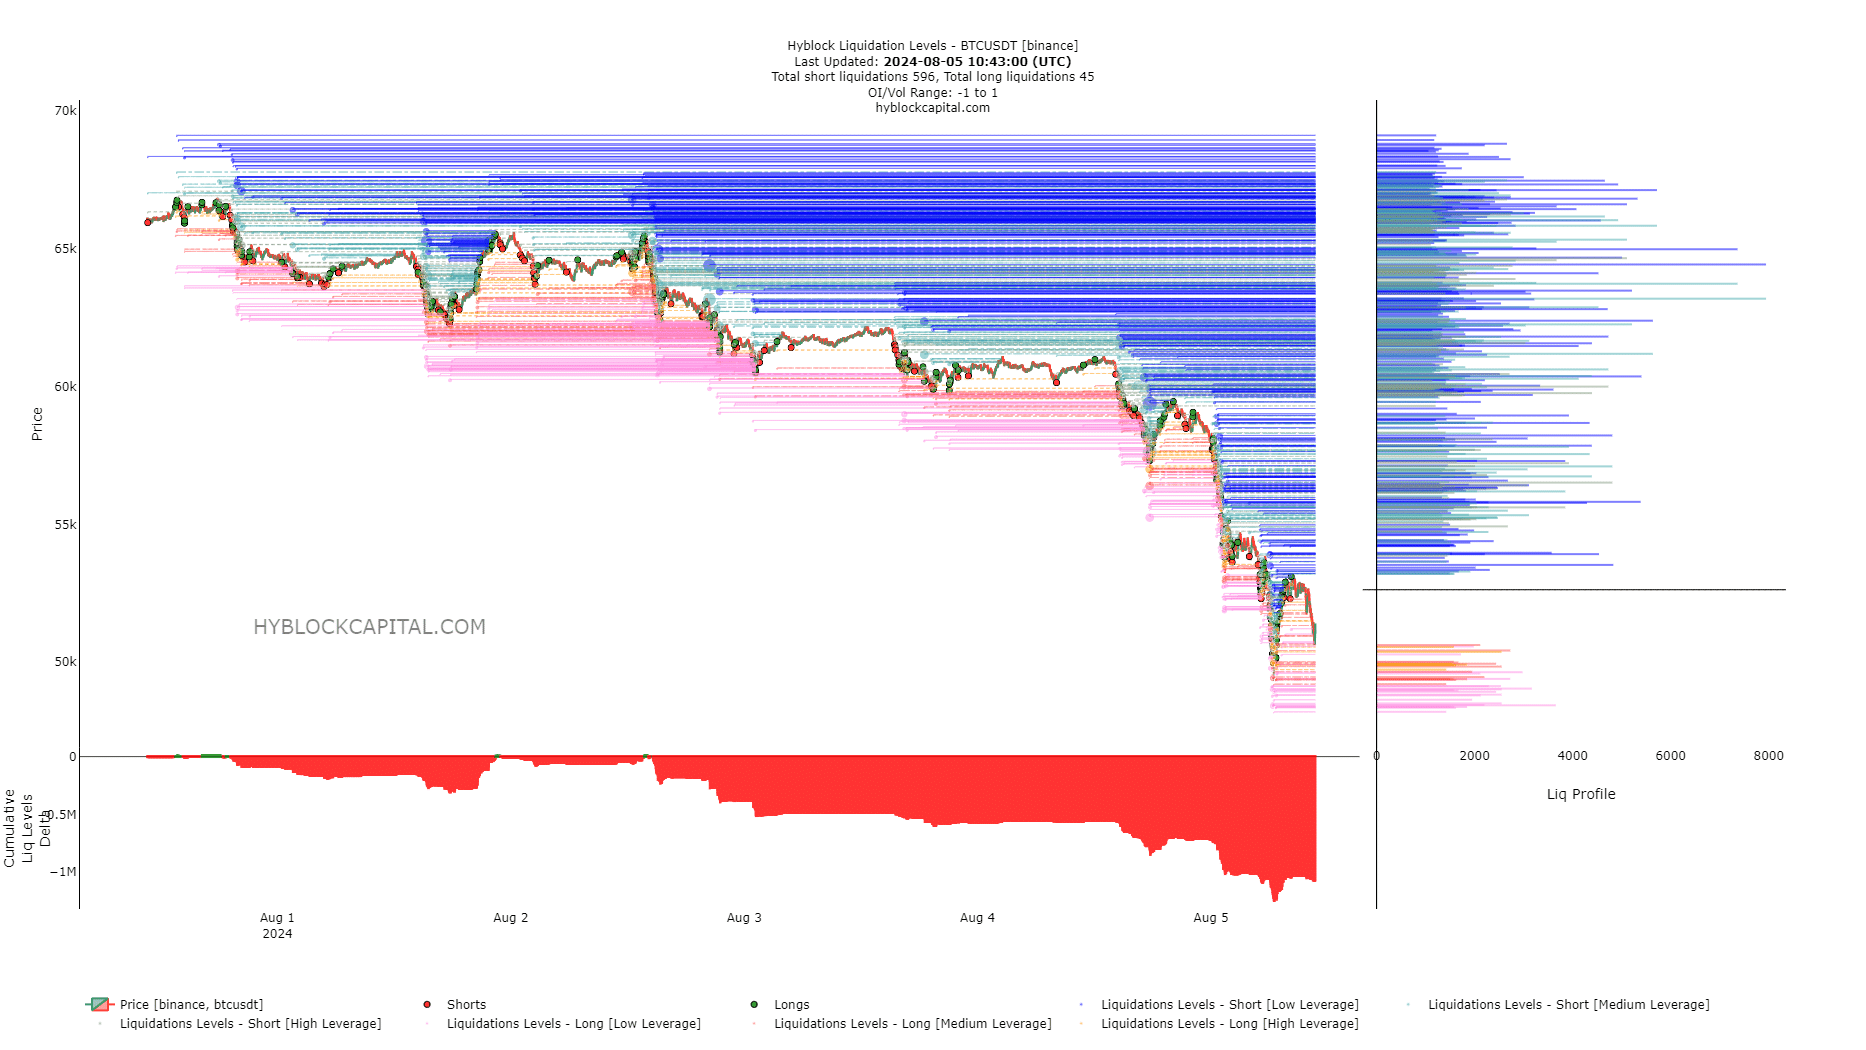
The daily RSI was at 23, reflecting oversold conditions. The cumulative liquidation levels delta on the chart above was increasingly favoring the short positions.
Read Bitcoin’s [BTC] Price Prediction 2024-25
This imbalance can be wiped out by a sharp price bounce.
With sentiment as it is and fear ruling the market, strong buying pressure might not arrive for another 24-48 hours. If it does, the $53.9k and $55.7k levels would be the short-term resistances to watch.


