


- MANTRA, MultiversX, and Notcoin were the biggest winners last week.
- ORDI, Pendle, and Fantom ended the past week as the biggest losers.
Mantra has dominated the gainers chart over the past week, leading the market with solid performance. In contrast, Pendle has struggled, remaining on the losers chart for a second consecutive week.
Biggest winners
Mantra (OM)
In a week characterized by general declines in the cryptocurrency market, MANTRA (OM) stood out with a notable gain.
According to CoinMarketCap, OM surged by 25.05% over the past week, securing its position as the top gainer. The price movement analysis revealed that OM started the week around $0.7 and gained momentum as the week progressed.
Despite experiencing some dips that momentarily drove its price below the week’s starting point, it closed the week trading above $0.8.
As the new week began, OM continued its upward trajectory, trading around $0.9. Its market capitalization has also increased significantly, currently over $765 million, marking an 8% rise in the last 24 hours.
However, its trading volume has decreased by over 20%, now at approximately 32.3 million.
MultiversX (EGLD)
MultiversX (EGLD) finished the week as the second-largest gainer in the market, with data from CoinMarketCap indicating a 20.66% increase by the week’s end.
The analysis of its price trend revealed that EGLD started the week trading at approximately $28.8 and closed near $35 despite experiencing some fluctuations. Overall, the asset displayed more uptrends than declines throughout the week.
EGLD’s price movements were characterized by sharp spikes, a notable feature of its weekly trading pattern. As of this writing, it was trading at around $34.1.
The market capitalization of EGLD has risen to over $927 million, with a 2% increase in the last 24 hours. However, it’s important to note a significant reduction in trading volume, which has declined by almost 50%, now at nearly $34 million.
Notcoin (NOT)
Notcoin (NOT) represented a significant shift on the weekly gainers’ chart, where it followed MultiversX as the next cryptocurrency in line but with single-digit gains initially.
Analysis of NOT’s price chart revealed that it started the week with a nearly 6% gain, trading at around $0.014. However, it faced a series of declines in subsequent trading sessions, culminating in a more than 9% drop by 5th July. At the end of that trading session, its price was about $0.010.
Despite these setbacks, a major rally towards the end of the week reversed its fortunes dramatically. NOT’s price surged by 28.61%, pushing it back into the winners’ chart and closing the week at around $0.013.
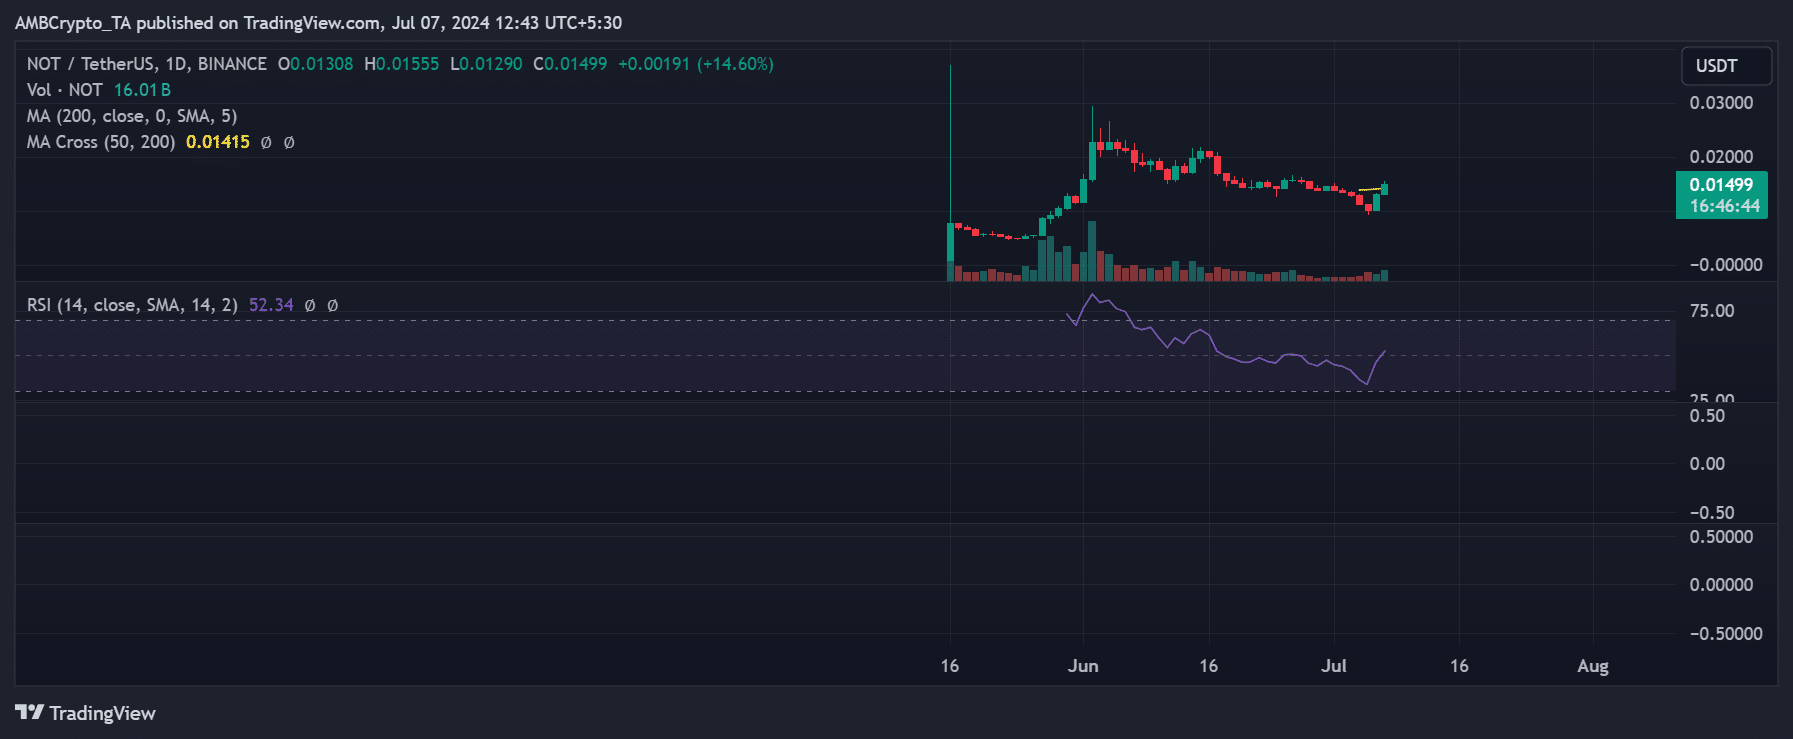
As of this writing, NOT was trading at around $0.014, marking an additional increase of over 15%. This rebound is accompanied by a significant uptick in trading activity, with its volume increasing by more than 150% in the last 24 hours to over 877 million.
Furthermore, its market cap has surged by over 44%, reaching over $1.5 billion. This made it the only asset among the top three gainers with a market cap in the $1 billion range.
Biggest losers
ORDI (ORDI)
ORDI (ORDI) experienced a significant downturn last week, leading the losers’ chart with a 23.26% decline, according to CoinMarketCap.
The data revealed that ORDI began the week trading around $38 but consistently trended downward from that point. The most dramatic drop occurred around 5th July, when its price plummeted from approximately $32 to about $27.
Despite a slight recovery later in the week, ORDI closed at around $30.7, which was insufficient to remove it from the losers’ list. As of this writing, it continued to trade within the $30 range.
The market cap of ORDI has risen slightly by over 4% to more than $630 million, suggesting some level of buying interest despite the recent price drops.
However, trading volume has decreased significantly by over 28% to around $124.3 million.
Pendle (PENDLE)
Pendle (PENDLE) continues to struggle in the market, marking its second consecutive week of significant losses. With a 22.45% decline, it was the second-biggest loser of the week.
The data indicates that PENDLE started the week at around $5 and initially attempted some slight gains.
However, it soon succumbed to a downward trend and remained in decline throughout the week, ultimately closing at approximately $4.
As the new week begins, PENDLE’s price has decreased to around $3.8.
Despite this continued price decline, there has been a somewhat unexpected development in its market valuation; the market cap has risen slightly, now exceeding $592 million, showing an increase of over 1% in the last 24 hours.
Trading volume for PENDLE stands at around $65 million, which has decreased by almost 10%.
Fantom (FTM)
Analysis of Fantom (FTM) on a daily time frame indicated that it began positively during the past week. It traded at around $0.58, with an 8.80% increase.
However, the asset faced significant setbacks on 3rd and 4th July, experiencing declines of 14.71% and 11.53%, respectively, which brought its price down to approximately $0.44.
Toward the end of the week, FTM managed a modest recovery with a 6.41% increase, pushing its price to around $0.45. However, more was needed to offset the earlier losses.
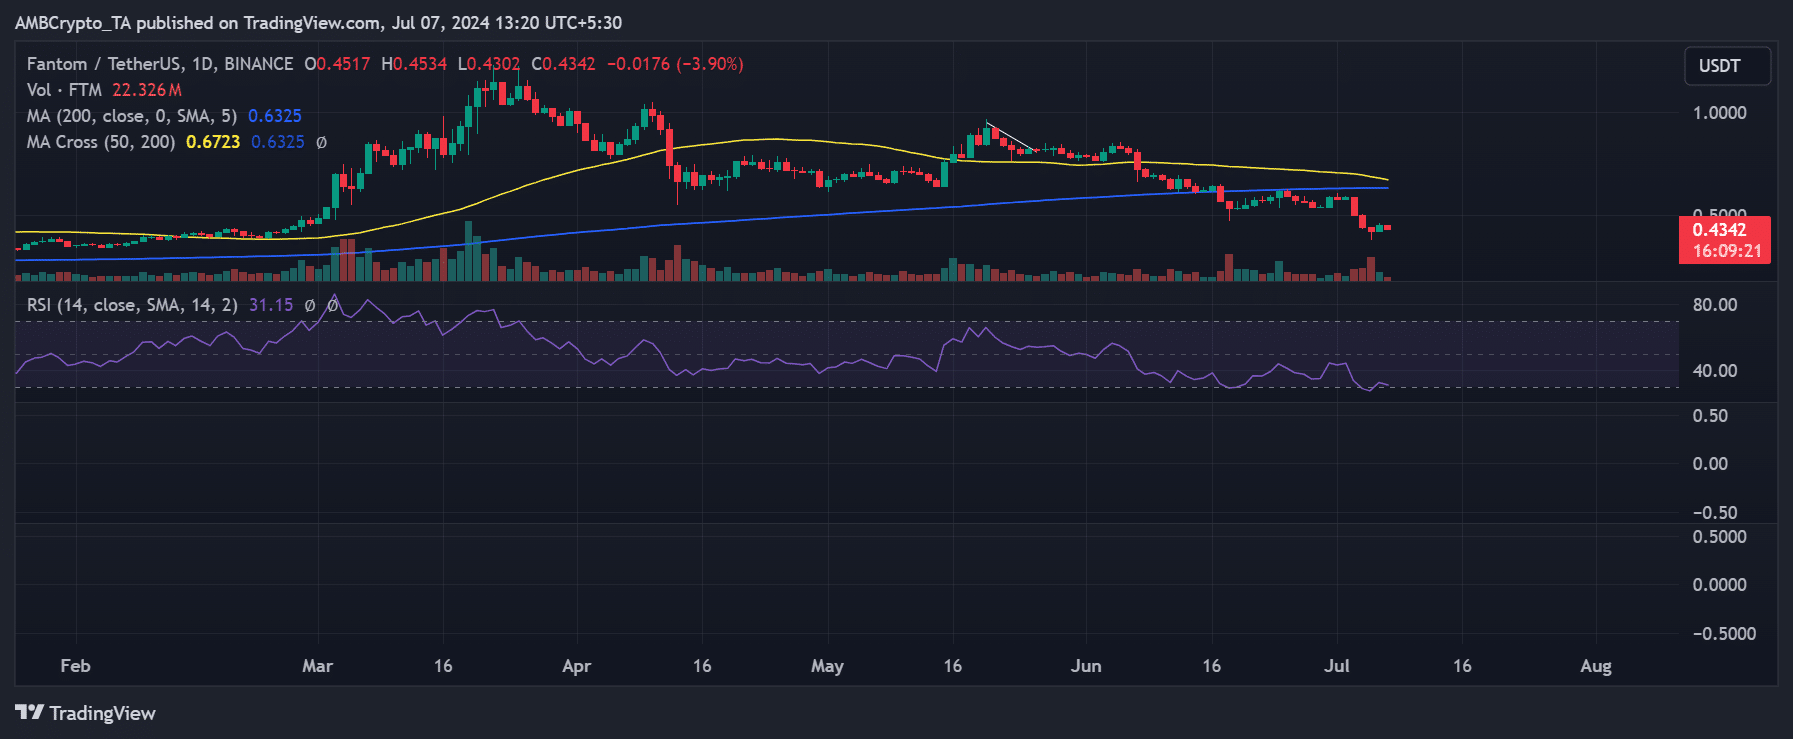
According to CoinMarketCap, these movements resulted in Fantom ending the week as the third-biggest loser, with an overall decline of 20.95%.
Its market capitalization stood at around $1.2 billion, reflecting a downturn in value. Furthermore, the trading volume also decreased, totaling about $118.6 million, indicating reduced trading activity.