Crypto week ahead: Will Bitcoin, Ethereum hit new highs?
Bitcoin and Ethereum began rallies last week, but the trend might change soon.

- Bitcoin has appreciated by over 4% in the last seven days.
- Most market indicators hinted at a price correction soon.
Bitcoin [BTC] and Ethereum [ETH] displayed bullish performance over the last seven days as their weekly charts were green. Here’s a detailed look at the top two coins to find out how the crypto week ahead would be.
Bitcoin and Ethereum’s target
According to CoinMakrtetCap, BTC’s price increased by over 3% in the last seven days. Likewise, the king of altcoins also witnessed a 2% price rise.
At the time of writing, BTC was trading at $64k while ETH was trading at $3.5k. AMBCrypto’s analysis of Glassnode’s data revealed that BTC was trading way below its market top. As per the data, BTC’s possible market top was around $97k.
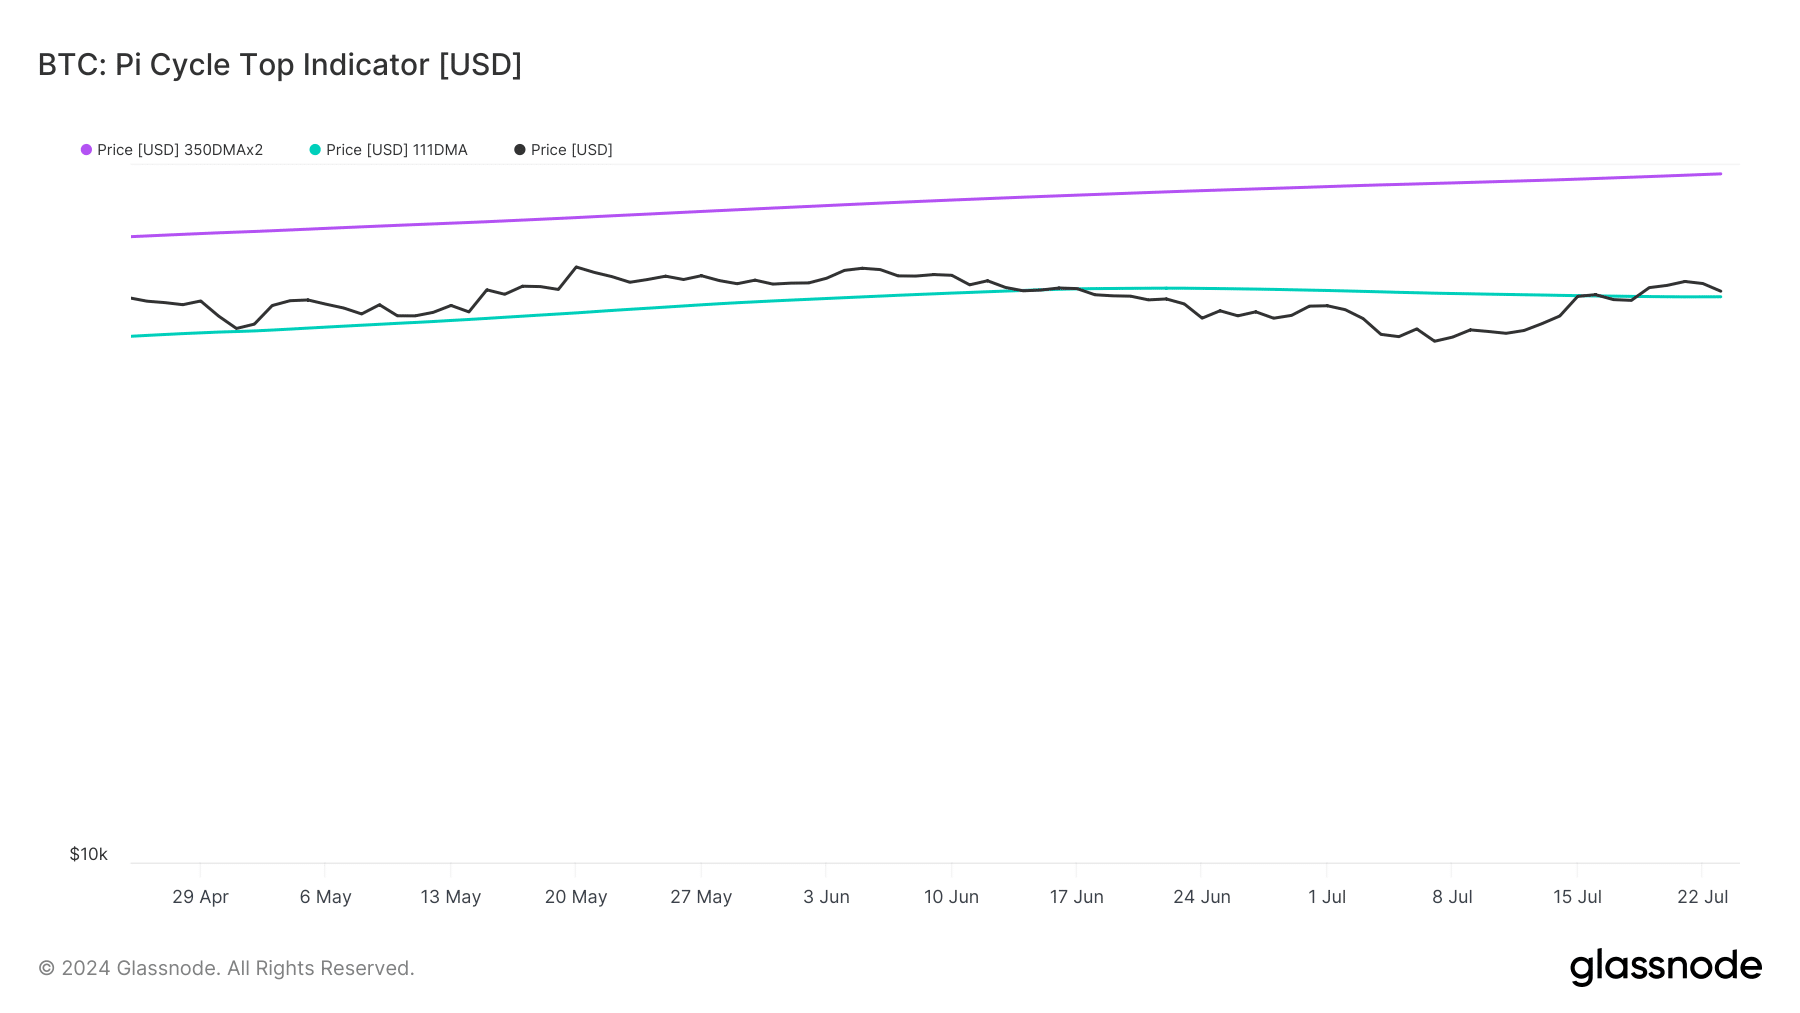
Meanwhile, Ethereum’s price somewhat gained bearish momentum as its price was touching the market bottom. As per the Pi cycle top indicator, ETH’s price might hit a market top at $5.2k.
If the week ahead goes bullish, then these two top tokens might reach their targets.
What to expect from BTC and ETH
AMBCrypto then planed to have a look at both of these coins’ metrics to better understand whether the upcoming week will be bullish or bearish.
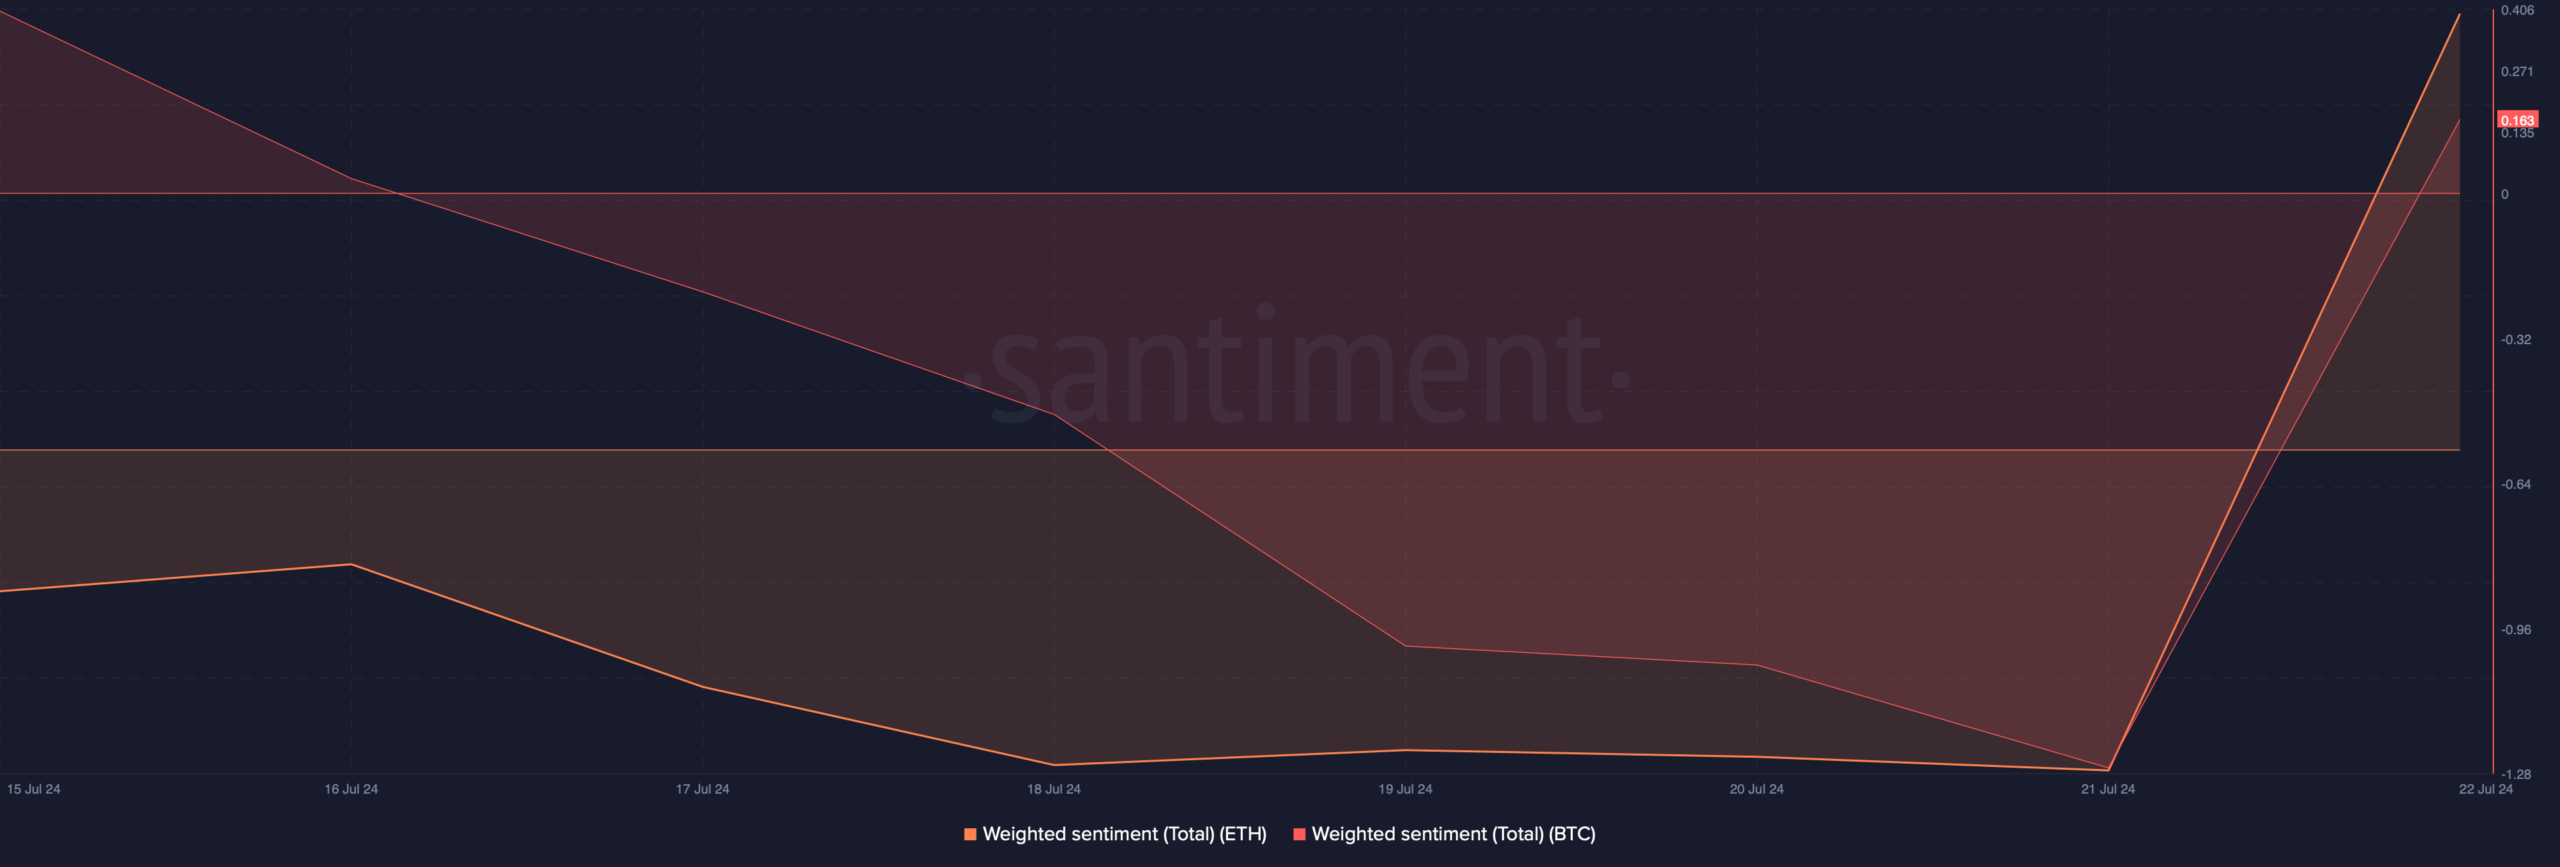
As per our analysis of Santiment’s data, sentiment around BTC and ETH turned bullish. Both the tokens’ weighted sentiments went into the positive zone, meaning that bullish sentiments were dominant in the market.
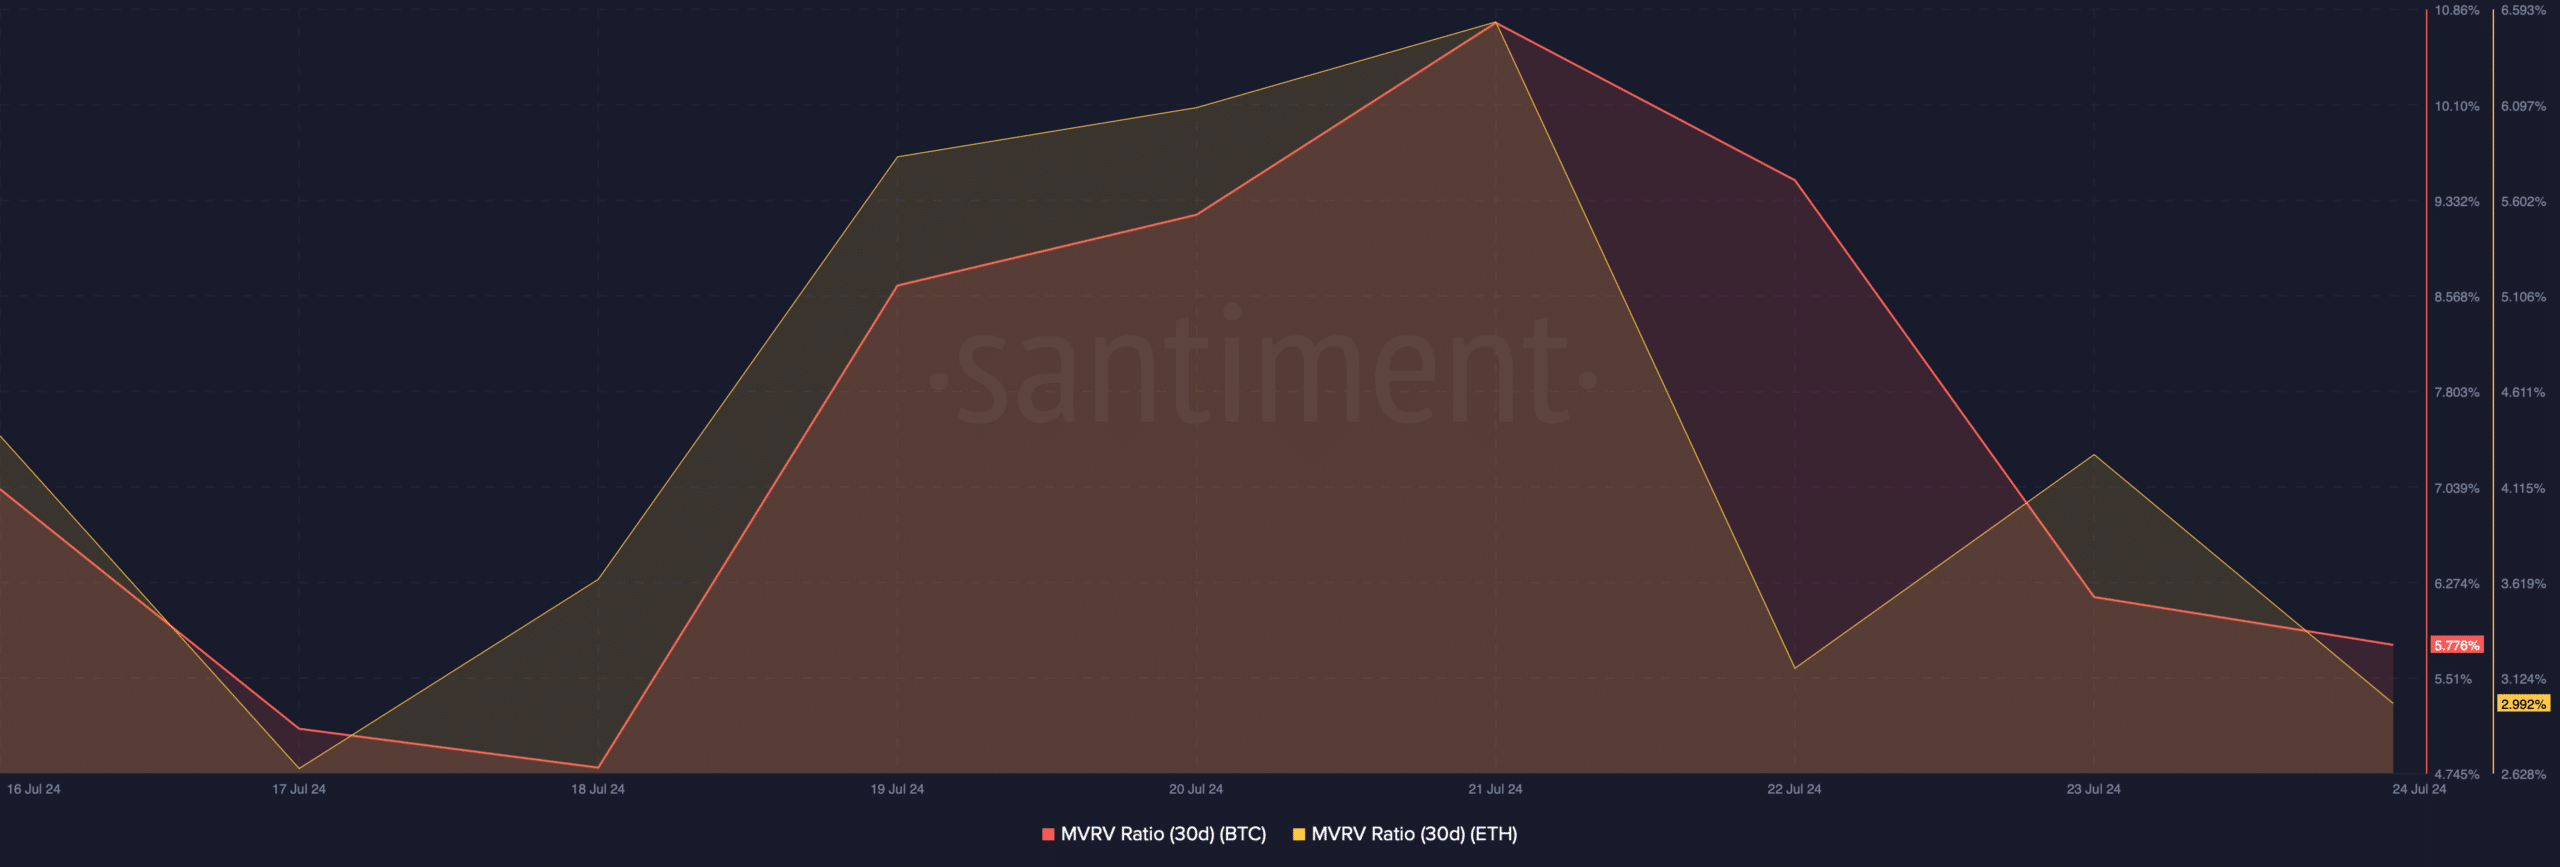
Another bullish signal was the MVRV ratio, as it registered an uptick over the last seven days. It indicates that the chances of a bull rally are high.
Let’s have a look at the daily charts of BTC and ETH to better understand what to expect from them in the coming days.
BTC and ETH price chart analysis
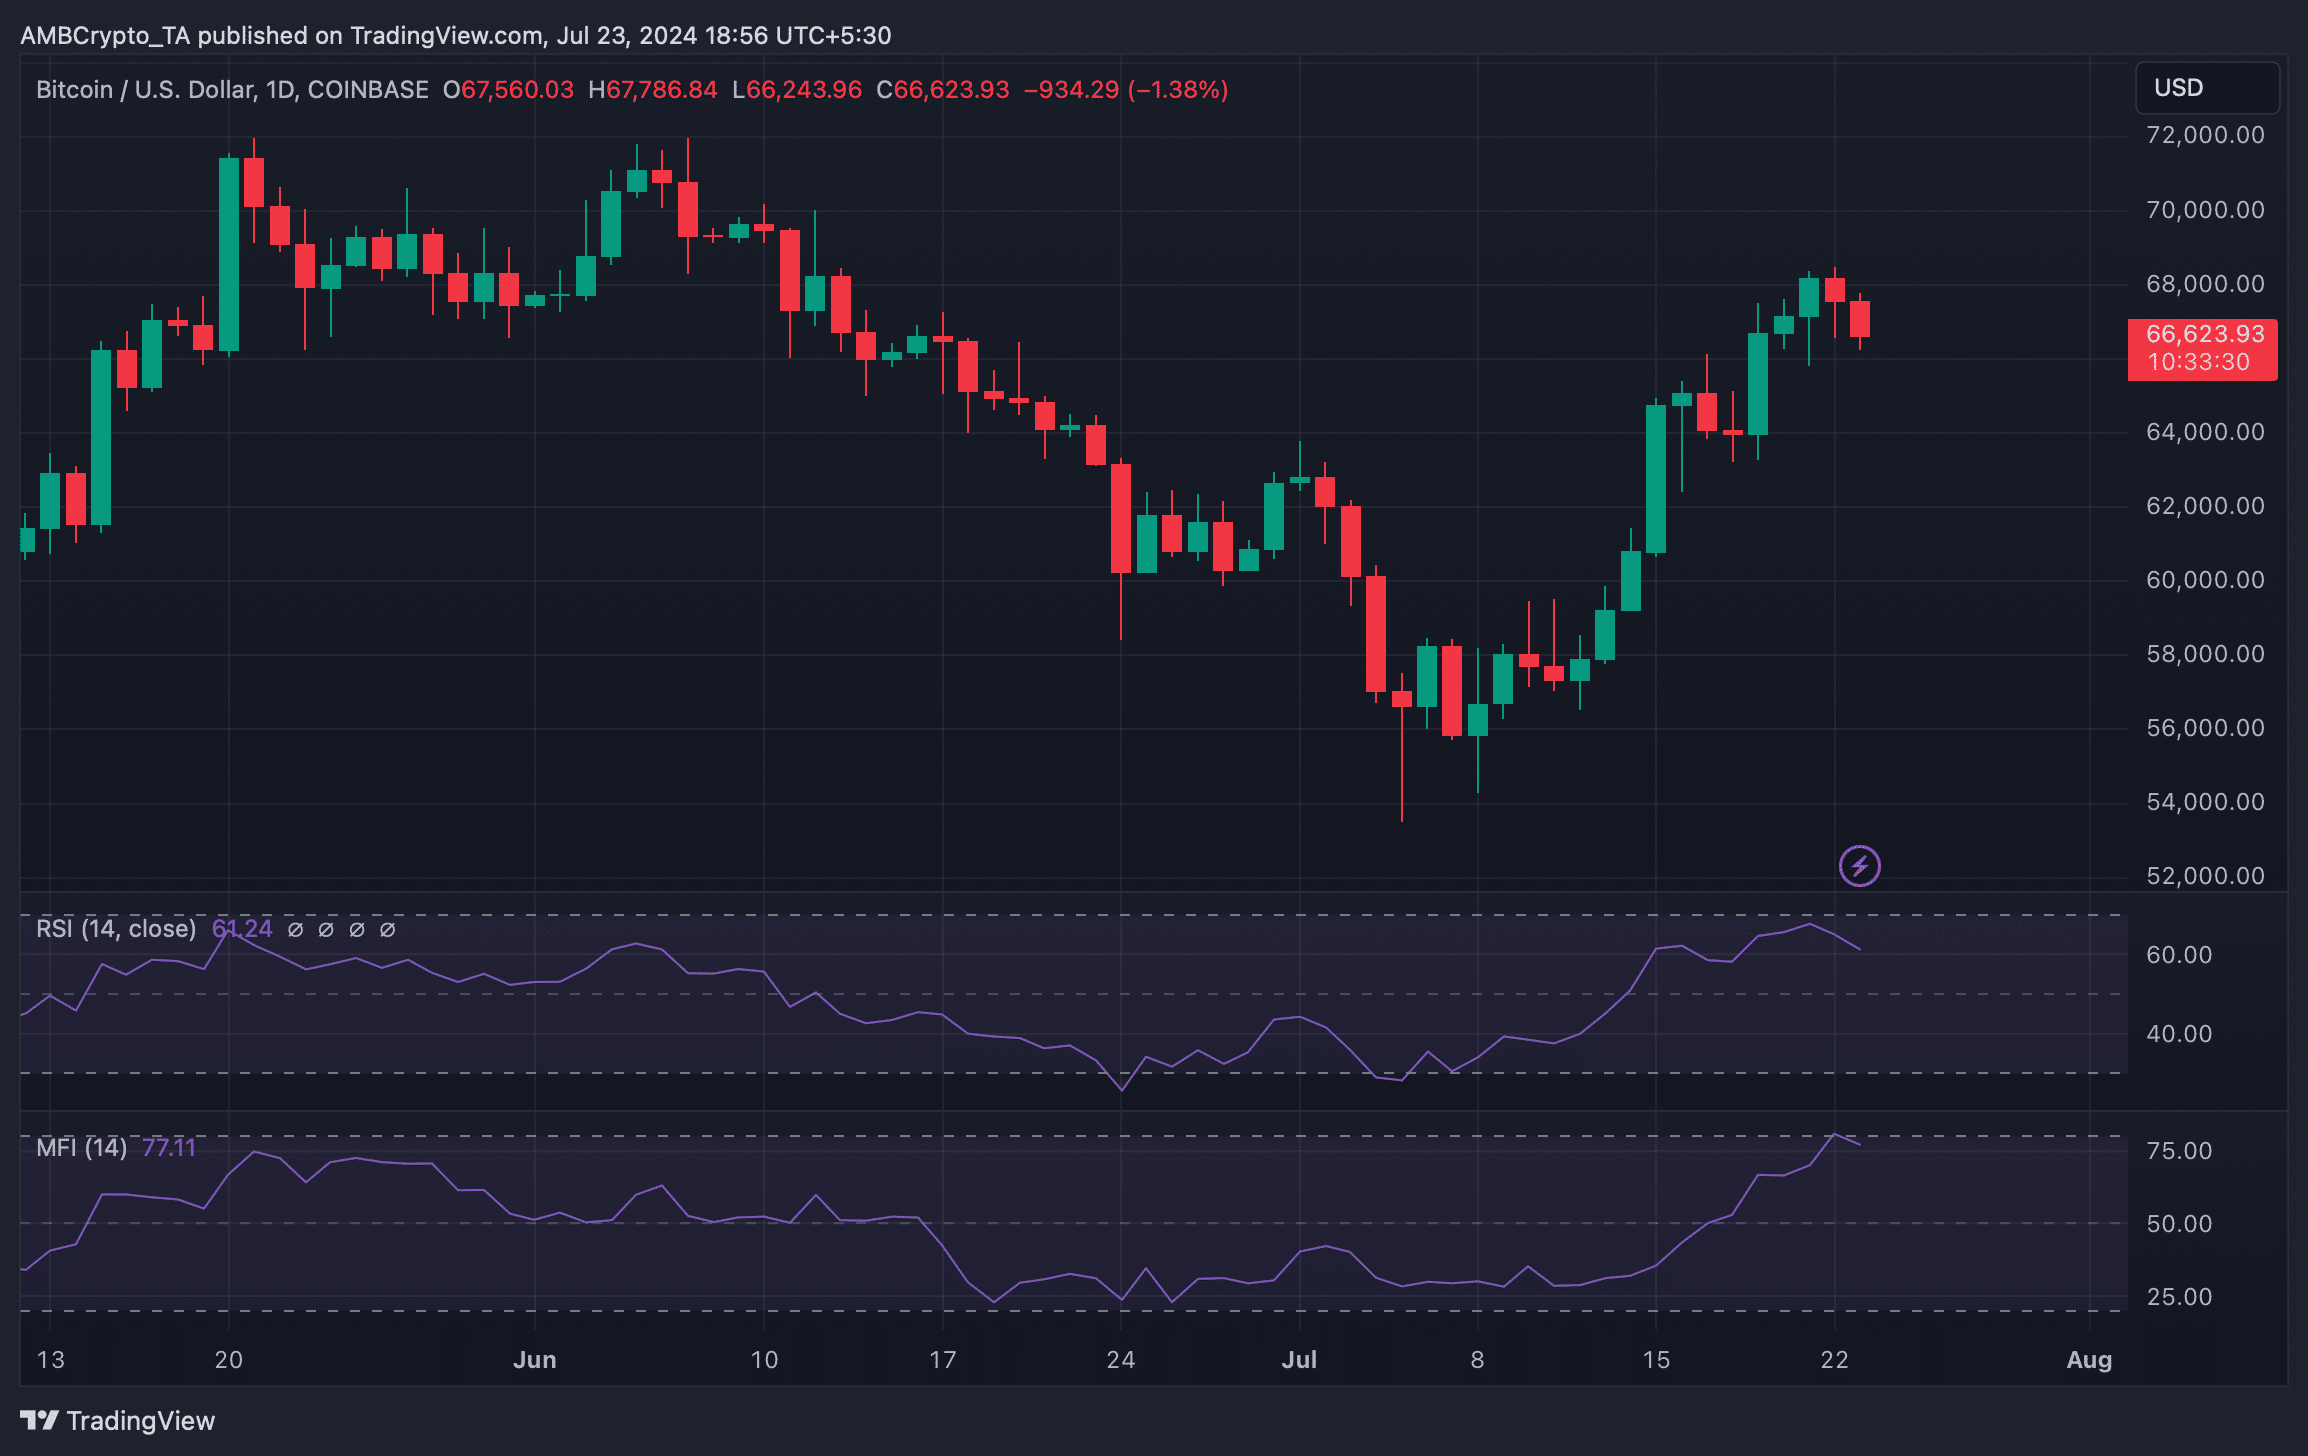
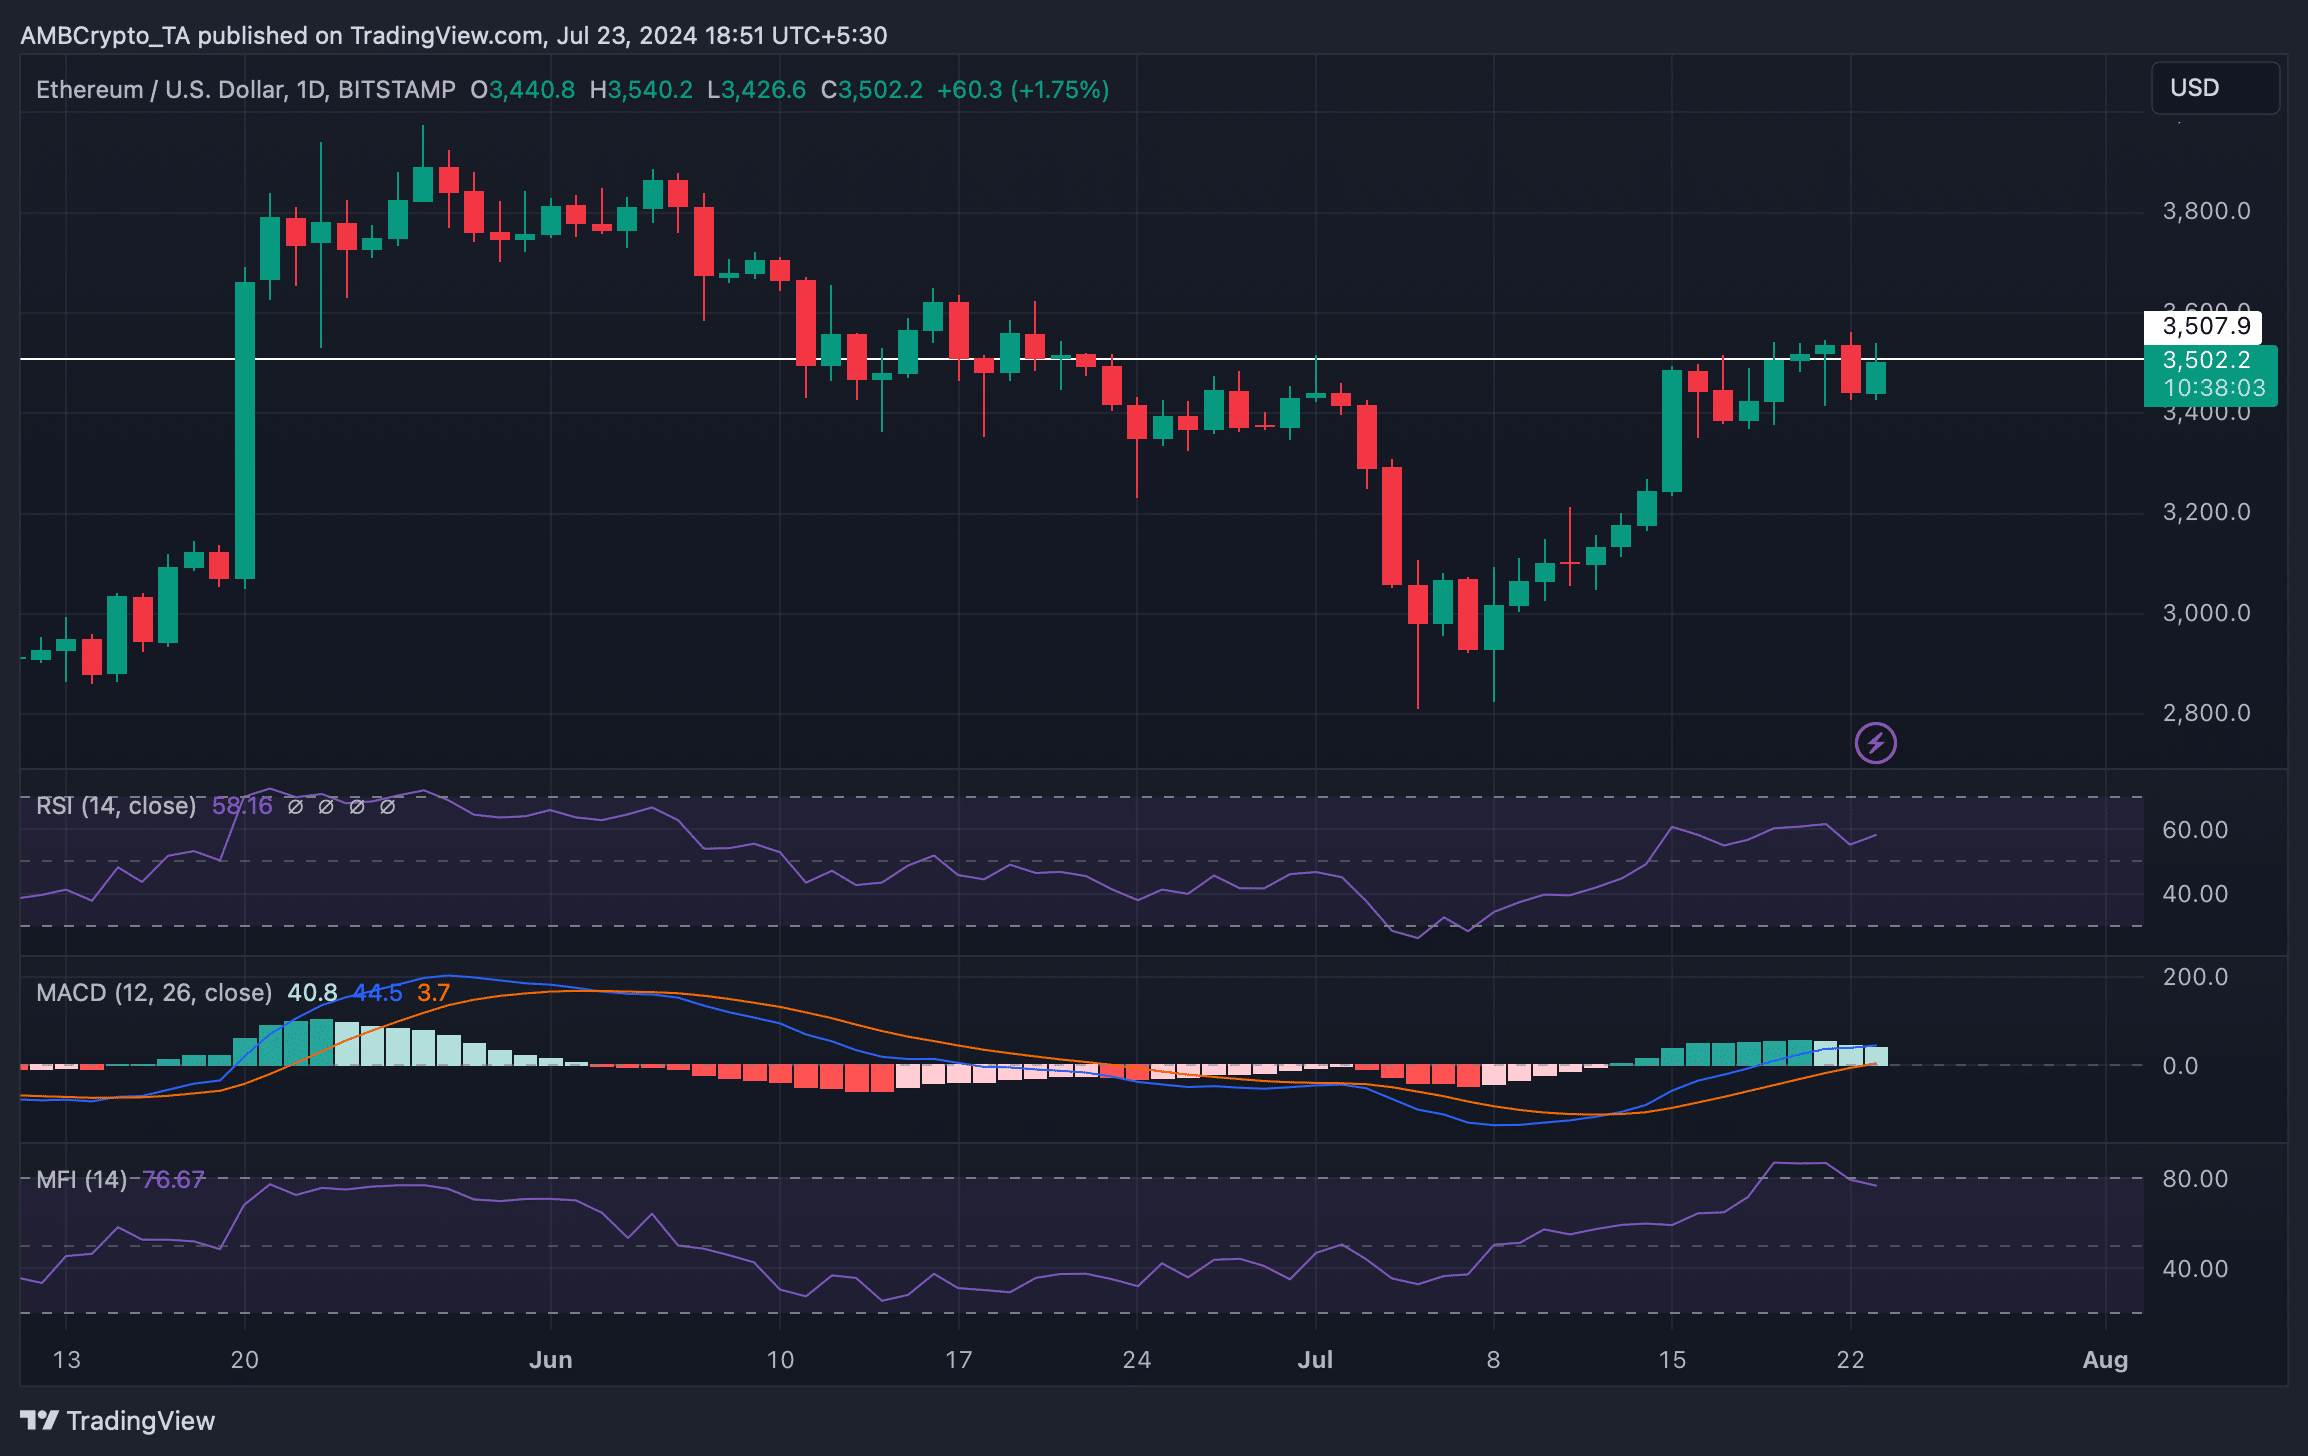
As per our analysis, the MACD displayed a bullish advantage in the market for ETH. However, the rest of the market indicators were bearish.
For instance,, the Relative Strength Index (RSI) and the Money Flow Index (MFI) were both about to enter the overbought zone. This might increase selling pressure on ETH and, in turn, might push the coin’s price down.
Read Bitcoin’s [BTC] Price Prediction 2024-25
A similar situation was also noted on BTC’s charts. Both BTC’s Relative Strength Index (RSI) and Money Flow Index (MFI) registered downticks.
This meant the upcoming week might be bearish for top cryptos like ETH and BTC.