
Disclaimer: The findings of the following analysis are the sole opinions of the writer and should not be considered investment advice
Decentraland is one of the largest metaverse projects in the crypto ecosystem, but its token MANA has been on a steady downtrend in recent weeks. After a brief foray beneath the $0.72 support, the price has rallied by an impressive 80%. However, this rally might be near its end, and rejection at a resistance zone could occur over the next day or two for the crypto asset.
MANA- 1 Hour Chart
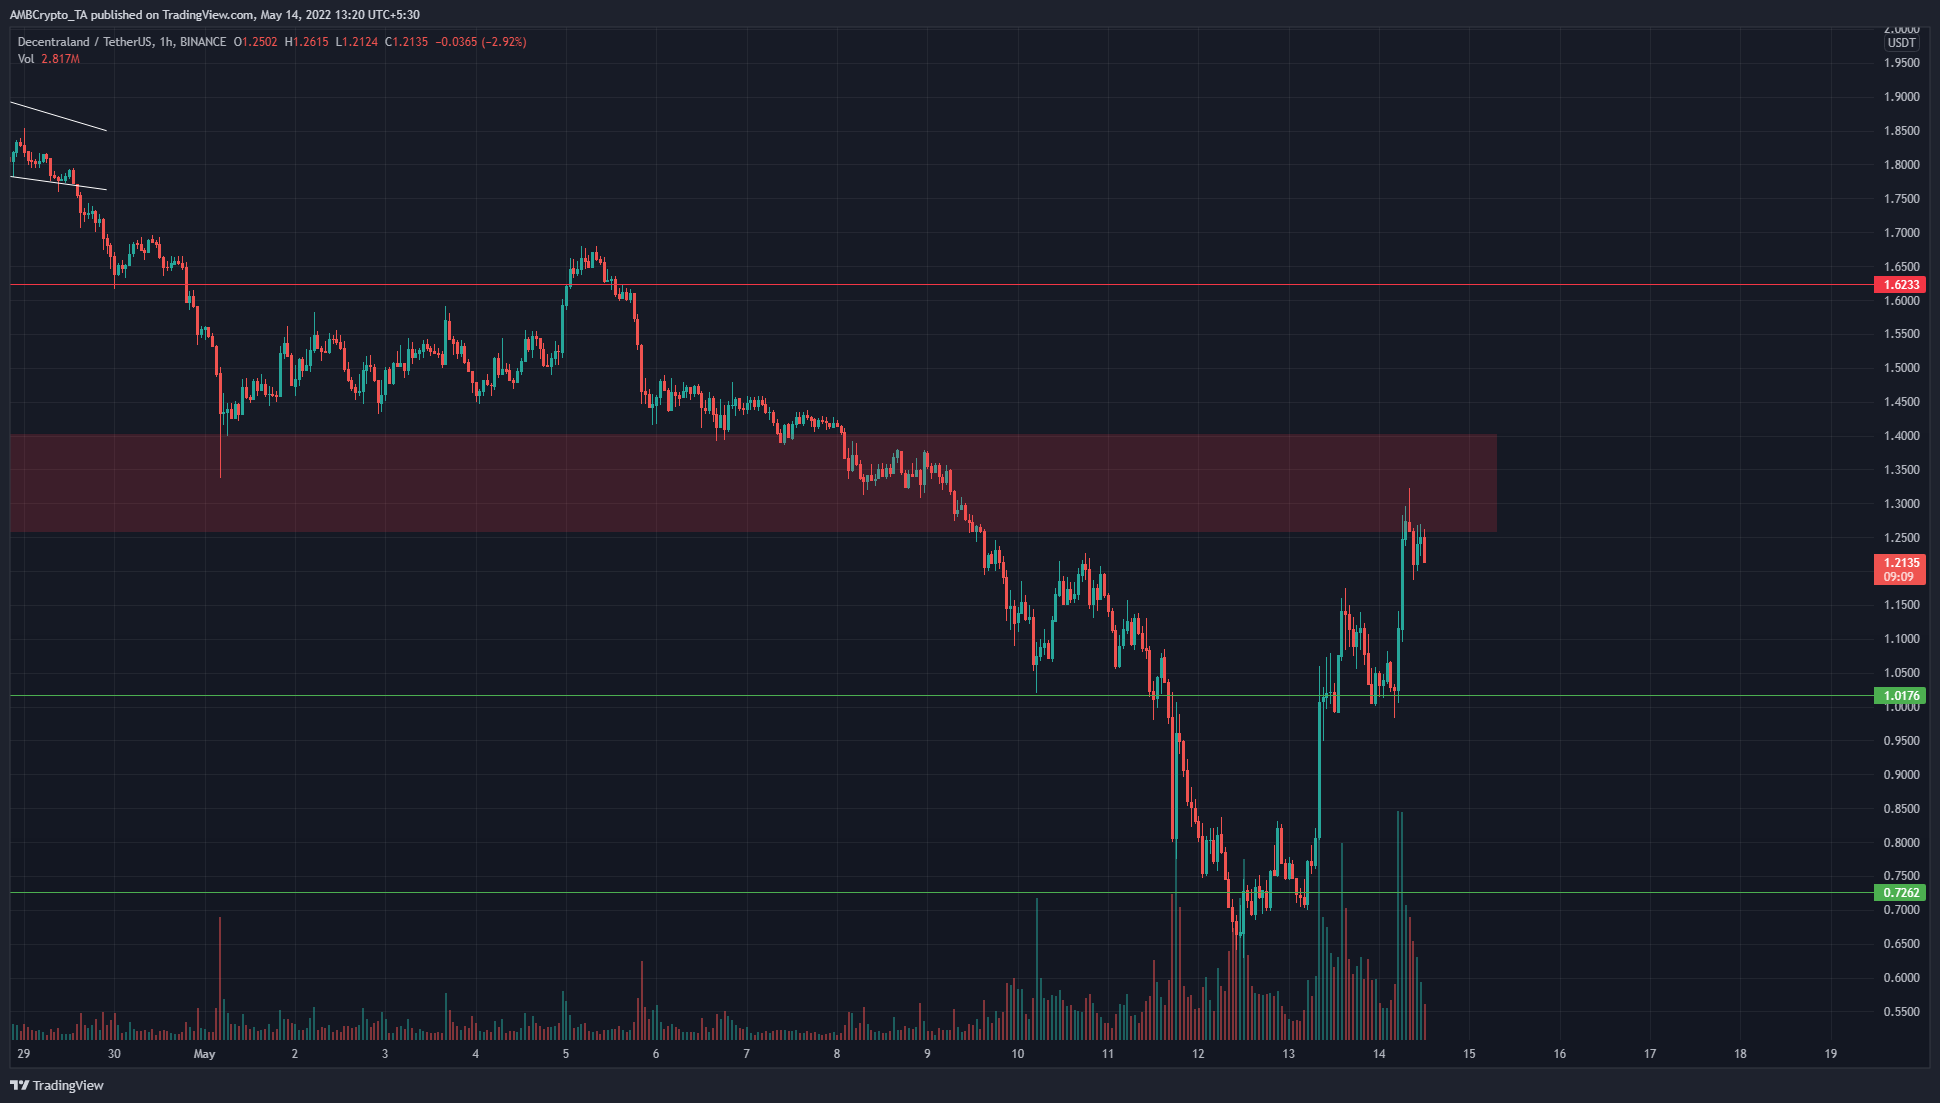
Source: MANA/USDT on TradingView
The $1.25-$1.35 area (red box) is a higher time frame zone of supply for MANA, which had acted as a demand zone earlier this month. Even though MANA has seen a huge rally in the past couple of days, its longer-term market structure remains bearish.
The last time that MANA traded beneath the $1.3 mark was in October 2021. The fact that sellers have been successful in pushing prices beneath this area shows there is likely no easy path to recovery in the weeks to come, and further downside can not be discounted in the weeks to come.
On the lower timeframes, there is strong evidence that heavy buying volume drove MANA to the $1.3 zone. However, this does not represent a buying opportunity, but instead, offered an opportunity to sell or short the asset.
Rationale
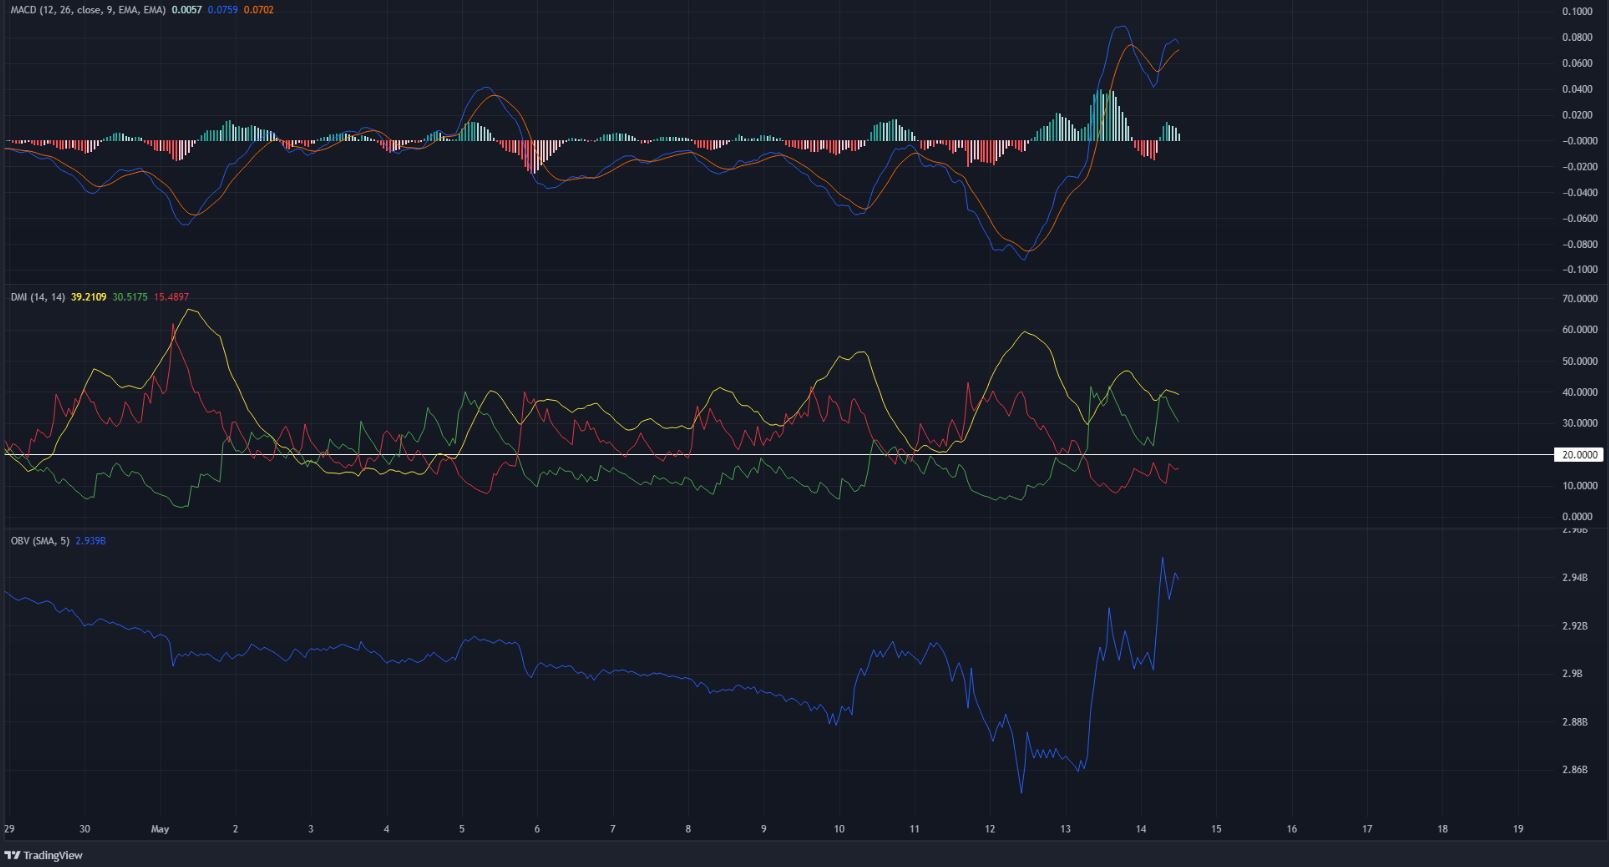
Source: MANA/USDT on TradingView
The MACD was well above the zero line, and the MACD line (blue) was above the signal line (orange) to denote a strong buy signal. However, in the past 24 hours, the MACD made a lower high even as the price made a higher high. This is a bearish divergence, and its importance is enhanced as it occurred right beneath a zone of supply.
The DMI showed a strong bullish trend in progress after the nearly 80% pump from the $0.7 lows a couple of days ago. Similarly, the OBV also spiked upward and has broken the prior downtrend.
Conclusion
The indicators showed strong bullish momentum and demand behind MANA, but a bearish divergence also suggested that a pullback could occur. Such a pullback could see MANA retest the $1 support level. Based on Bitcoin’s direction, the token could either drop further beneath $1 or, alternatively, find more demand and rally toward $1.3 once again.