Decentraland [MANA] short-term traders can look to buy at…
![Decentraland [MANA] short-term traders can look to buy at...](https://ambcrypto.com/wp-content/uploads/2023/03/PP-3-MANA-cover-e1679227072192.jpeg)
Disclaimer: The information presented does not constitute financial, investment, trading, or other types of advice and is solely the writer’s opinion.
- The drop below $0.62 meant the structure was bearish.
- The Fibonacci levels showed that MANA investors can keep an eye on the $0.4-$0.5 region.
Decentraland performed extraordinarily well in 2023. Its native token saw a sharp retracement in February and March on the price charts.
The $0.623 level of support was breached on 3 March, but the gains of the past week meant the same level has been flipped to support once more.
Read Decentraland’s [MANA] Price Prediction 2023-24
At the time of writing, MANA showed a likelihood of a move toward $0.7. Even though its market structure was bearish on the daily timeframe, the bulls had a fighting chance, provided Bitcoin does not see a sharp drop.
The 61.8% retracement meant bulls have a strong chance of more gains
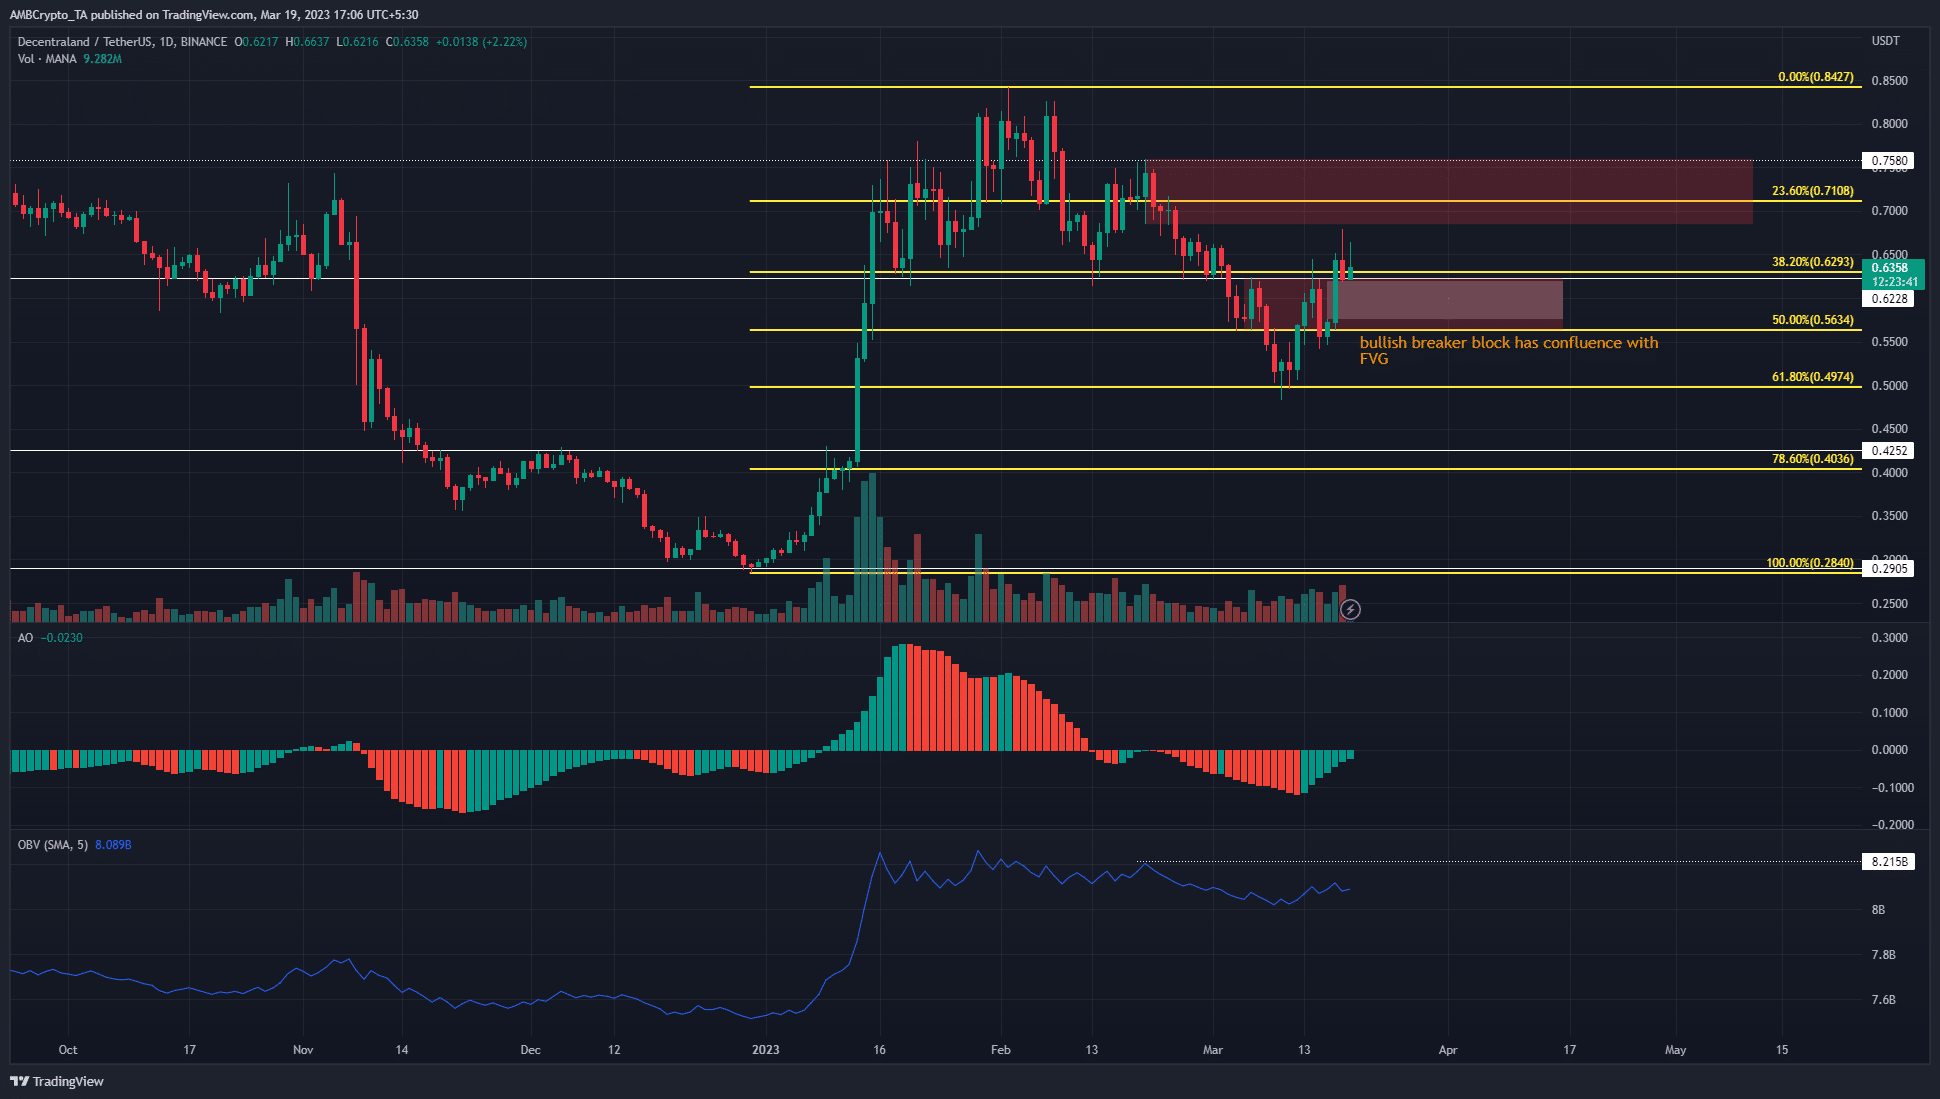
The early 2023 pump from $0.29 to $0.84 in early February represented gains of close to 195% in under six weeks. This broke the downtrend that Decentraland has been on since last August and flipped the structure to bullish.
The Fibonacci retracement levels showed that, even though the retracement was deep in recent weeks, the 61.8%-78.6% golden pocket remained as support. Hence there was a chance that MANA could continue to trend higher like it did earlier this year.
The Awesome Oscillator showed bearish momentum, but the green bars on the histogram indicated weakening bearishness. Meanwhile, the OBV was also in a downtrend and has not breached its lower high. This was in line with the bearish market structure.
Is your portfolio green? Check the MANA Profit Calculator
The fair value gap highlighted in white on the daily chart coincided with the bullish breaker (red) at the $0.6 region. It was likely that a drop into this region would provide a move higher toward the bearish order block at $0.71.
The advancing mean coin age suggested a rally could be in sight
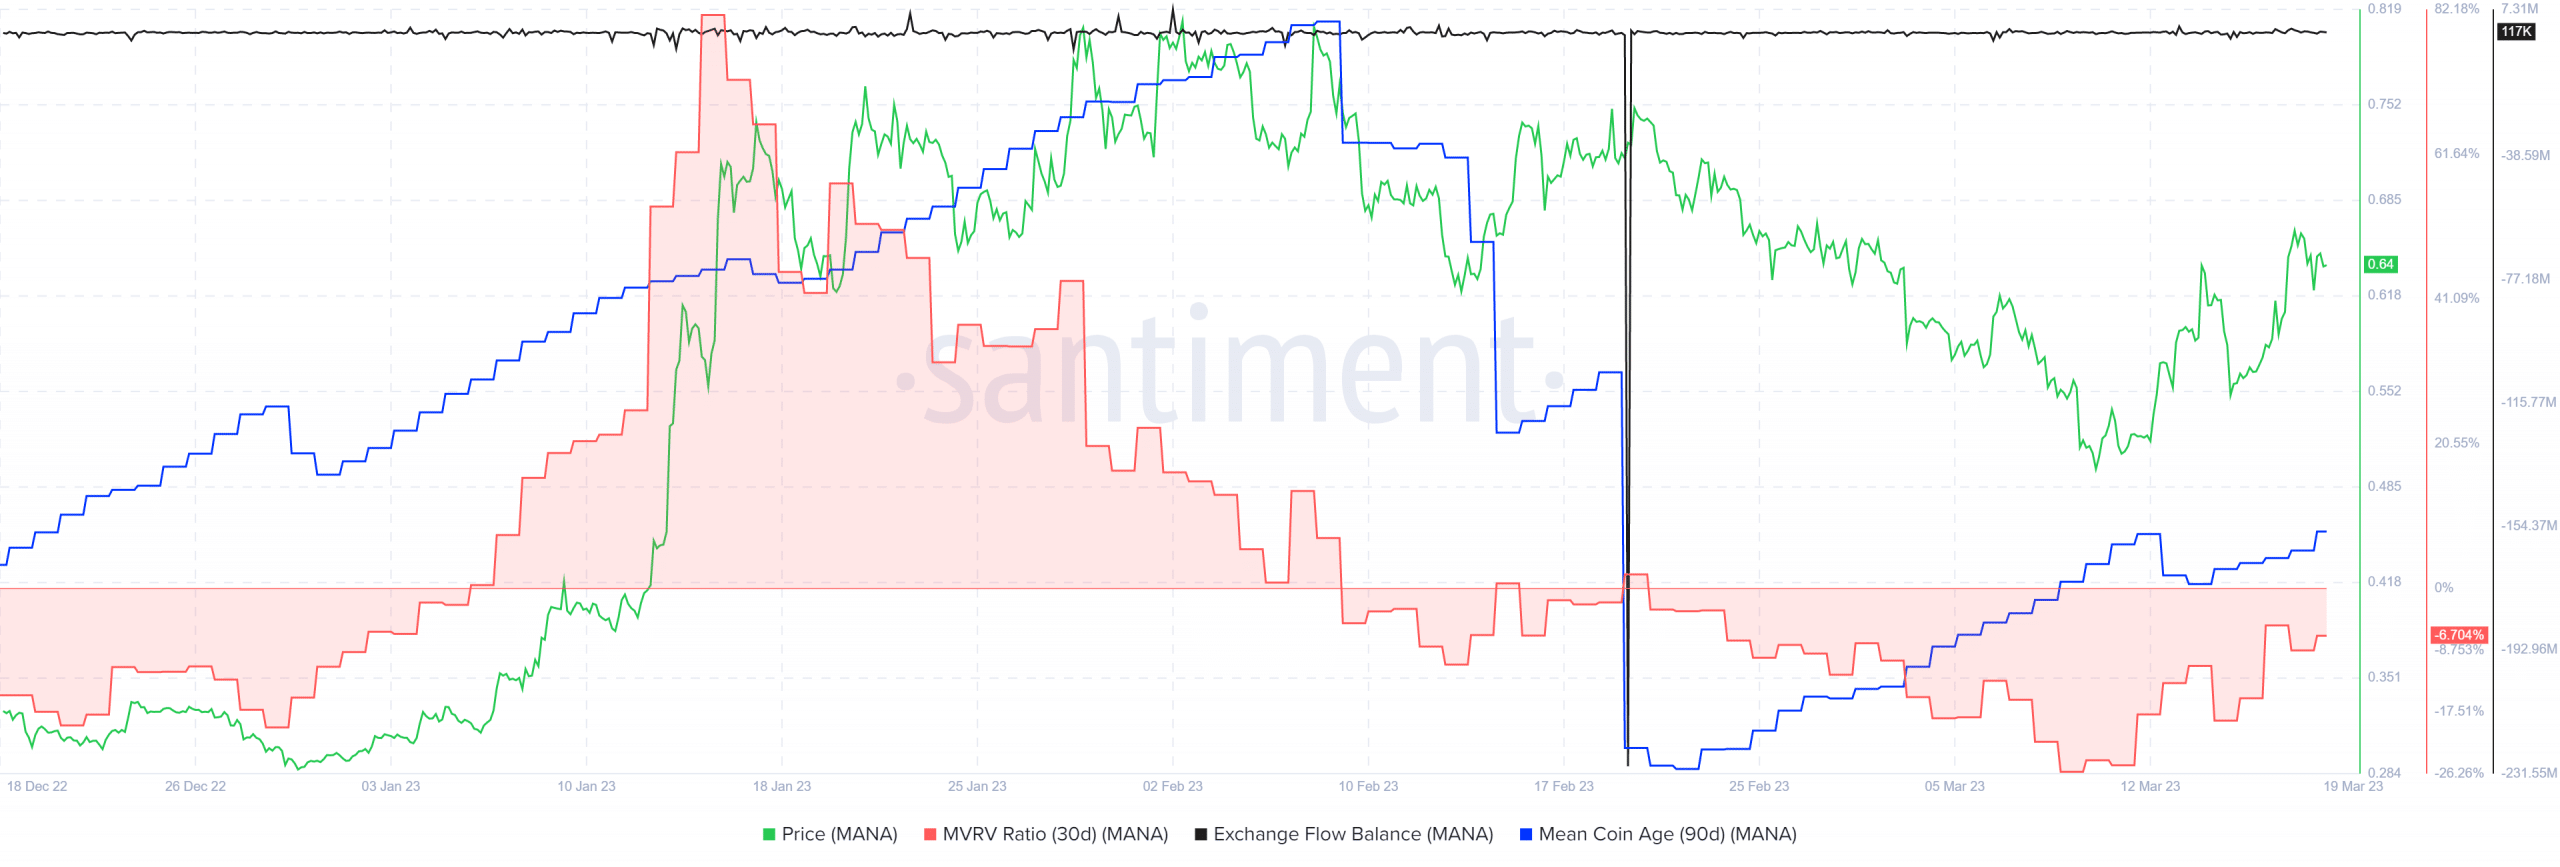
The 30-day MVRV ratio continued to move in the negative territory and has done so since February. This highlighted selling pressure behind the asset in recent weeks.
On the other hand, the 90-day mean coin age has been on the rise. This denoted accumulation across the market. Moreover, there were no large spikes in the exchange flow balance.
The previous plunge was in mid-February when 229.3 million MANA was moved onto exchanges and was accompanied by heavy selling pressure.