Decoding HBAR’s 10% drop after Hedera’s UK institutional move
The UK announcement gave HBAR a longer-term story. Traders still had a shorter-term price to defend.



Hedera [HBAR] joined the UK’s Wholesale Digital Markets Champion Taskforce, strengthening its institutional adoption narrative. Yet the news arrived as HBAR’s rally cooled near $0.10.

At press time, the token traded around $0.090, down approximately 10% over 24 hours. It had rallied earlier from around $0.07219 before meeting resistance near $0.10.
Profit-taking may have contributed to the rejection. For now, the institutional development and the price correction told different stories.
Were HBAR whales buying the dip?
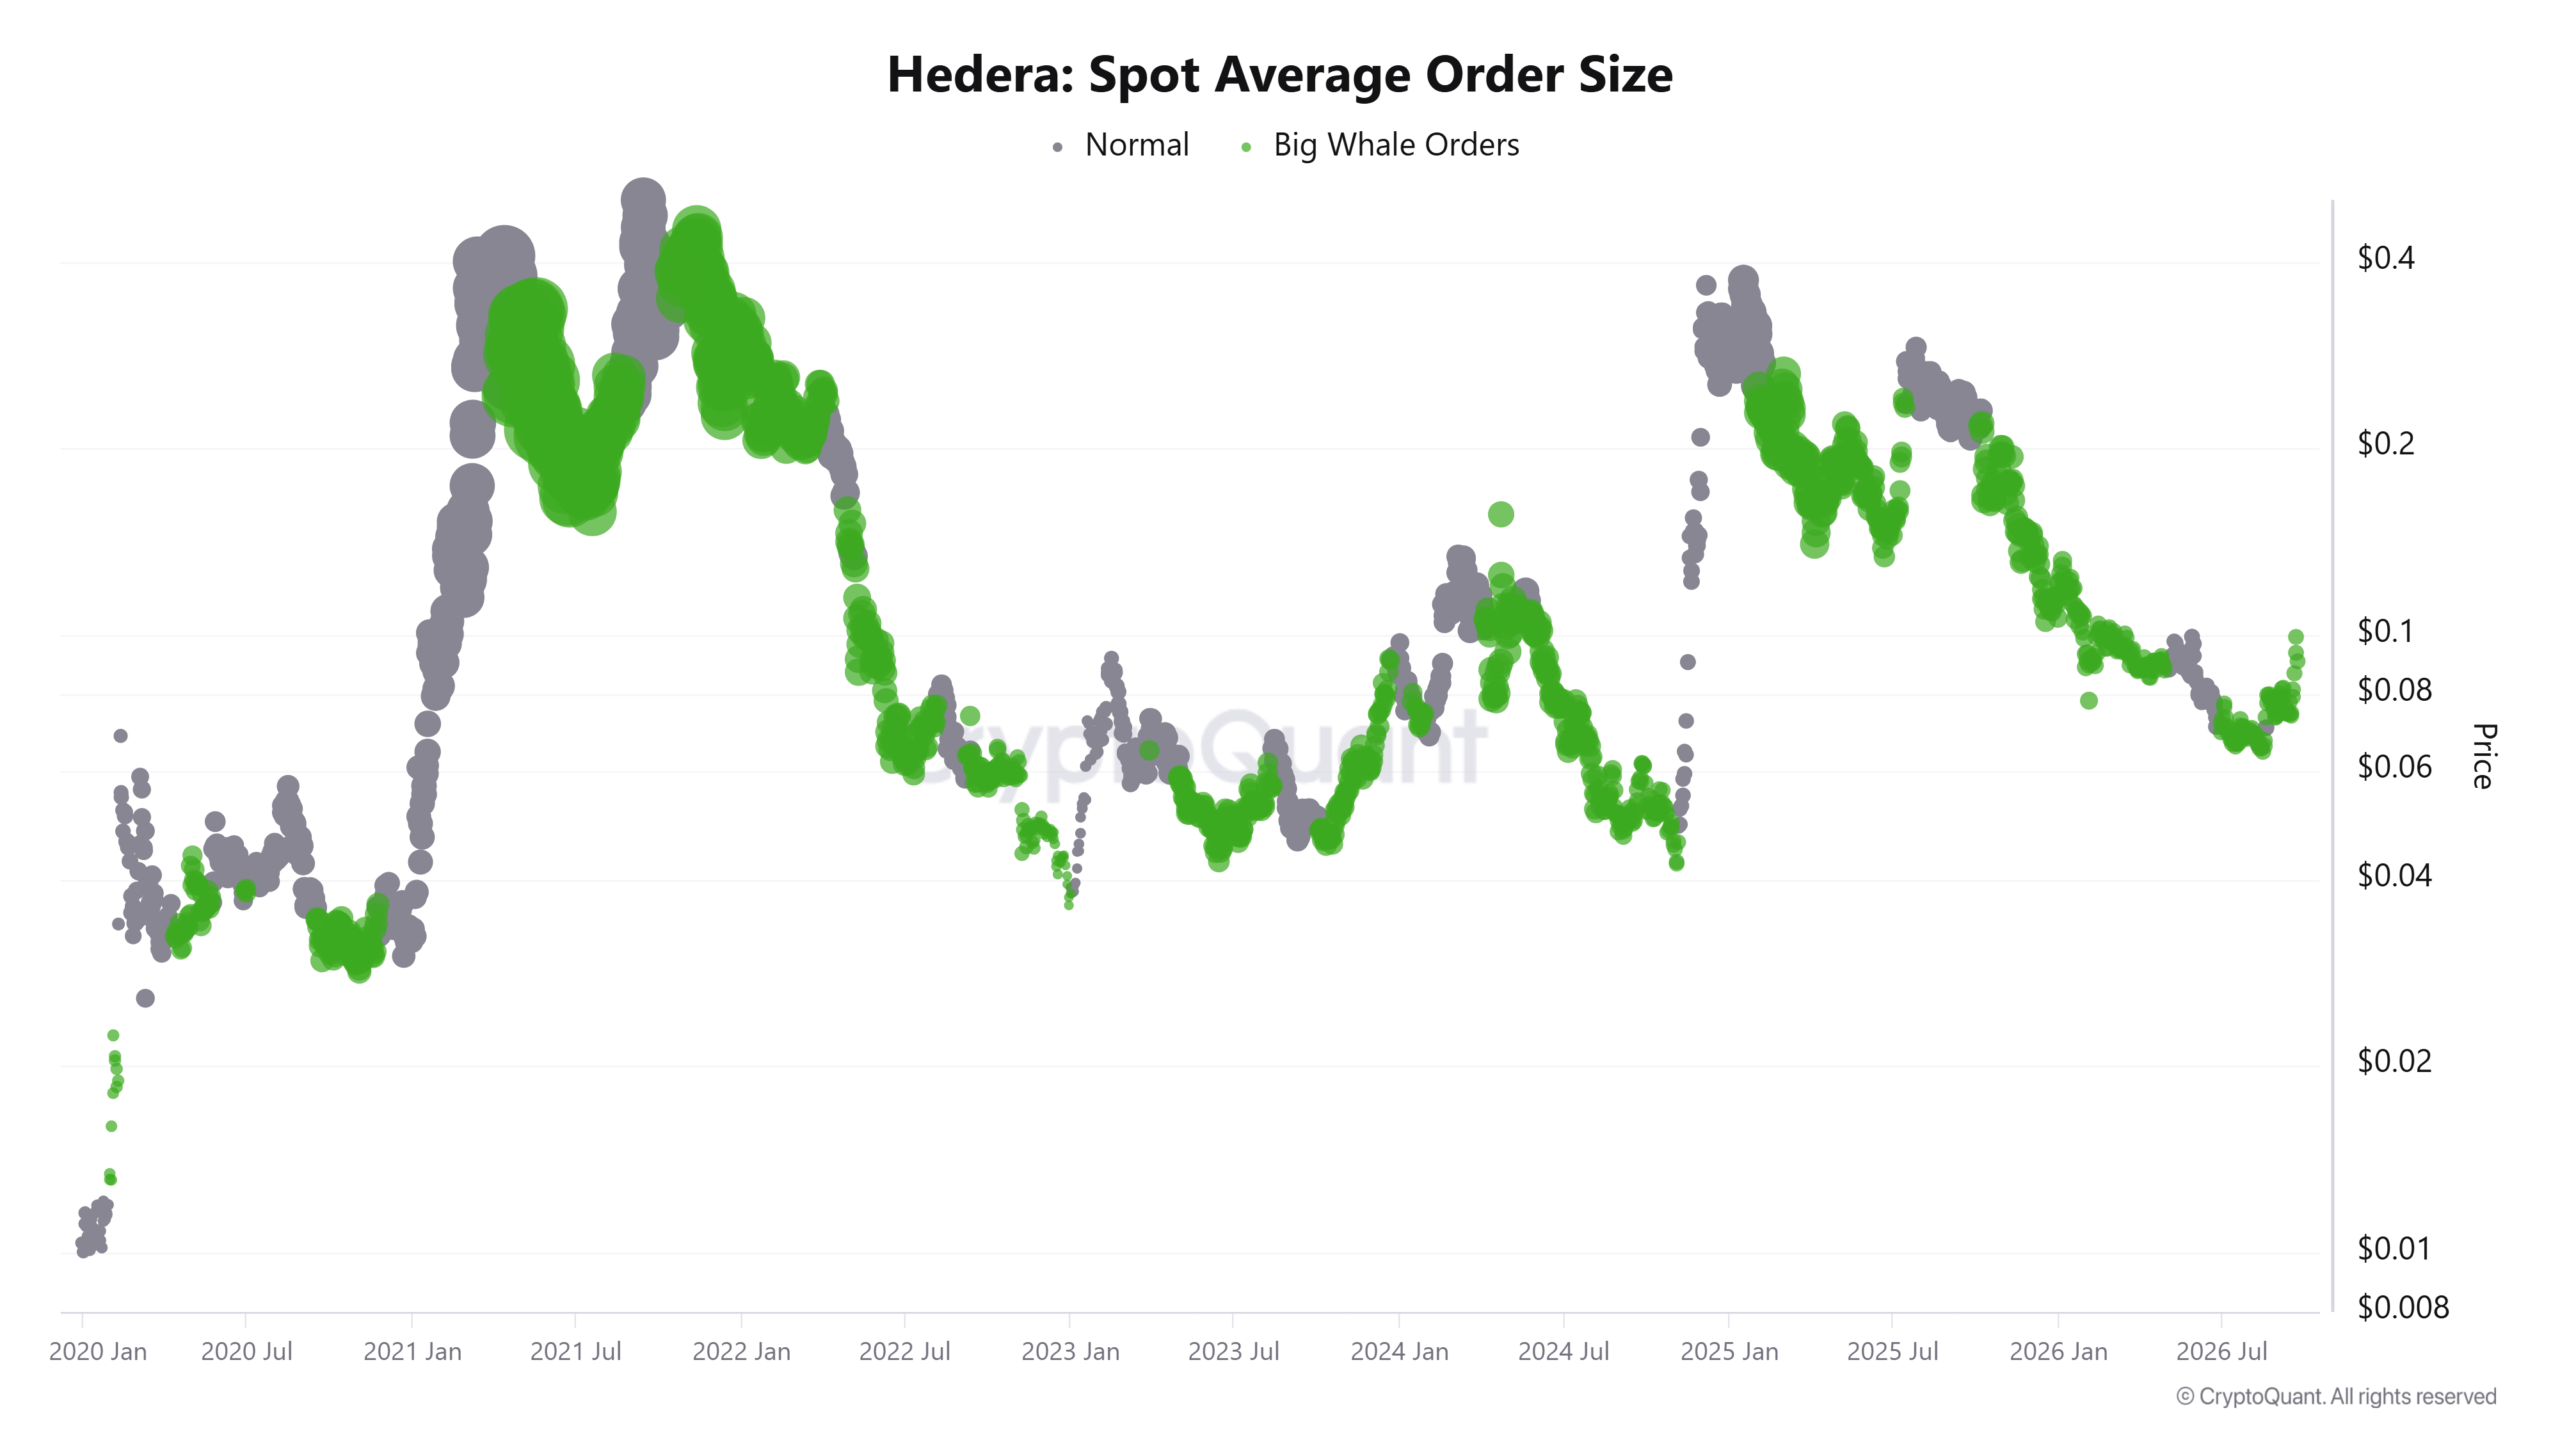
Large traders remained active during HBAR’s correction, although Spot and Futures activity differed.
Spot Average Order Size registered Big Whale Orders. The Spot Volume Bubble Map also entered Overheating territory following the rally.
However, Spot Taker CVD remained Neutral, leaving neither side in clear control of aggressive Spot trading.
Futures Average Order Size registered Big Whale Orders too. Meanwhile, Futures Taker CVD remained Taker Sell Dominant, showing that aggressive sellers continued to challenge the recovery.
Whale-sized orders kept large traders in the picture. Their presence alone, though, did not show whether buyers could defend support.
Could the golden zone reload HBAR?
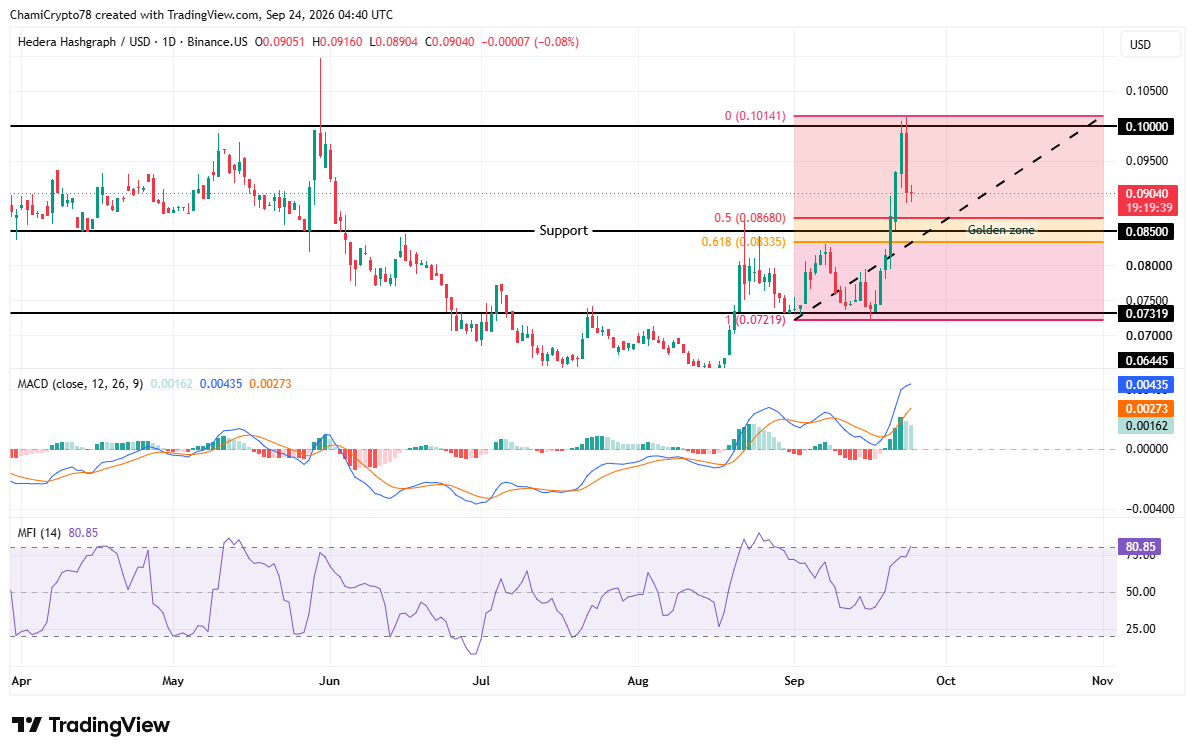
Hedera’s [HBAR] price rejection around the $ 0.10 zone triggered a correction, bringing its Fibonacci retracement structure into focus.
As seen on the daily chart, HBAR price moved towards $0.090, as the 0.5 Fibonacci retracement stood lower at $0.08680.
Notably beneath it, the 0.618 level sat at $0.08335, creating HBAR’s golden zone alongside the 0.5 level.
Notably, a price retracement into this region could introduce a springboard instead of confirming a bearish continuation.
More importantly, the support around the $ 0.085 price level also strengthened the zone as a potential reversal region.
The MACD indicator remained bullish, but the shrinking positive histogram bars suggested fading buying strength following the rally.
The MFI meanwhile had reached 80.85 at reporting time, placing HBAR in overbought territory hence supporting a temporary cooling phase.
Therefore, a strong hold of the golden zone could likely reload demand before challenging the $0.10-supply zone again.
Lower liquidity could complete the reset
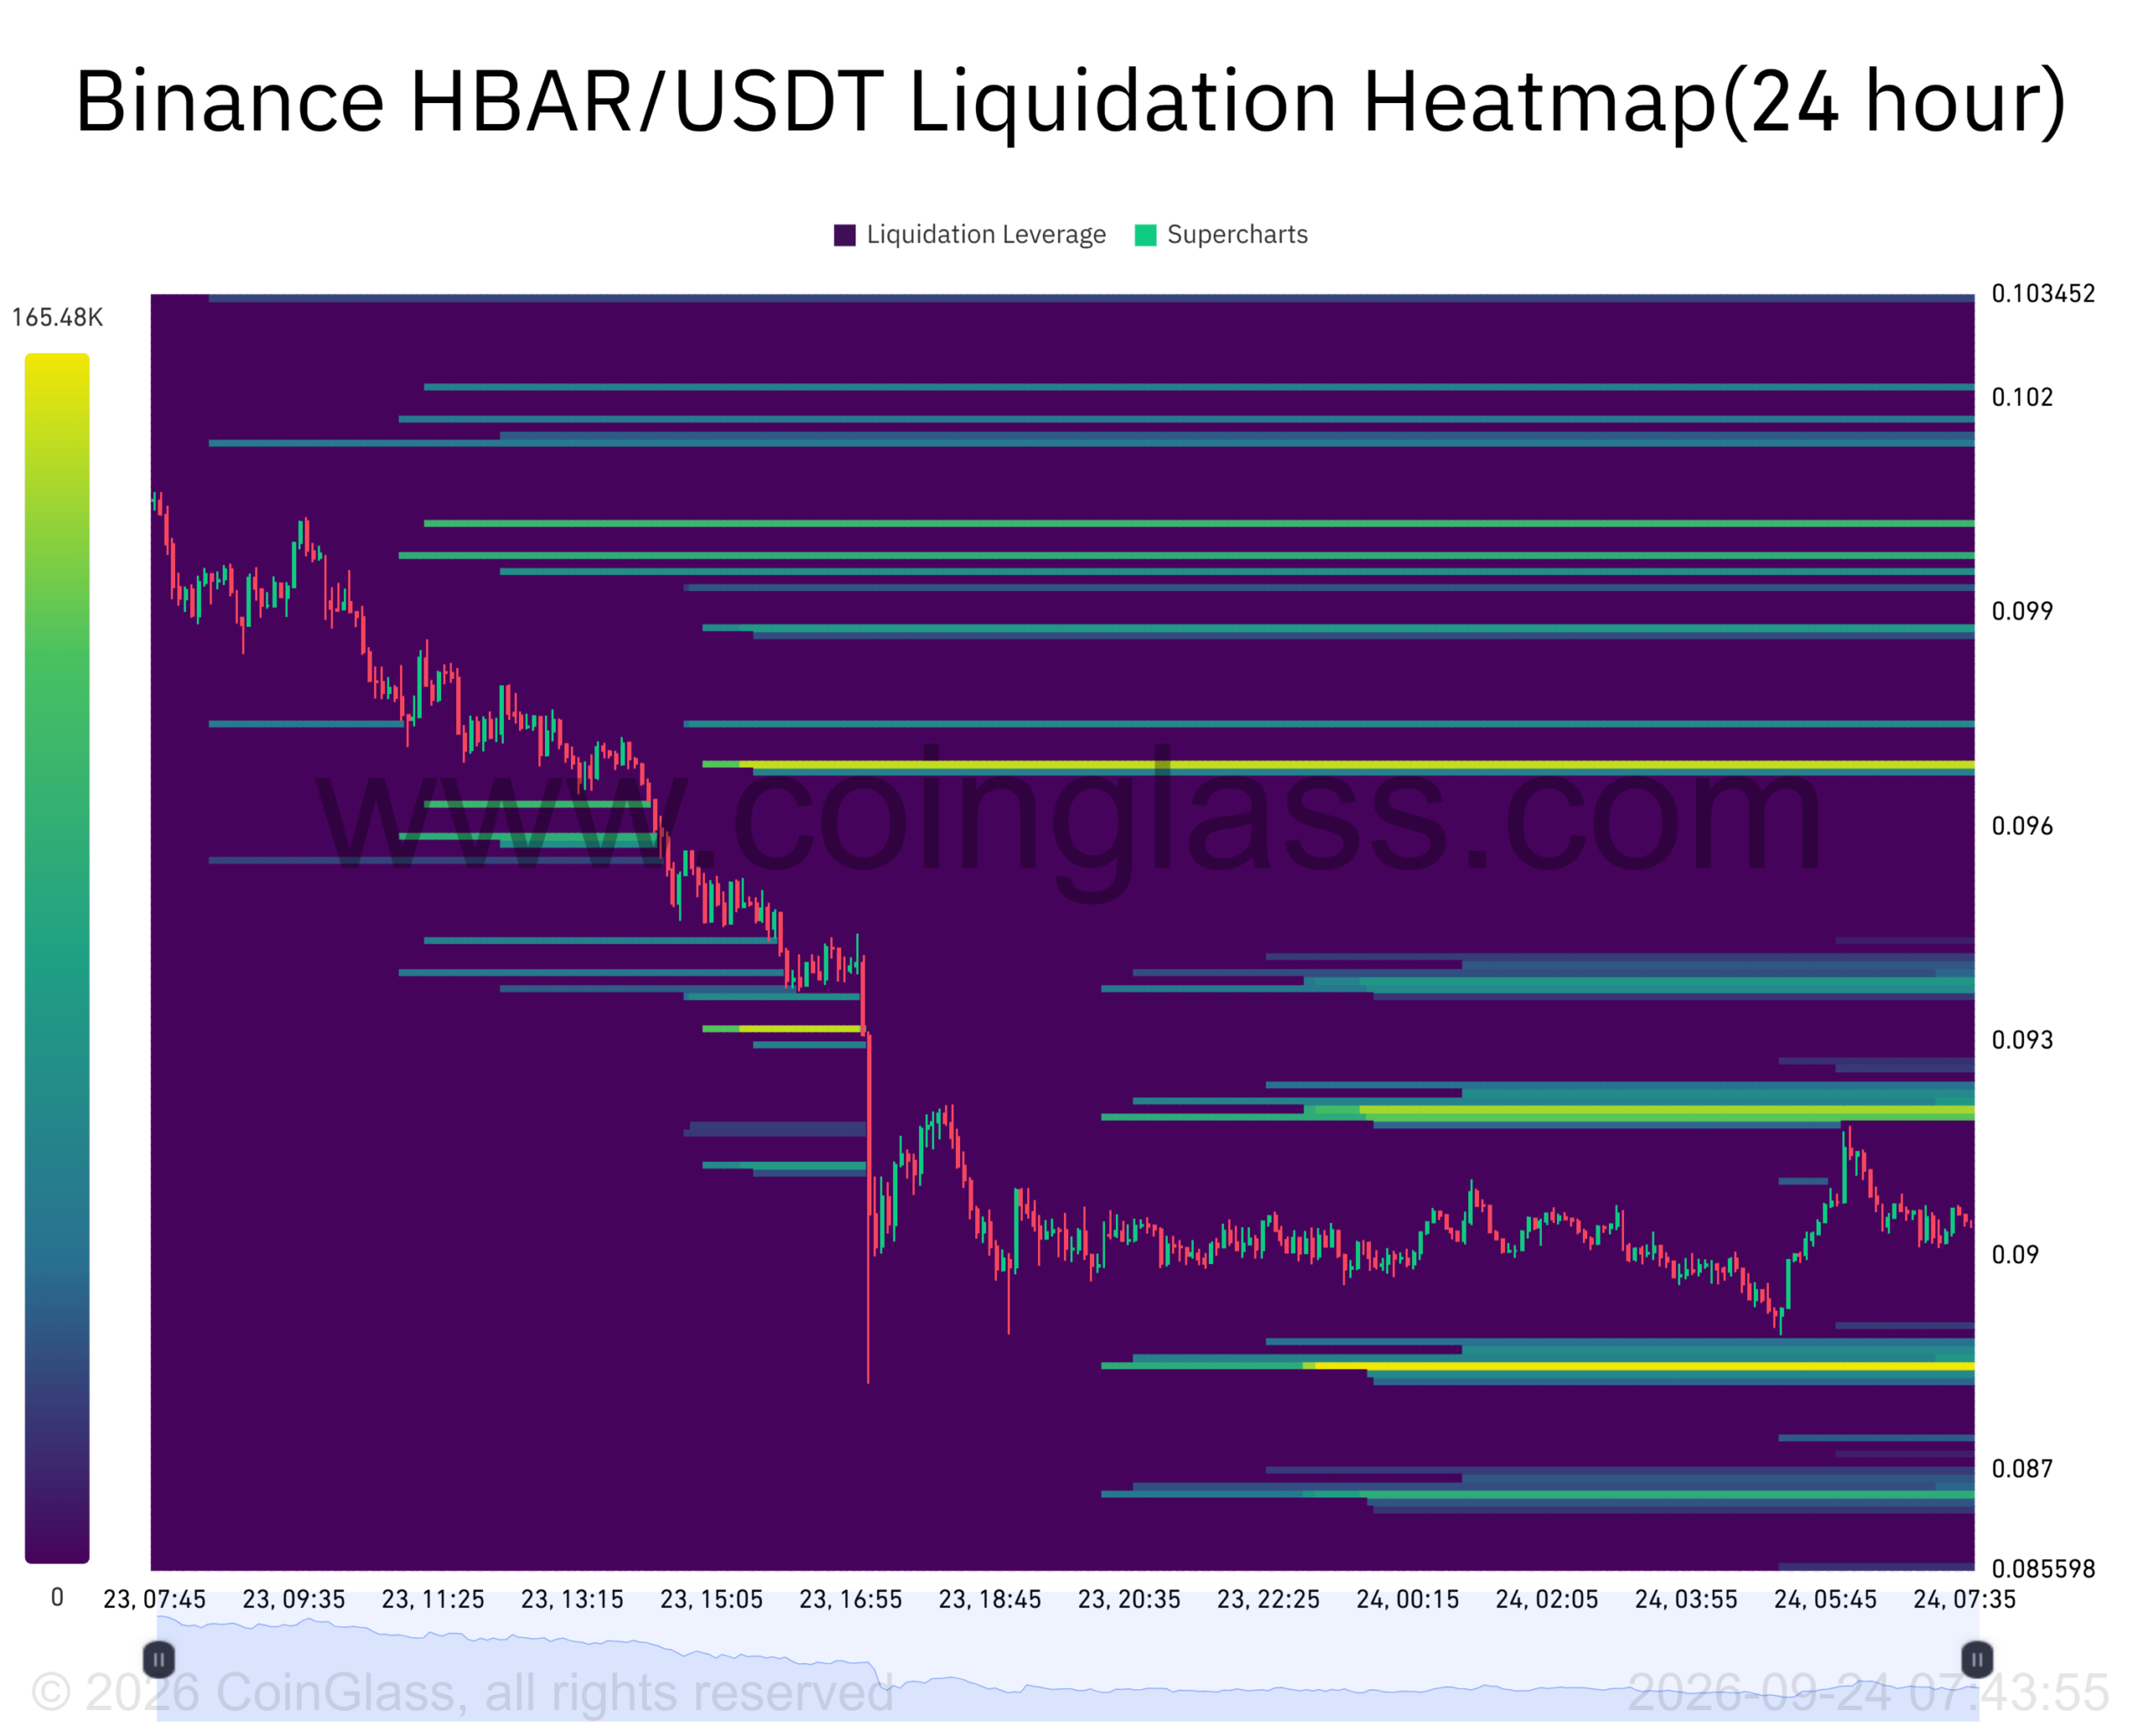
Notably, HBAR had likely collected the upper liquidity during its earlier price rally towards the psychological $ 0.10 resistance.
Following that liquidity sweep, the pullback then shifted attention toward liquidation cluster concentrations below the prevailing market price.
Notably, a dense cluster appeared around the $0.088 region, while further liquidity extended towards the $ 0.087 area.
Therefore, HBAR could likely target these lower liquidity concentrations before reaching its nearby Fibonacci support zone.
This liquidity sweep would align with the developing price reset without necessarily invalidating the broader recovery structure.
In fact, grabbing the lower liquidity could prepare Hedera for a fresh demand around the golden zone.
Ultimately HBAR could then challenge the $0.10-resistance again so long as the bulls defend that region and regain control.
Therefore, the Fib golden region remains important for determining whether the price retracement becomes a springboard towards higher prices.
Final Summary
- HBAR’s pullback put the $0.088 and $0.087 liquidity clusters in focus.
- Buyers may need to defend $0.08335–$0.08680 before Hedera [HBAR] can challenge $0.10 again.