Evaluating why Polkadot [DOT] is struggling to regain support levels

After a “wow” performance last week, Polkadot [DOT] has reversed to digging for new red levels. Recall that DOT was the best performing cryptocurrency among the top coins on CoinMarketCap during the aforementioned period.
However, DOT has only produced losses for investors with the coin in the portfolio over the last 24 hours. As of 9 August, DOT was trading at $9.02, only to have fallen to $8.59 on the same day. At press time, DOT had surged to $8.70, which still represented a 2.92% decline from the day before.
New upgrades but…
Coincidentally, there have been new upgrades to the Polkadot ecosystem. On 10 August, Polkdaot approved a relay chain upgrade. After being proposed earlier, the upgrade was aimed at improving runtime migrations and database operations on its chain.
Also, Polkadot Insider, an analytics platform focused on the Polkadot ecosystem, reported that some top crypto projects on Binance have been added to the chain. They include Chainlink [LINK], Kusama [KSM], and Phala Network [PHA], amongst others.
? @binance is the largest #cex exchange in the crypto market. Being listed on #Binance partly shows the legit of the projects.
Below are top projects on @polkadot that you already can trade/buy/sell on the #Binance exchange. Let's check it out#Polkadot #DOT $DOT $BNB $KSM pic.twitter.com/N2QpnMmafN
— Polkadot Insider (@PolkadotInsider) August 10, 2022
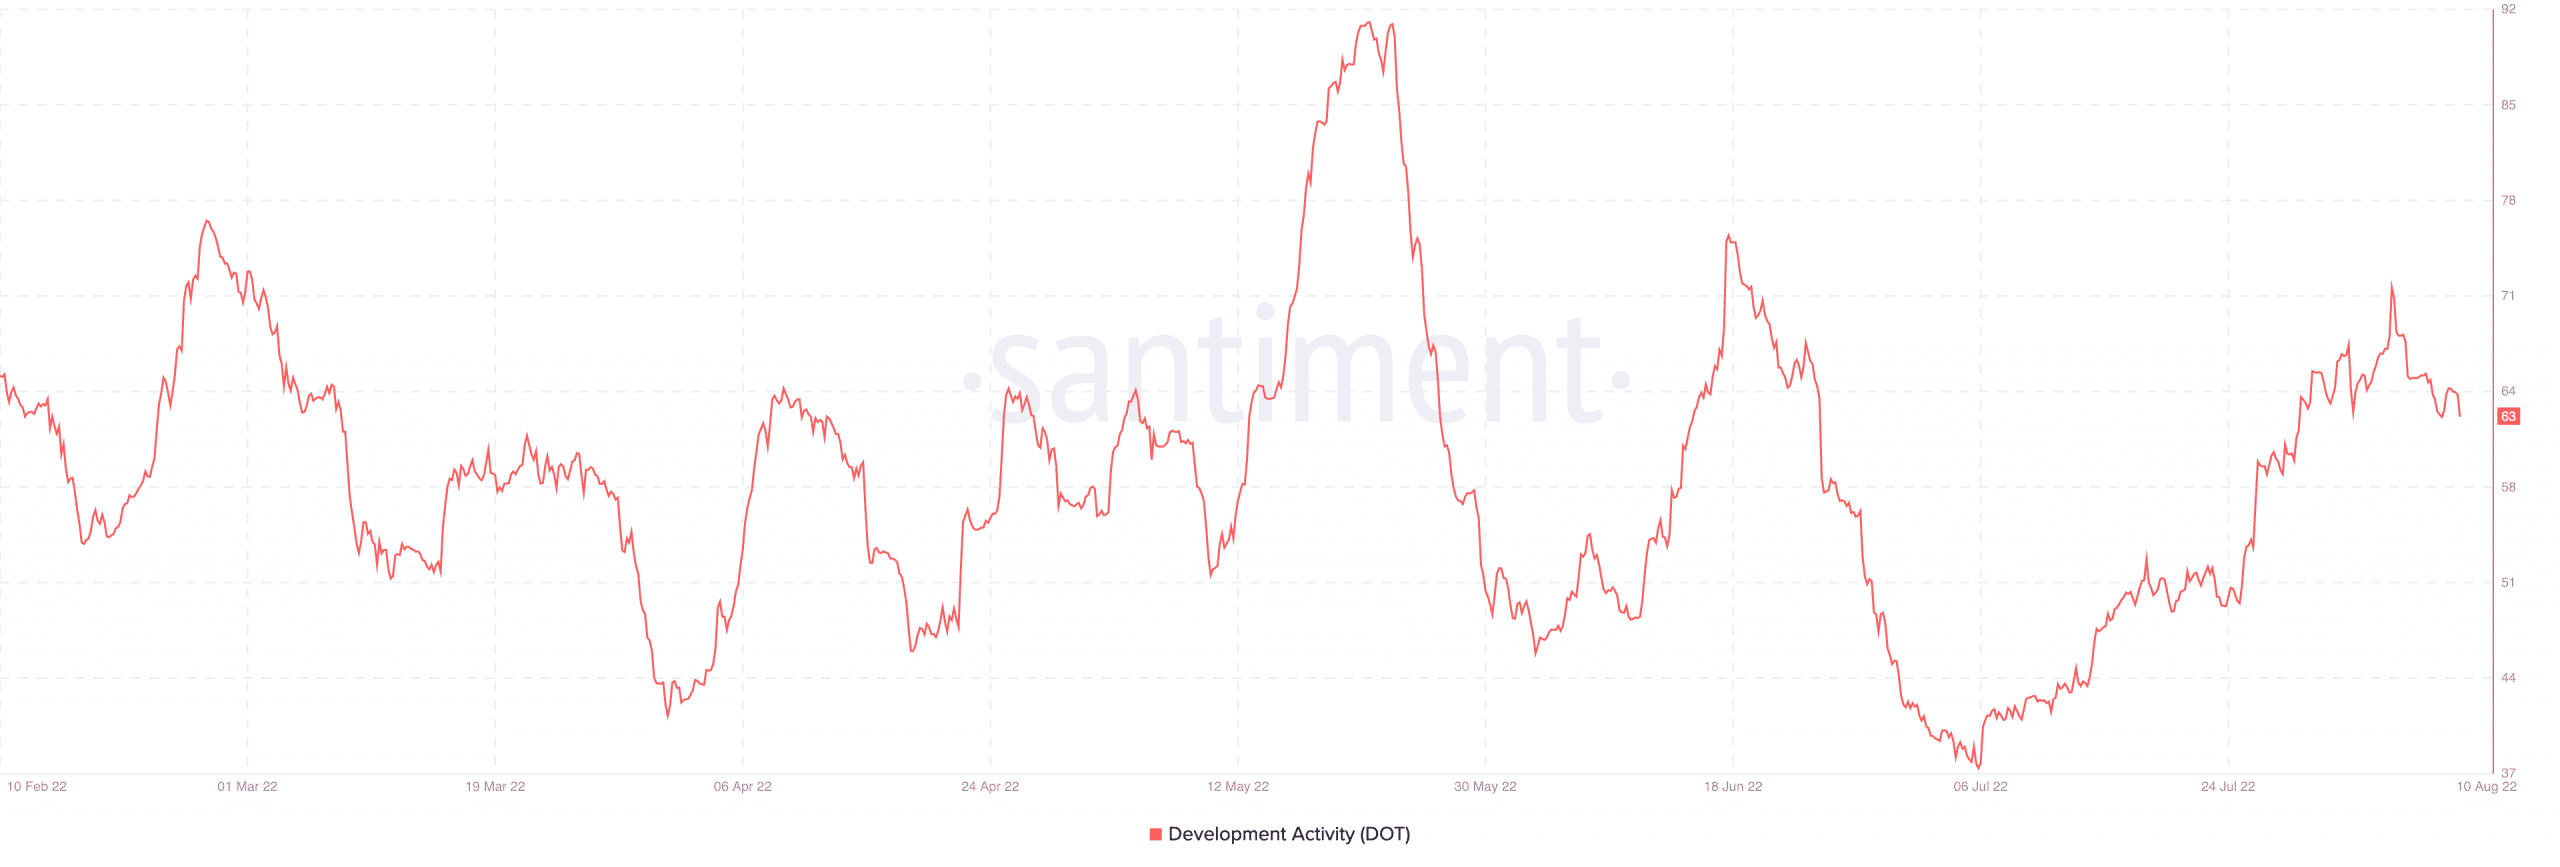
These upgrades helped increase the development activity of DOT, according to Santiment. Although it rose to 71.23 on 5 August, the development activity had reduced to 63 at press time, which meant it was at an improved stage compared with its stance on 25 July.
Is DOT losing it?
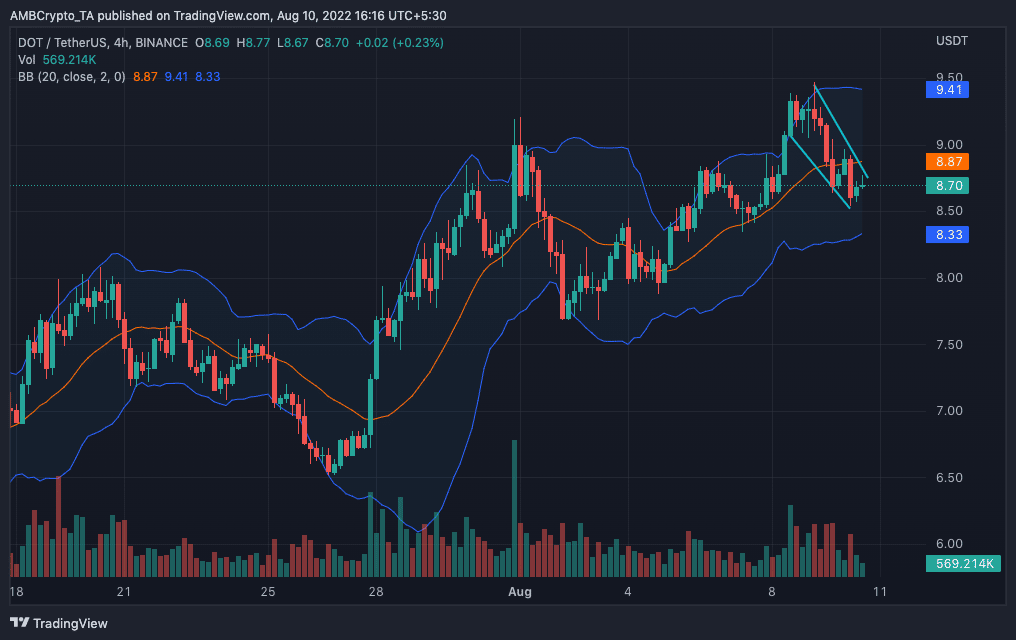
Another concern for DOT investors is the coin’s inability to hold its support lately. The four-hour DOT price chart showed that the coin has been following a downward trend.
After holding the $9.05 support on 8 August, DOT has failed to maintain any other one with the $8.64 lost and $8.53 zone on the brink.
Other indicators showed that DOT struggled to resist selling pressure, and a bearish momentum could remain for a while.
The Bollinger Bands (BB) also indicated that there was increasing volatility with signals for DOT to get even more volatile.
With its current state, the pressure on DOT could likely be why the development activity had not influenced a price uptick. So, is it just that?
Interestingly, it might not be all over for short-term DOT investors. This is because a few other indicators showed a chance of a price rise.
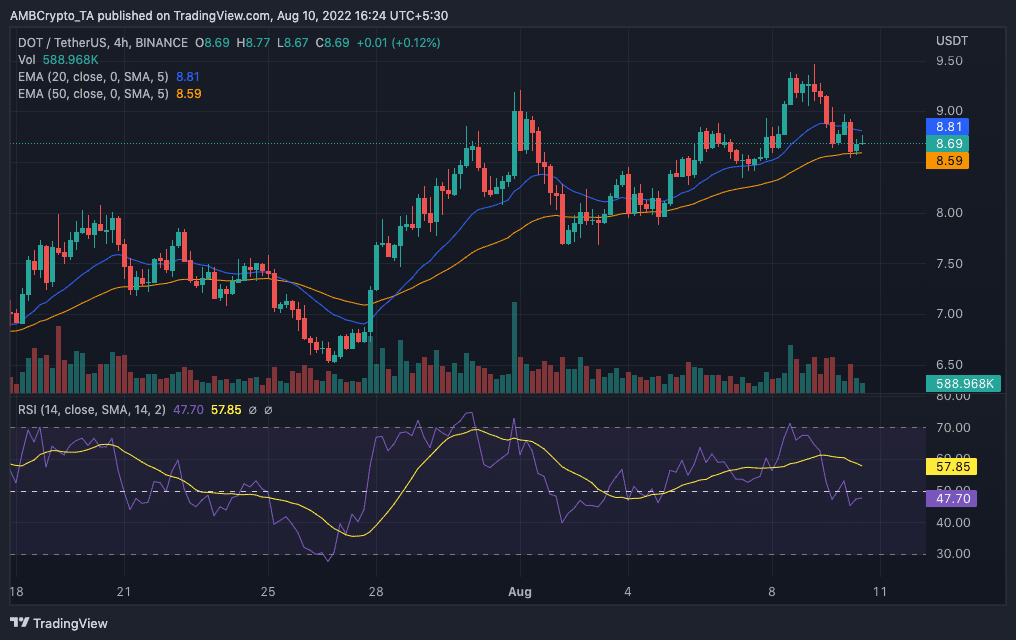
The Relative Strength Index (RSI) maintained a neutral stance, with its position closer to sustaining buying momentum.
Similarly, the 20-day Exponential Moving Average (EMA) in blue was above the 50 EMA, indicating that greens can appear.
Finally, investors need to note that the RSI and EMA results do not entirely neutralize the projections of the BB.


![Bitcoin [BTC]](https://ambcrypto.com/wp-content/uploads/2025/06/Gladys-5-1-400x240.webp)
