Do MATIC bulls have enough muscle to challenge the current bearish structure

Disclaimer: The findings of the following analysis are the sole opinions of the writer and should not be considered investment advice.
After gliding near the $1.3 baseline for over three months, Polygon (MATIC) bears echoed with the market-wide fear sentiment. As a result, the coin disregarded the buying tendencies by urging massive sell-offs over the last month.
With buyers keen to reject lower prices, a comfortable close above the Point of Control (POC, red) would position MATIC for a test of the 23.6% Fibonacci level. At press time, the alt traded at $0.688, up by 3.57% in the last 24 hours.
MATIC Daily Chart
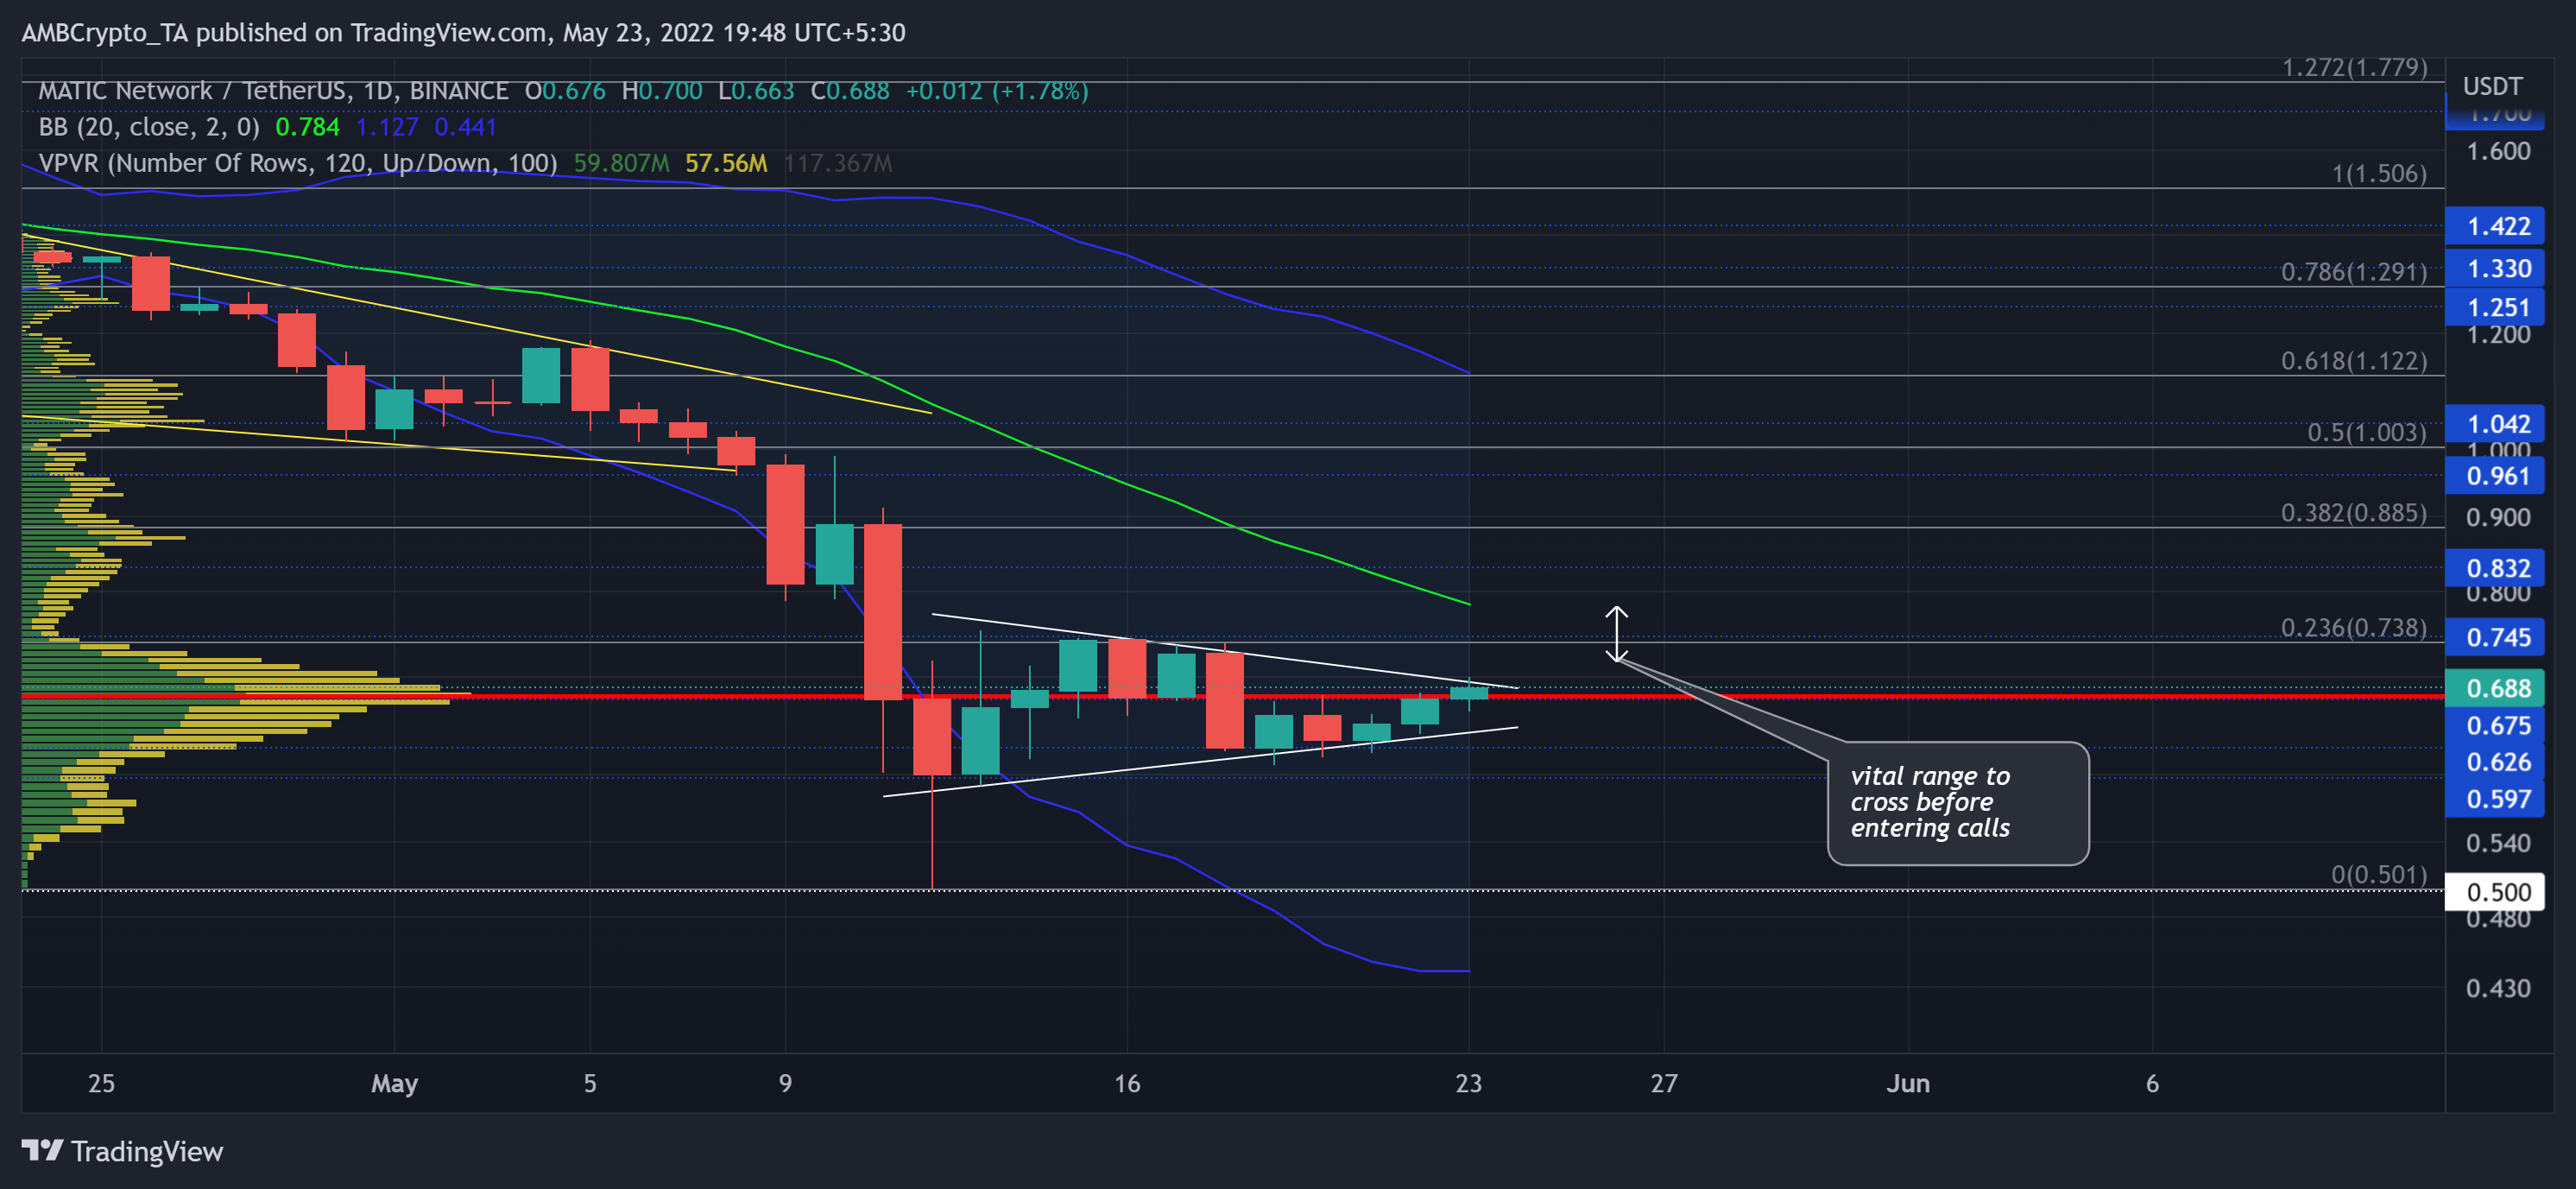
An early April reversal from the $1.7 reaffirmed the selling spree as MATIC fell below the basis line (green, 20 SMA) of its Bollinger Bands (BB). Post an over 70% decline from 4 April, MATIC plunged towards its one-year low on 12 May. During the descent, the 38.2% and the 23.6% Fibonacci levels posed substantial recovery hurdles.
But the sellers visibly took over as the bears kept the alt towards the lower band of BB for the last 47 days. With multiple bearish engulfing candlesticks, MATIC saw a bearish pennant on the daily timeframe that compressed near its POC.
A close below the POC would heighten the chances of a bearish break below the pattern. In which case, MATIC would aim to retest the sturdiness of its $0.6-zone support. Should the bulls find an upward escape from the bonds of its pennant, the alt could see itself testing the resistance of the basis line of the BB before continuing its uptrend.
Rationale
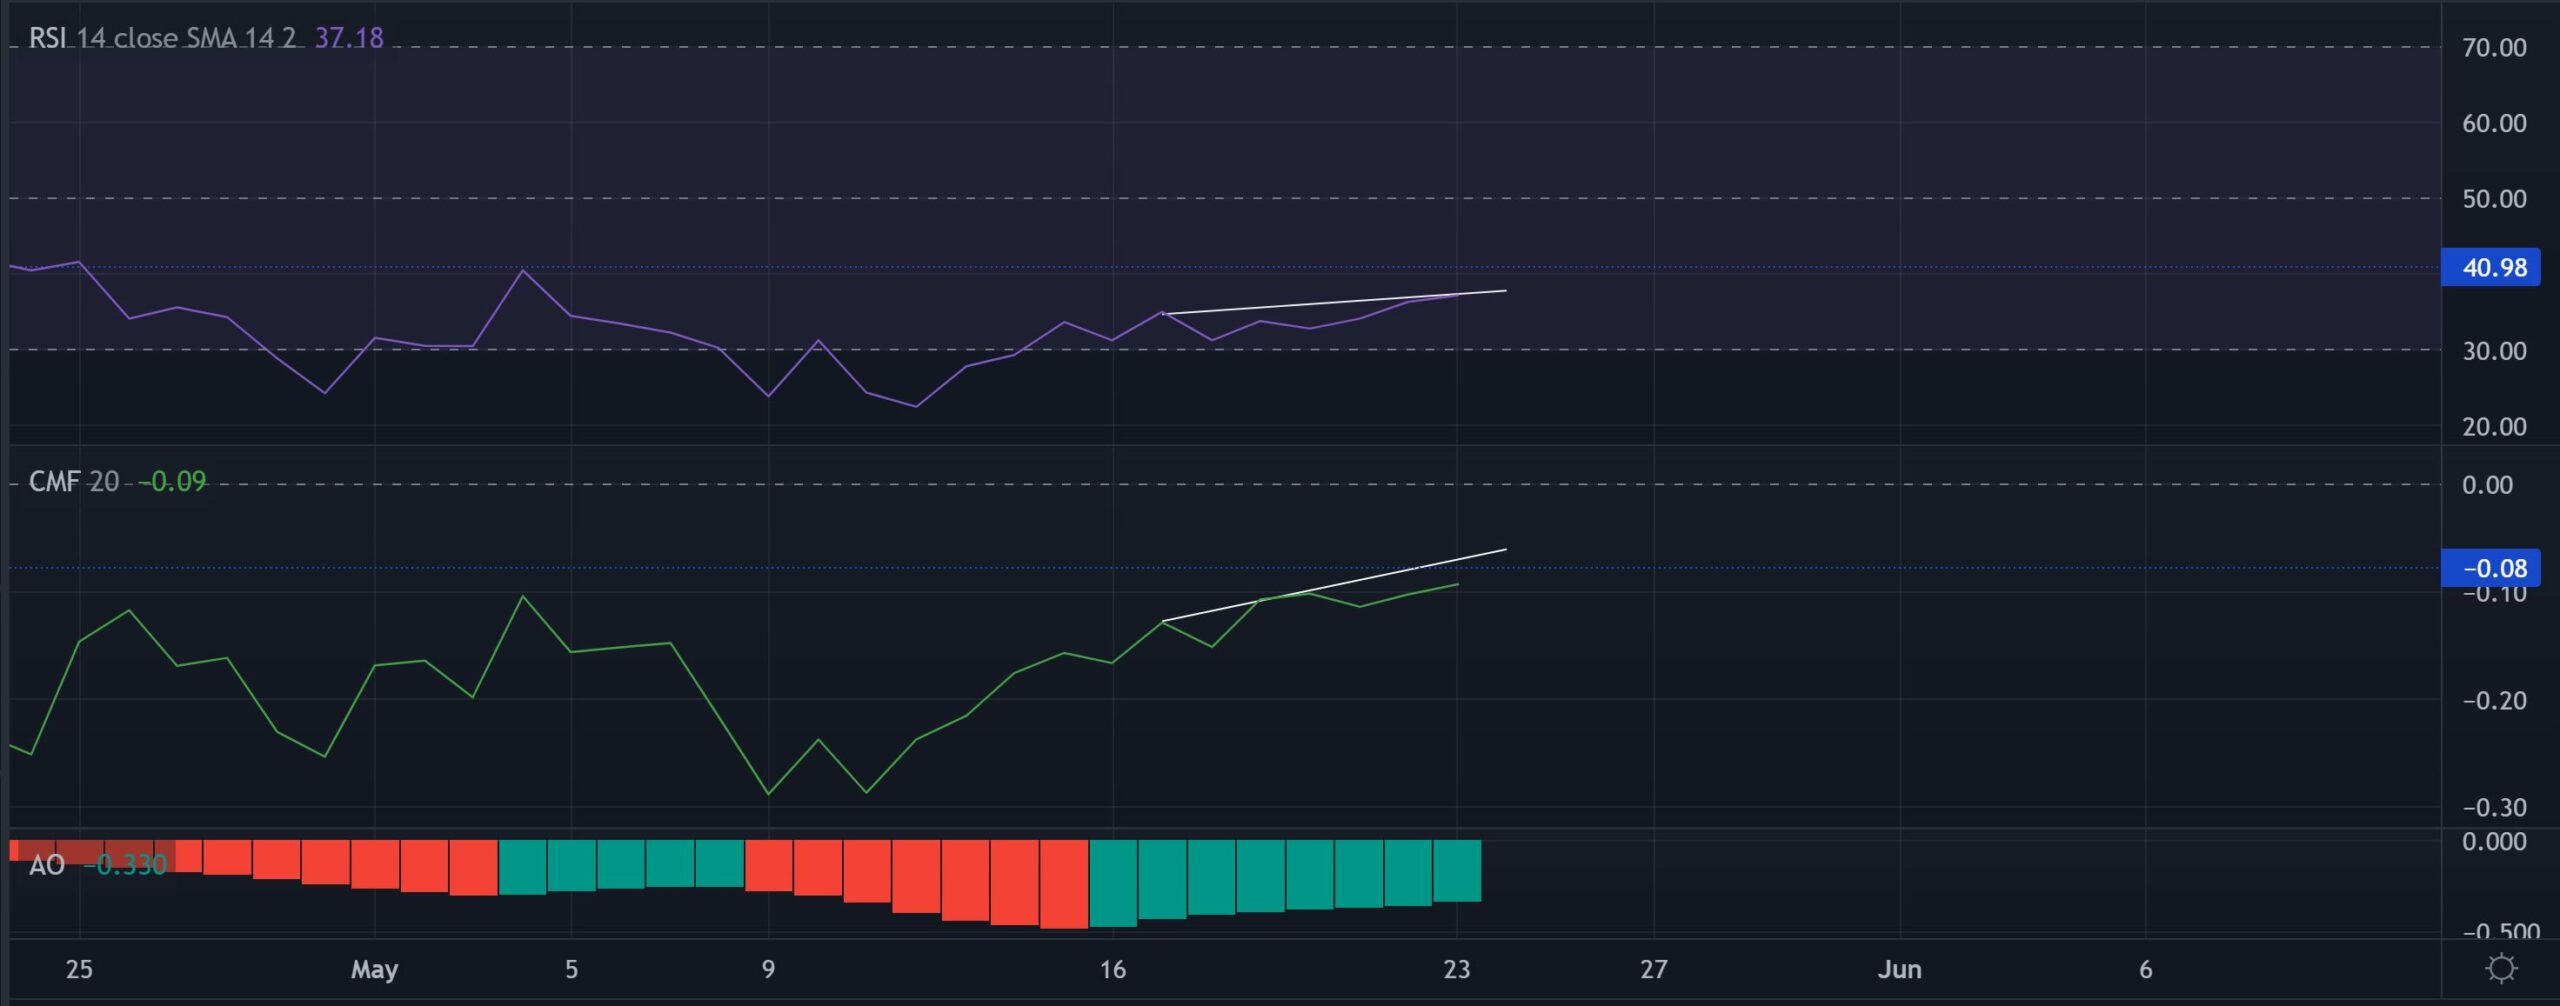
The RSI saw a well-needed revival from the oversold mark on its peaks and troughs over the last few days. A potential reversal from its immediate trendline resistance could confirm a bearish divergence with the price.
Also, the CMF has a bearish inclination. Despite its recent upswing, any drawdown from the -0.8 level would result in a bearish divergence. Nevertheless, the AO showed gradual ease in selling pressure. Any higher peaks below the zero-line could result in a bullish twin peak setup.
Conclusion
While entering calls may not be profitable yet as it would amount to betting against the dominant trend. The buyers could wait for a close above the 23.6% level, followed by the basis line to bag in the profits from a potential bull run.
Moreover, the investors/traders must keep a close eye on Bitcoin’s movement as MATIC shares a staggering 97% 30-day correlation with the King coin.