DOGE, SAND, and GALA Price Analysis: 22 May
The altcoin market refrained from volatility in the last few days as reflected by the short-bodied candlesticks on most charts.
DOGE, SAND, and GALA echoed with the wider market as they saw an uptick from their multi-monthly/yearly lows on 12 May. Now, they’re struggling to break the chains of its squeeze phase while the bulls still needed to boost the buying volumes.
Dogecoin (DOGE)
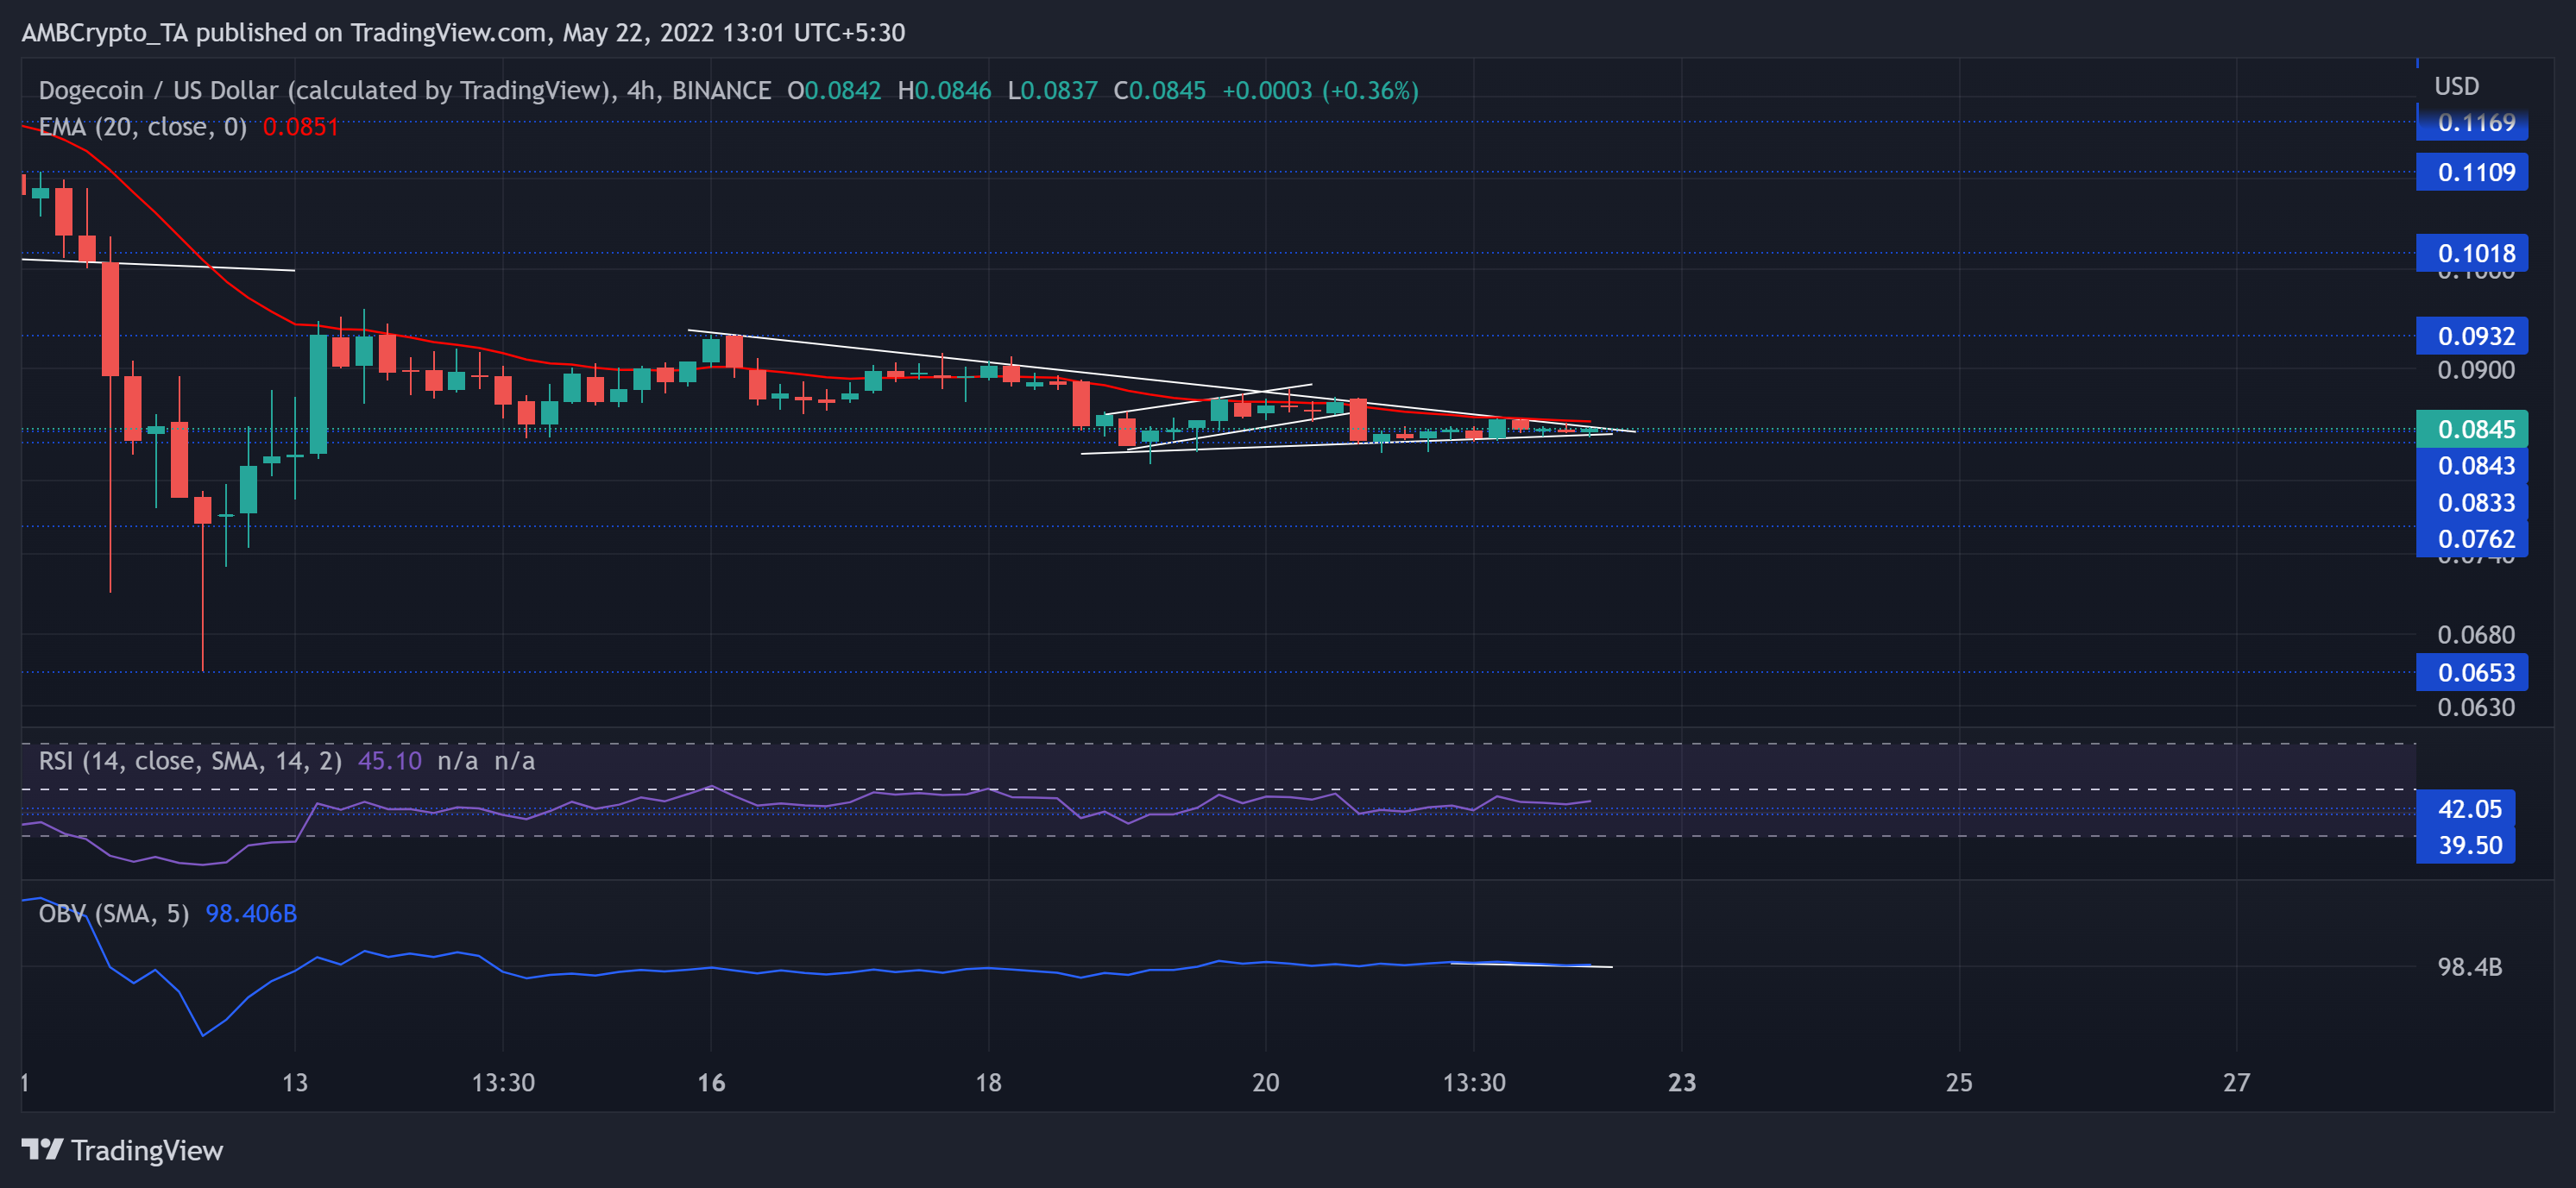
Owing to the broader market liquidations, DOGE sellers found renewed thrust from its April highs. On its southbound journey, the coin found some bullish resistance at its six-month trendline barrier (white). But a nearly 45% drop (from 10 May) pulled the meme-coin toward its 13-month low on 12 May.
Since picking itself from the $0.07 baseline, the altcoin curbed its volatility and transposed in a nine-day compression. Meanwhile, the buyers struggled to overturn the 20 EMA (red).
At press time, DOGE traded at $0.0845. After failing to find a spot above its equilibrium for most of the month, the RSI exhibited a strong selling vigor. The bulls needed to propel a close above the 50-mark on the index to avoid a potential fallout below the $ 0.08-level. Further, with the OBV marking lower troughs, it observed a slight bullish divergence with price.
The Sandbox (SAND)
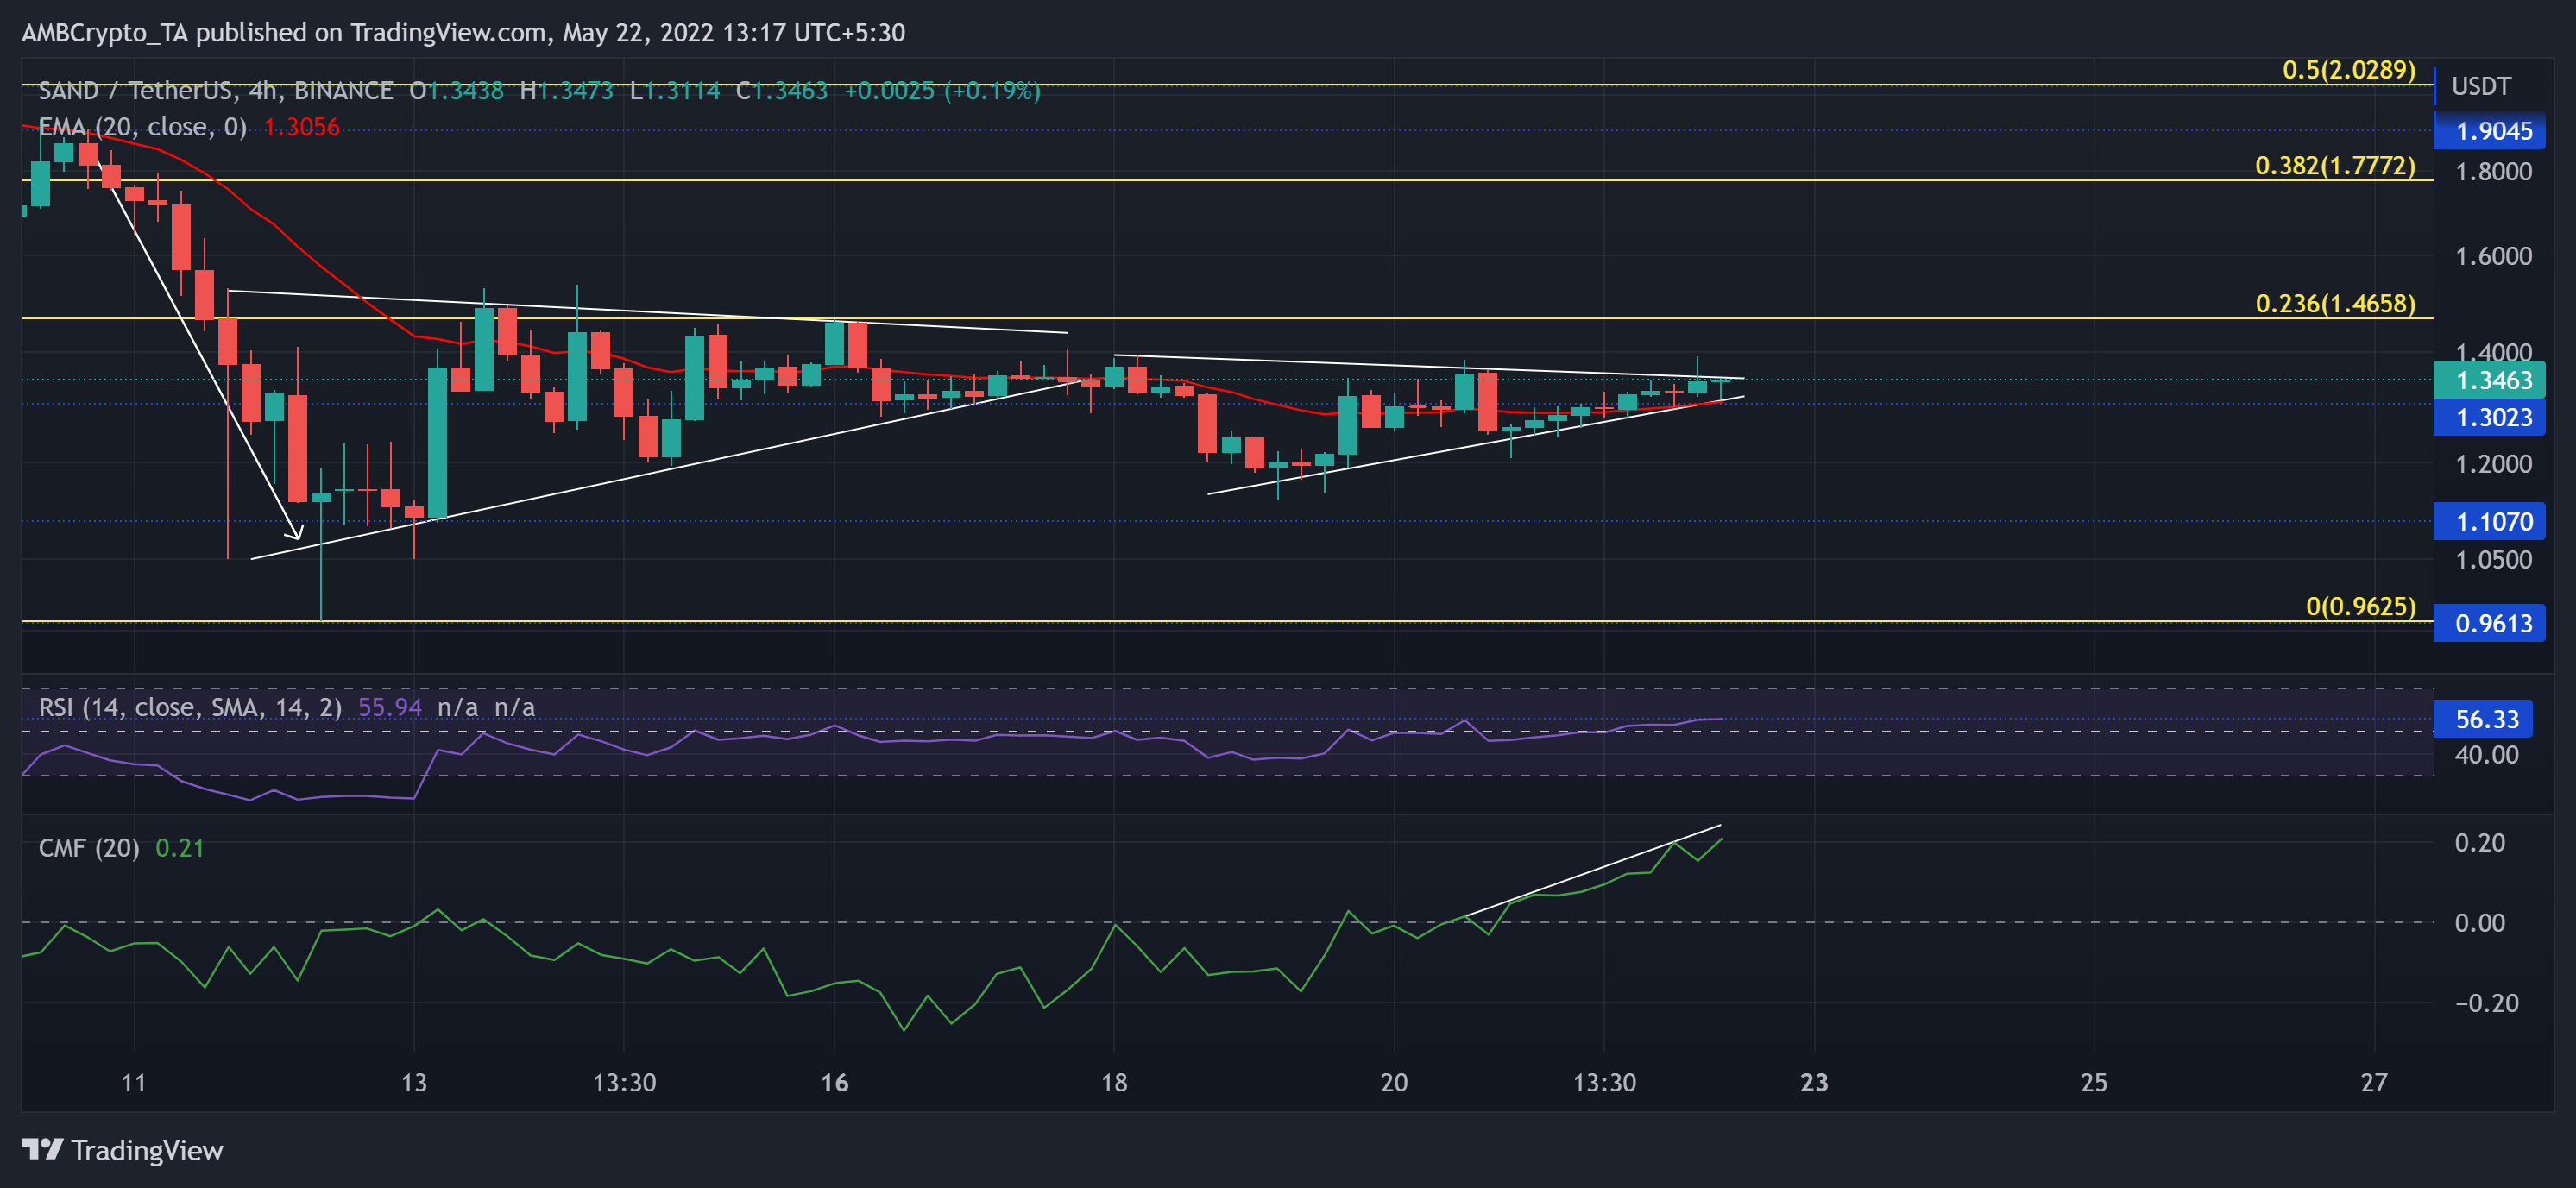
After the trendline resistance (white) denied the previous buying rally, the sellers re-navigated the trend in their favor by pulling the price all the way to the $1.1 baseline. With the 23.6% Fibonacci resistance refuting all the recovery attempts, the SAND entered a tight phase near the $1.3-zone.
Now, the altcoin witnessed a bearish pennant on the 4-hour timeframe. A sustained close below the 20 EMA (red) could be detrimental to the buyers in the short term.
At press time, SAND traded at $1.3463, up by nearly 4.66% in the last 24 hours. The RSI crossed the midline only to flatten in the last few hours after slamming into the 56-mark ceiling. Surprisingly, the CMF took a steep upturn to flash a strong buying power. But a potential correction from this northward journey could lead to a short-term setback for the buyers.
GALA
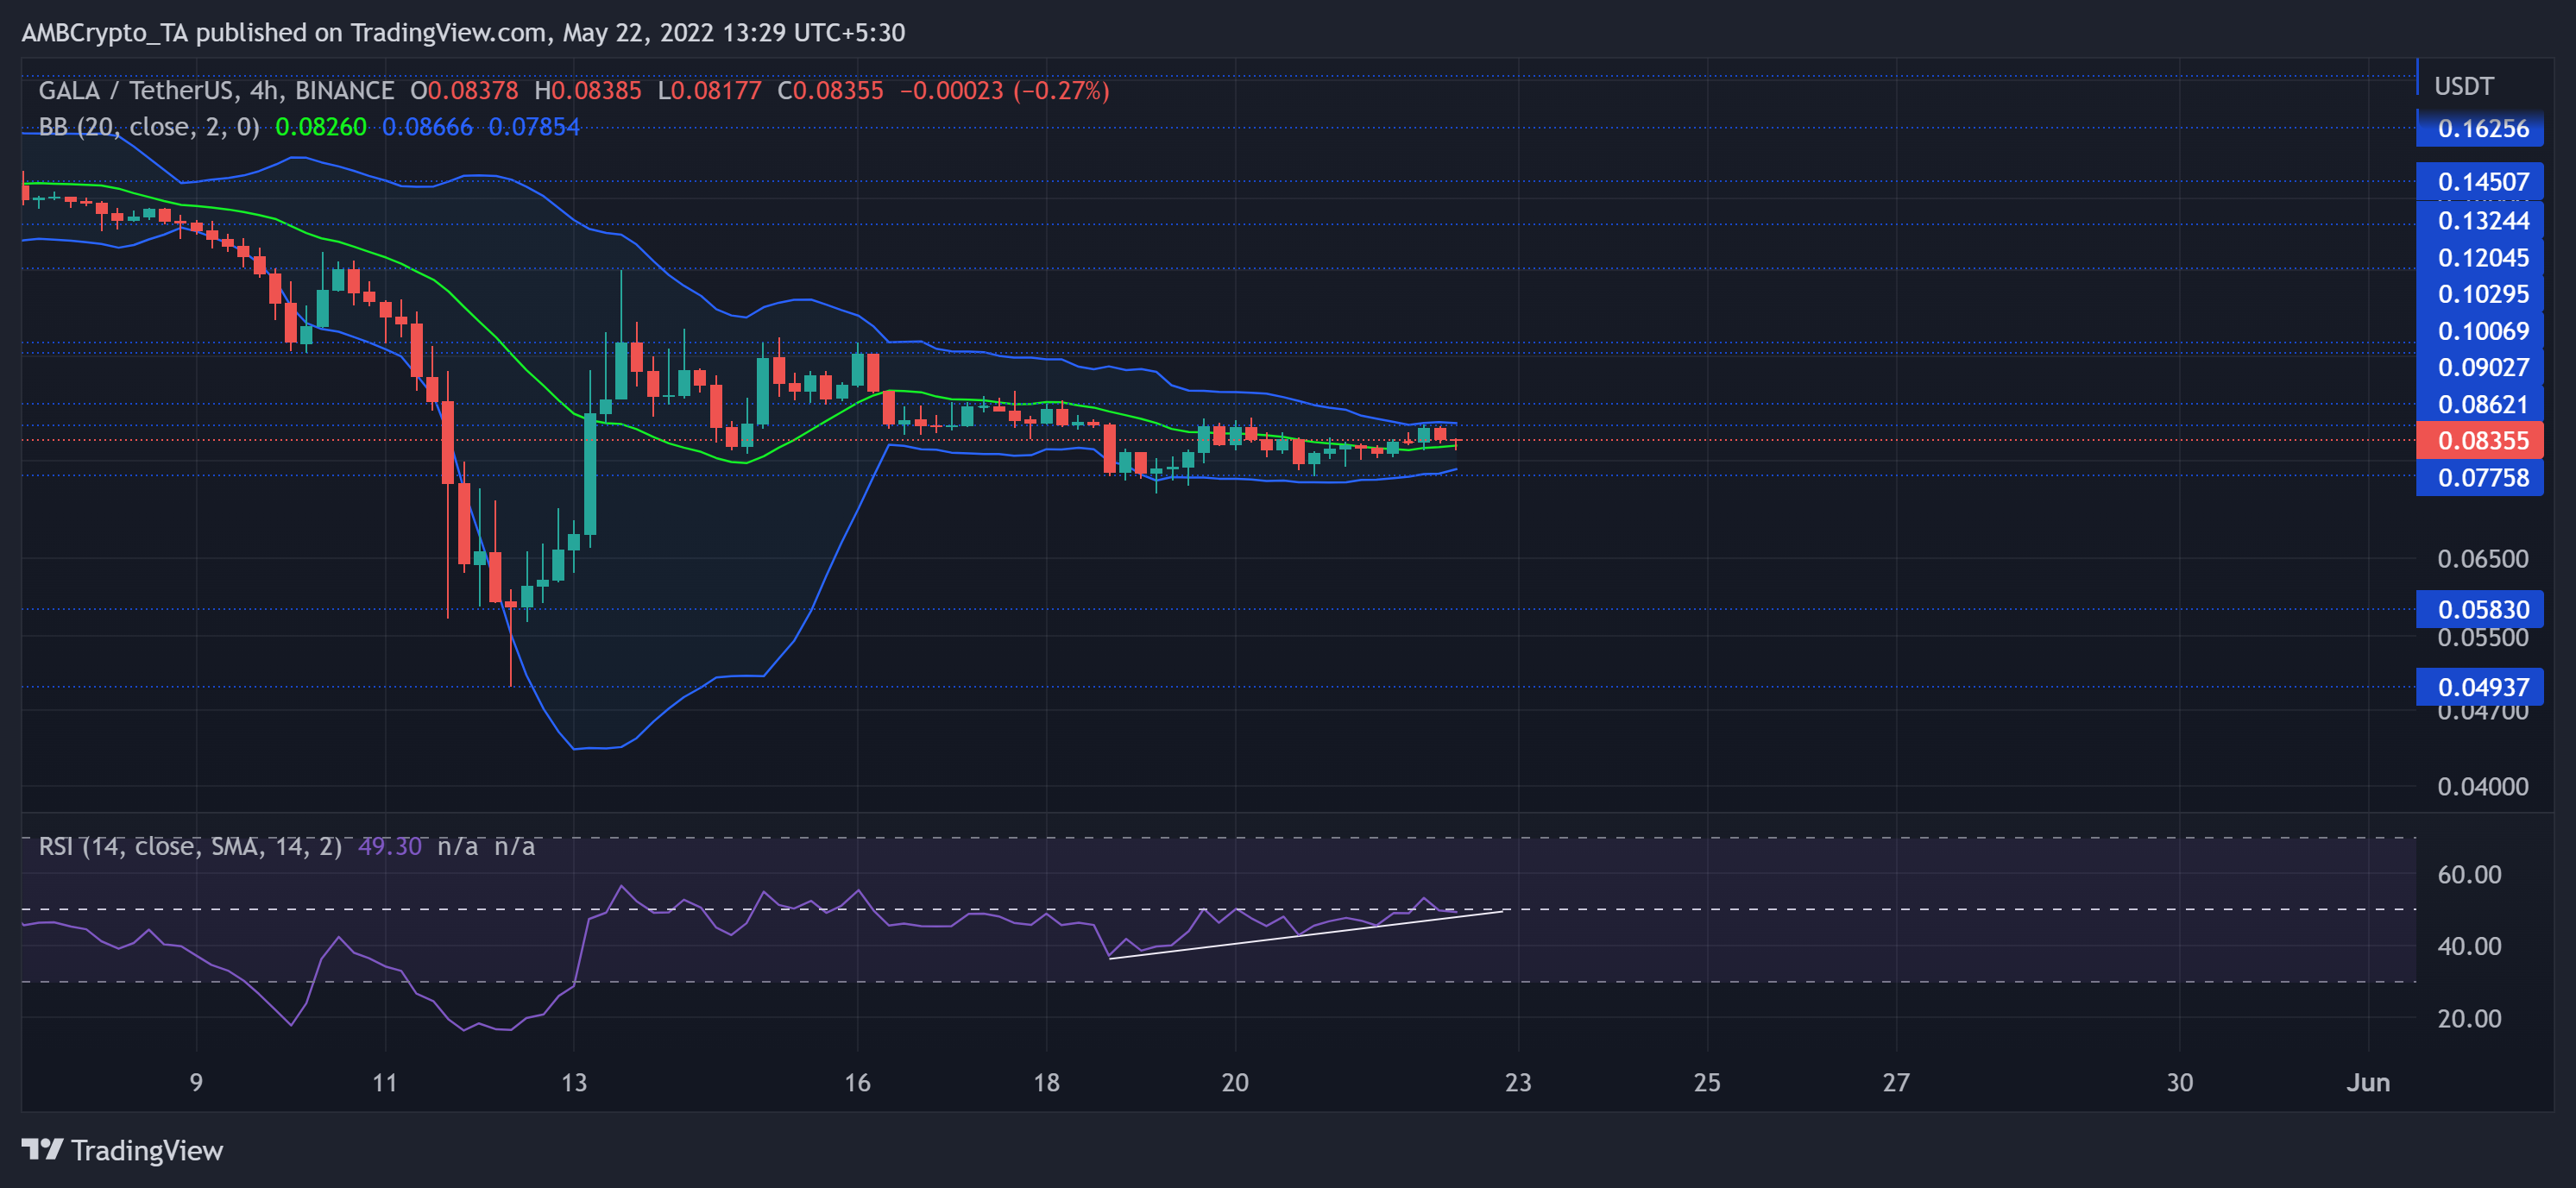
GALA lost its remaining advantage after it failed to protect the $0.162-level. Since losing this mark, it lost vital price points to multiple sell-offs.
The recent sell-off phase pushed GALA below the basis line (green) of Bollinger Bands (BB). The bulls quickly responded by propelling some gains from the lower band of the BB. But the $0.1-mark posed serious barriers and led the alt into a low volatile phase.
At press time, GALA was trading at $0.08355. The RSI was on a slight uptrend after forming steep trendline support (white trendline). While flashing neutrality, the index needed to close above the midline to prevent a price fall toward the lower band of BB.