DOGE: This bullish pattern on the chart bodes well for the OG dog-themed coin
Dogecoin price has shown a clean breakout from a bullish pattern with high conviction. The uptrend so far was without any hurdles, but the meme coin is currently facing a significant barrier that is likely to prevent further move upwards.
However, a successful flip of this hurdle into a foothold could be the key to triggering a massive and exponential run-up for the OG dog-themed cryptocurrency.
Bulls to make a strong comeback propelling Dogecoin price
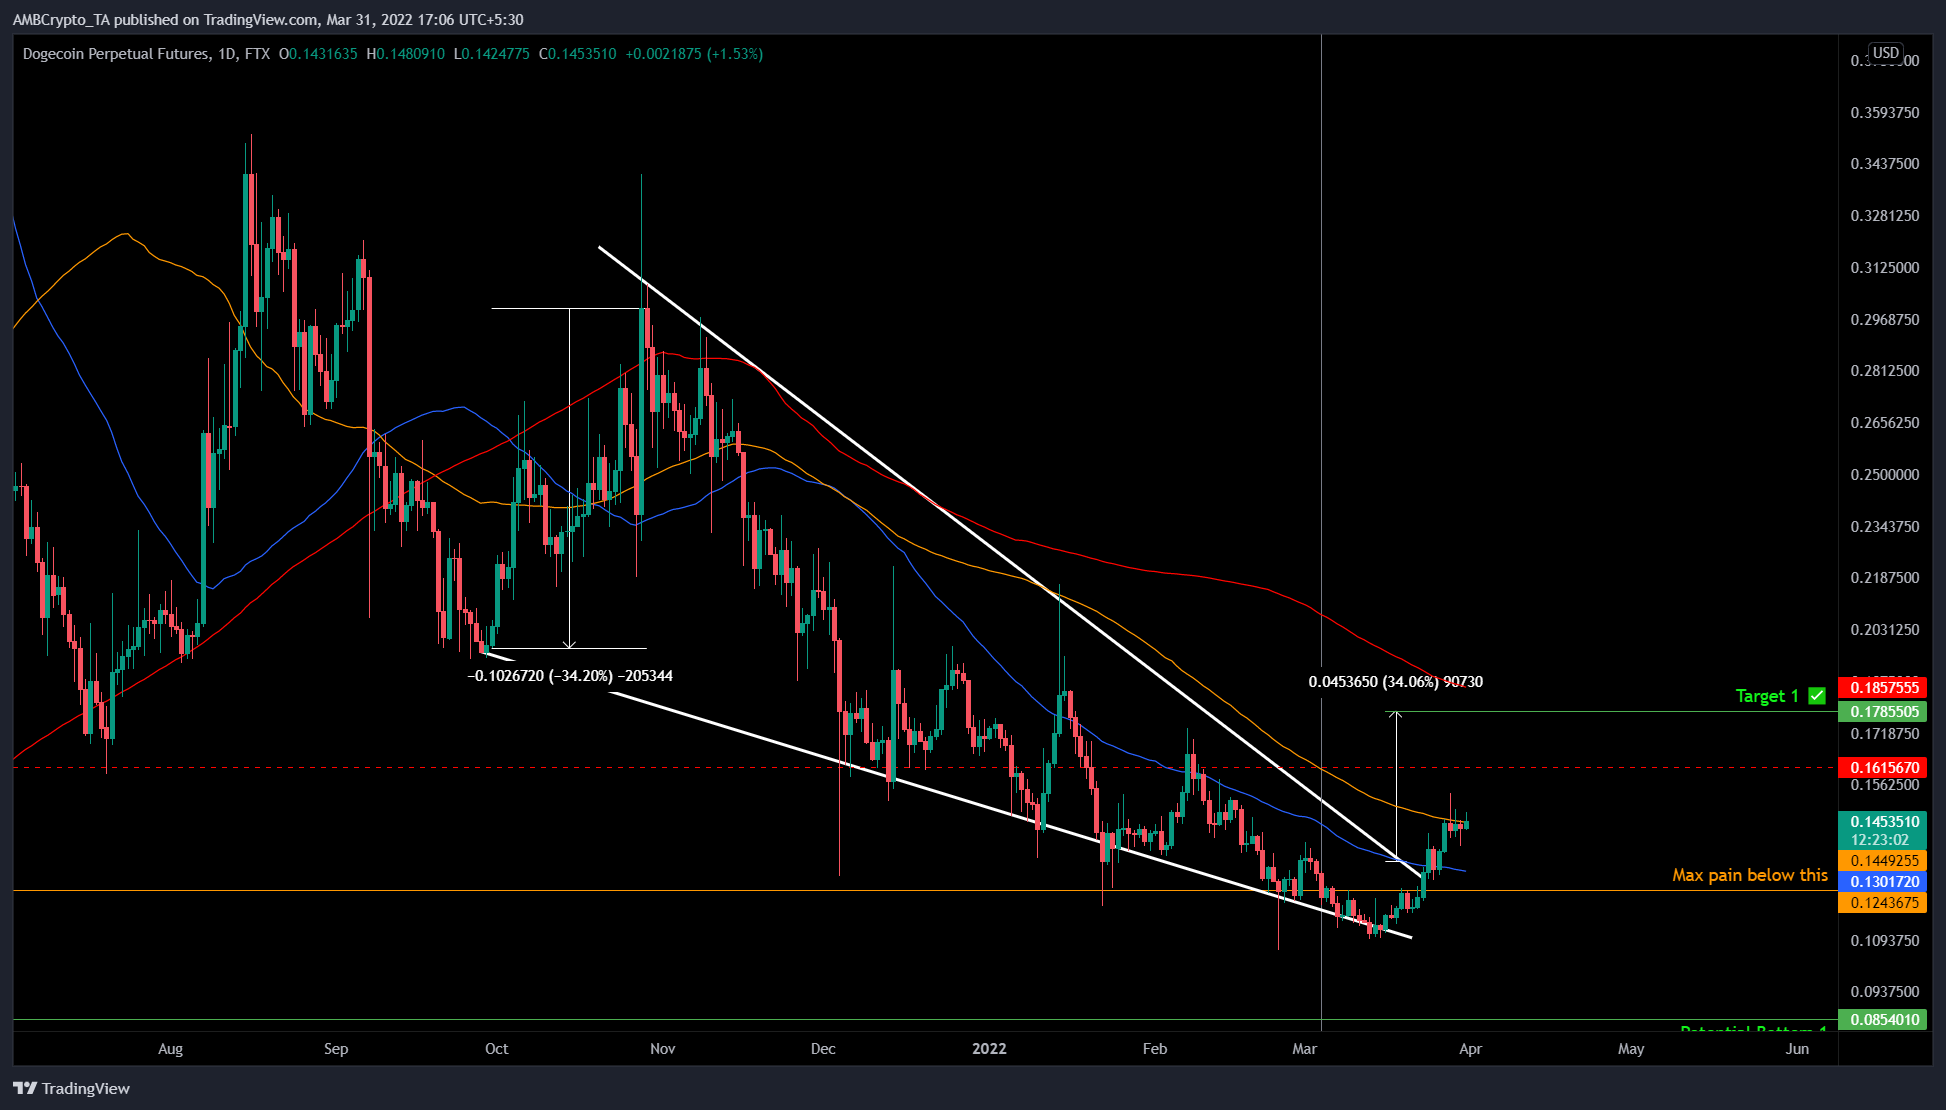
The downtrend that occurred from 29 September, 2021, to 22 March was a blessing in disguise for the Dogecoin price action. This price action set up three distinctive lower highs and lower lows, which when connected using trend lines reveals the formation of a falling wedge pattern.
This technical formation forecasts a 34% upswing to $0.178, obtained by adding the distance between the first swing high and swing low to the breakout point at $0.132. On 24 March, Dogecoin price moved past the upper trend line of the falling wedge, denoting a breakout. Since then, the meme coin has rallied by 18% but the bullish momentum seems to have capitulated due to the presence of the 100-day Simple Moving Average (SMA) at $0.144.
Going forward, investors can expert Dogecoin price to consolidate under this hurdle. However, a successful flip of this resistance barrier into a support level will be vital for bulls to reach their forecasted target at $0.132.
After tagging the $0.132 target, there is a good chance DOGE will move sideways before taking on the next significant hurdle at $0.185 aka the 200-day SMA. If the momentum exhausts, the upside will be limited to this level, but if the bulls band together, there is a high probability DOGE will make a run at the volume point of control for 2021 and 2022 at $0.260.
This level will be a barrier that bulls will be unlikely to cross since a majority of the volume for 2021 and 2022 was traded.
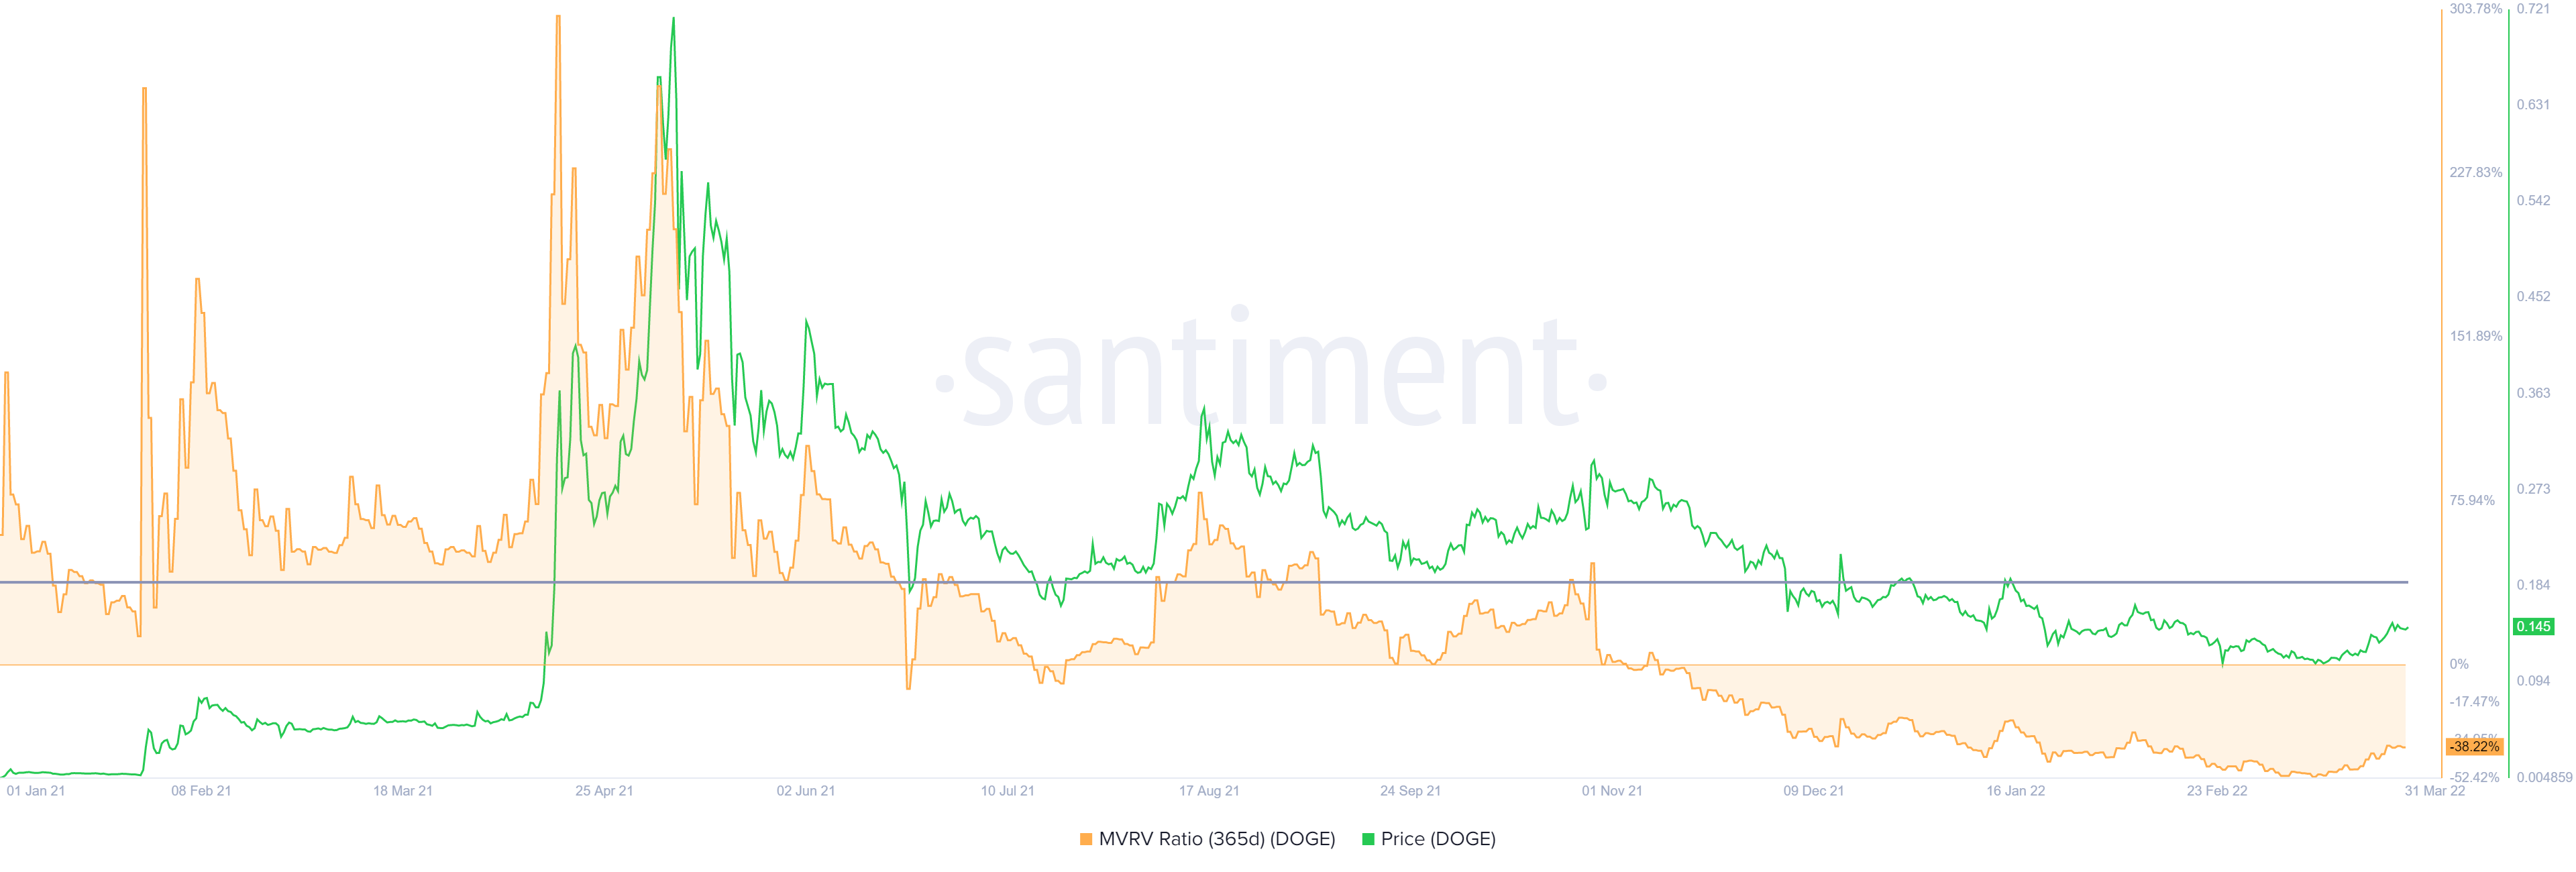
Supporting this near 80% ascent to $0.260 is the 365-day Market Value to Realized Value (MVRV) model. This indicator is used to assess the average profit/loss of investors that purchased DOGE tokens over the past year.
While a negative value below -10% often indicates that short-term holders are at a loss and the long-term holders take advantage of this to buy the tokens at a discount. Therefore, a value below -10% is often referred to as an ‘opportunity zone’.
Currently, the 36-day MVRV is hovering at -38%, indicating that a majority of the holders are at a loss. Therefore, long-term holders are likely accumulating DOGE at a discount, further supporting the outlook described from a technical standpoint.