Dogecoin, Bitcoin Cash, Ethereum Classic Price Analysis: 23 October

As Bitcoin hit the $60,000-mark, the cryptocurrency market mostly flashed signs of correction. While altcoins like Ethereum Classic agreed with the overall market correction and flashed bearish signals, Dogecoin and Bitcoin Cash showed a bullish preference.
Dogecoin (DOGE)
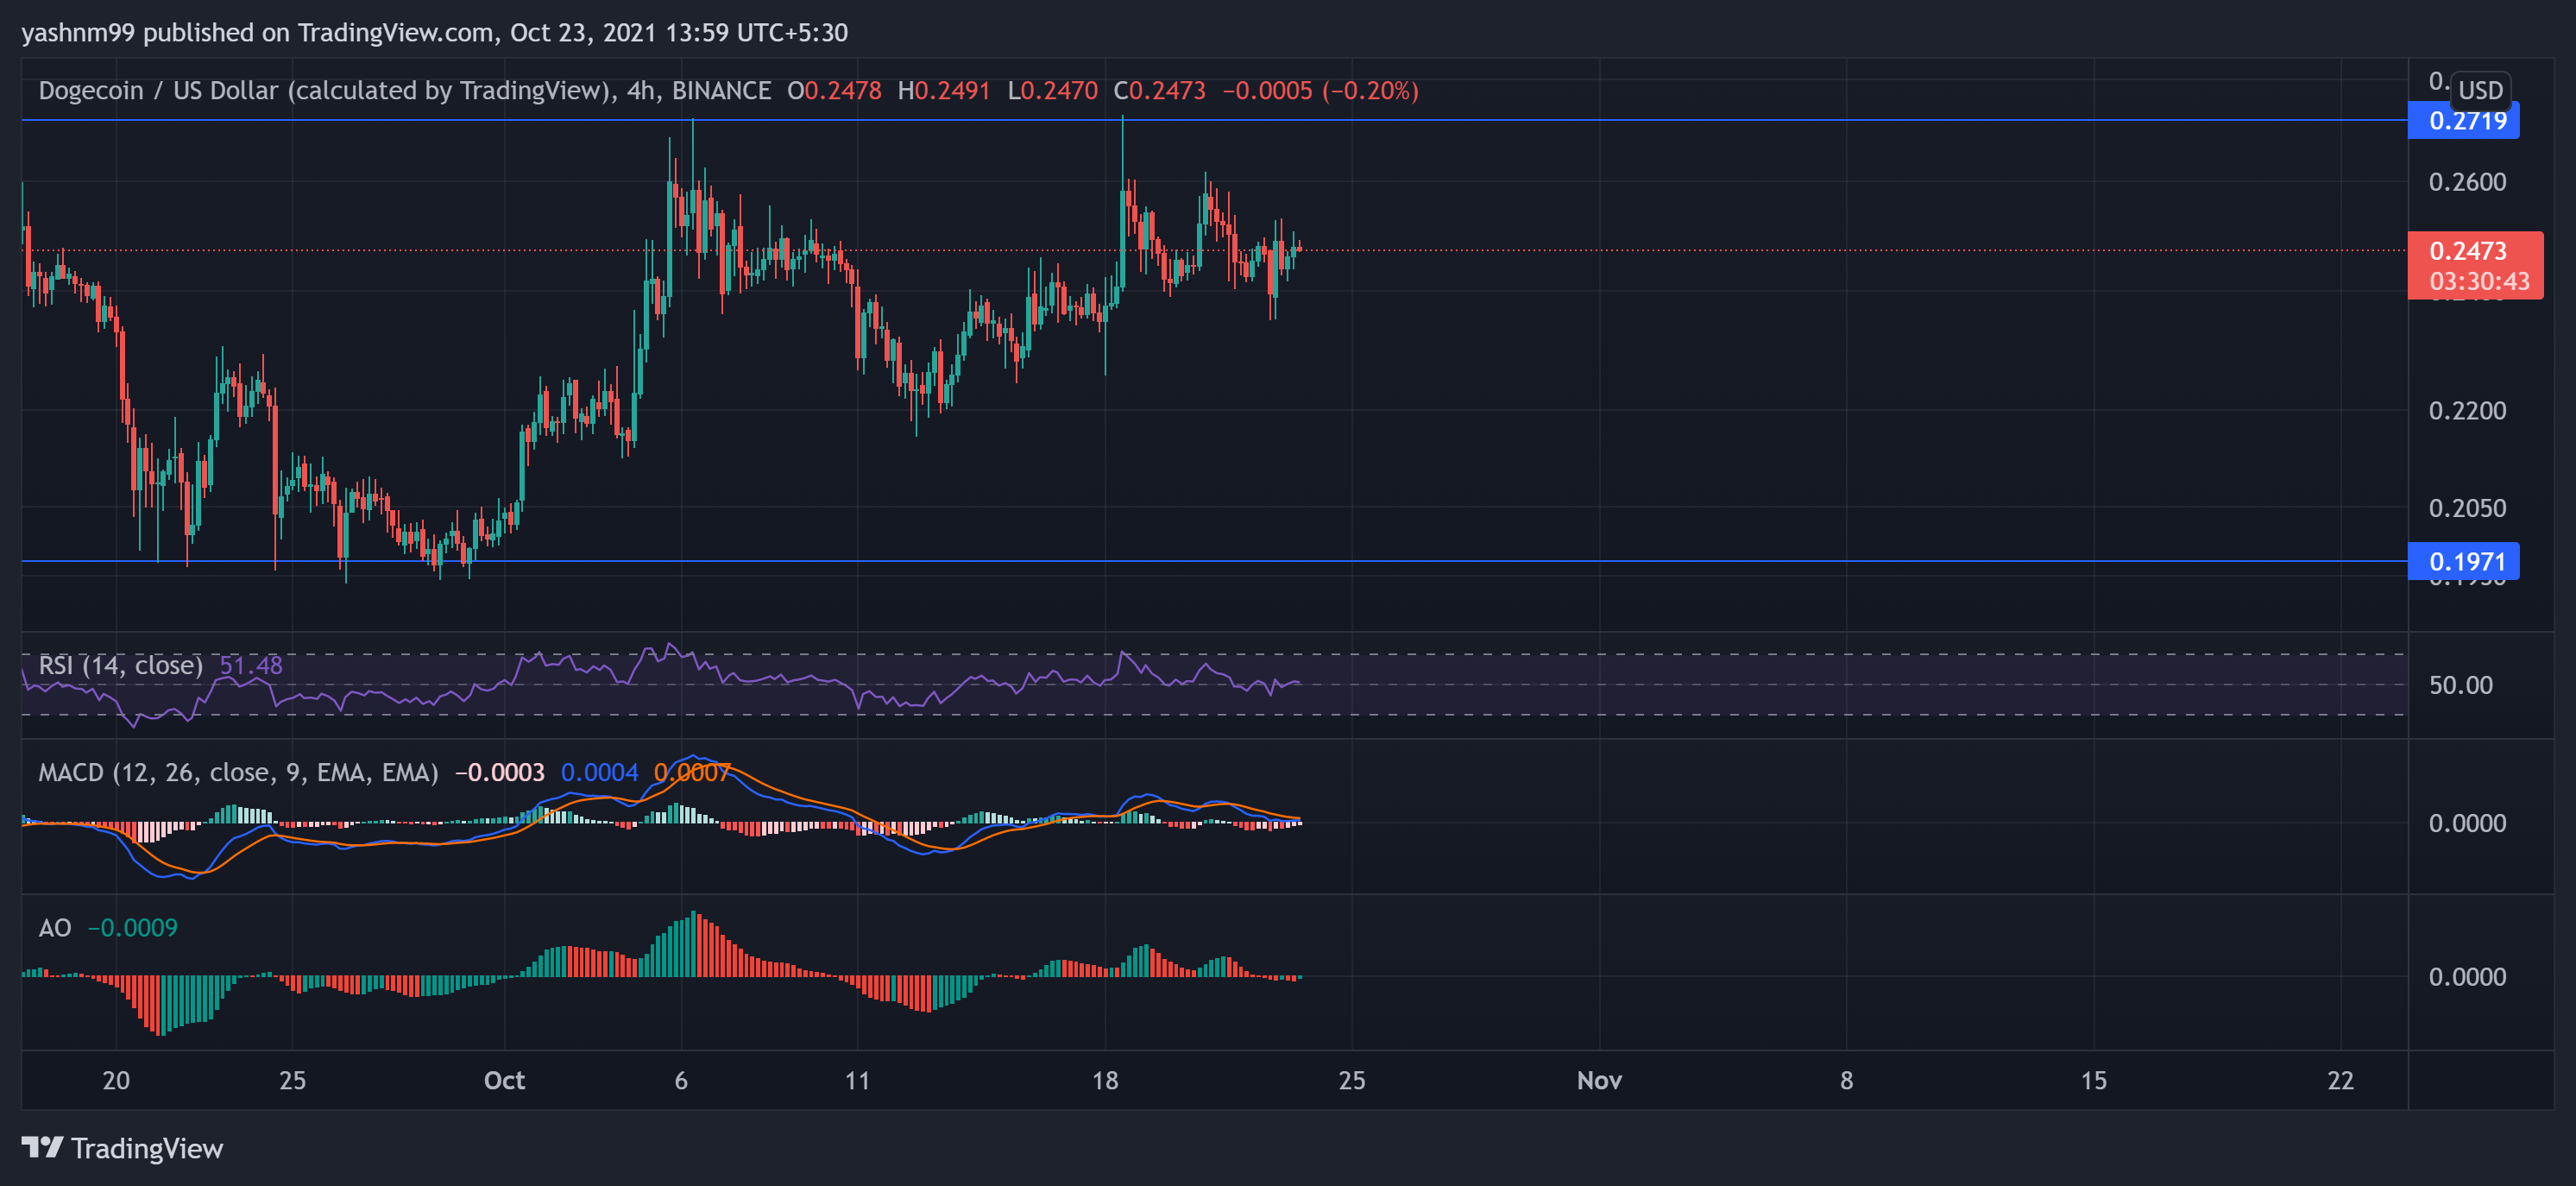
DOGE declined by 0.28% over the last day and traded at $0.2473. The altcoin flashed signs of consolidation after barely breaching its resistance that stood at $0.2719. After Elon Musk’s reference to Dogecoin in response to a tweet about becoming a trillionaire, the DOGE bulls were keen on sustaining their pressure.
The Relative Strength Index stood above the half-line after a surge over the last day, depicting a significant decrease in selling pressure. Also, MACD diverged with the signal line, possibly looking to head north. The Awesome Oscillator seemed to agree with previous readings, flashing a green signal bar.
Bitcoin Cash (BCH)
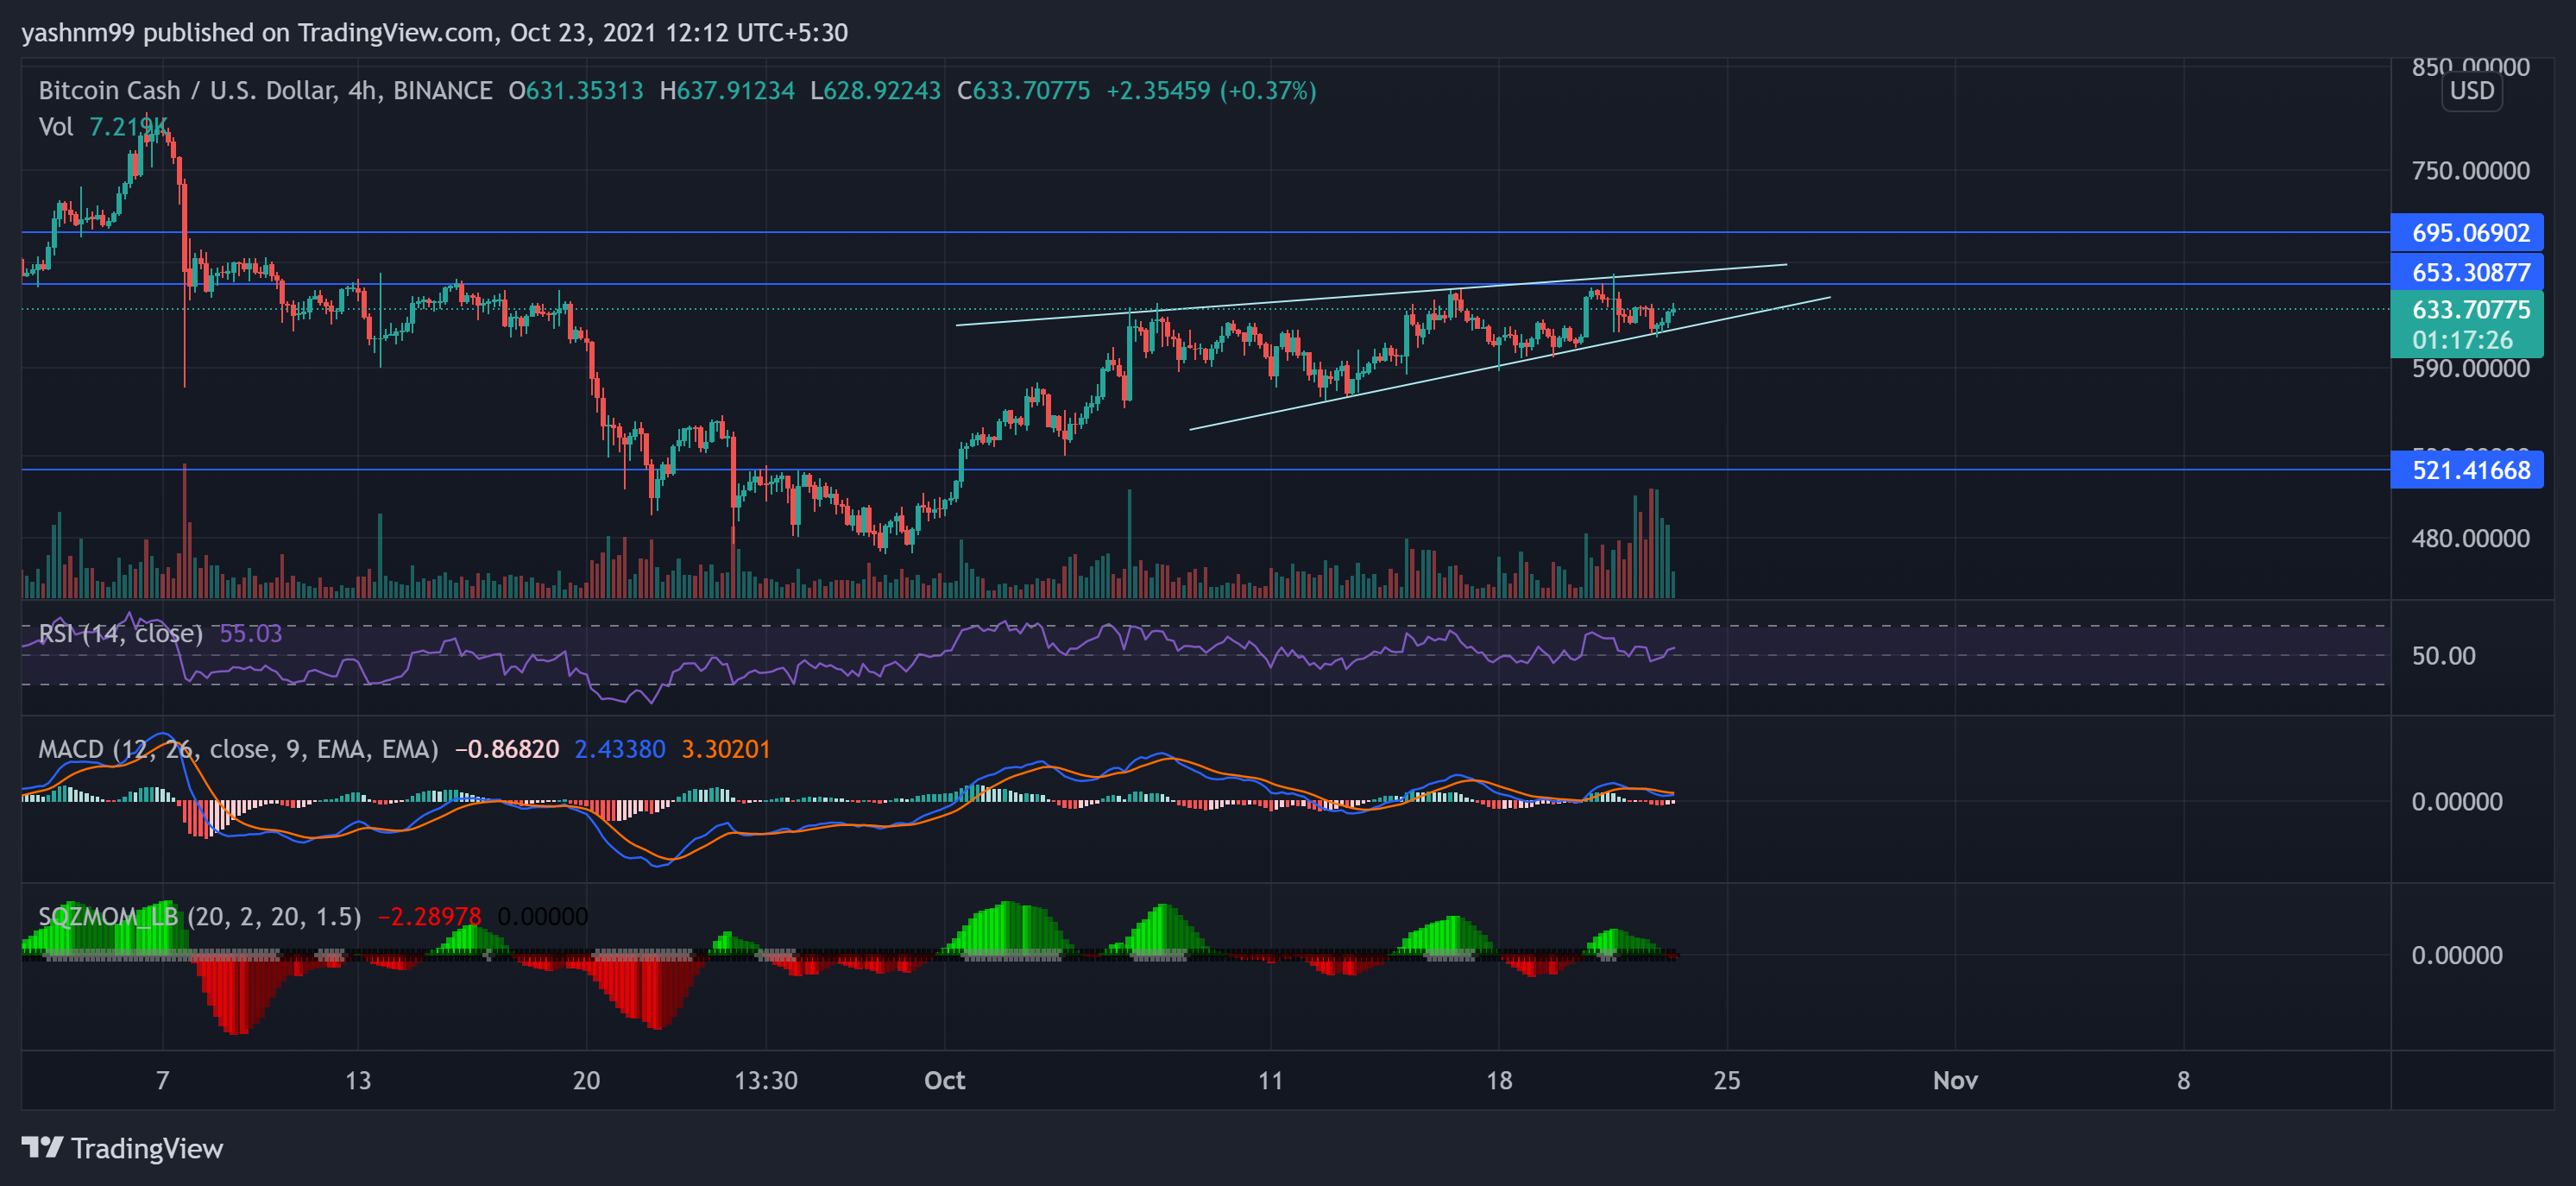
BCH was priced at $633.71 and had appreciated by 0.41% over the last day. After trading at its 5-week high, a couple of days ago, the altcoin couldn’t breach its resistance. It seemed to consolidate between its immediate resistance and support levels that stood at $653.07 and $521.42, respectively.
On the 4-hour chart, the near-term trendline seemed to point towards bullish tendencies and possibly breach its immediate resistance, looking at a new one at the $695-mark.
The Relative Strength Index stood at 55.03, showing a slight preference for buying strength. Also, the MACD and signal line were on the verge of convergence, with MACD looking to head north.
However, The Squeeze Momentum Indicator displayed black dots and red signal bars, hinting that the market might not witness high volatility in the near term. Finally, with a sharp decline in trading volumes, the bulls seemed to ease their pressure in the near term.
Ethereum Classic (ETC)
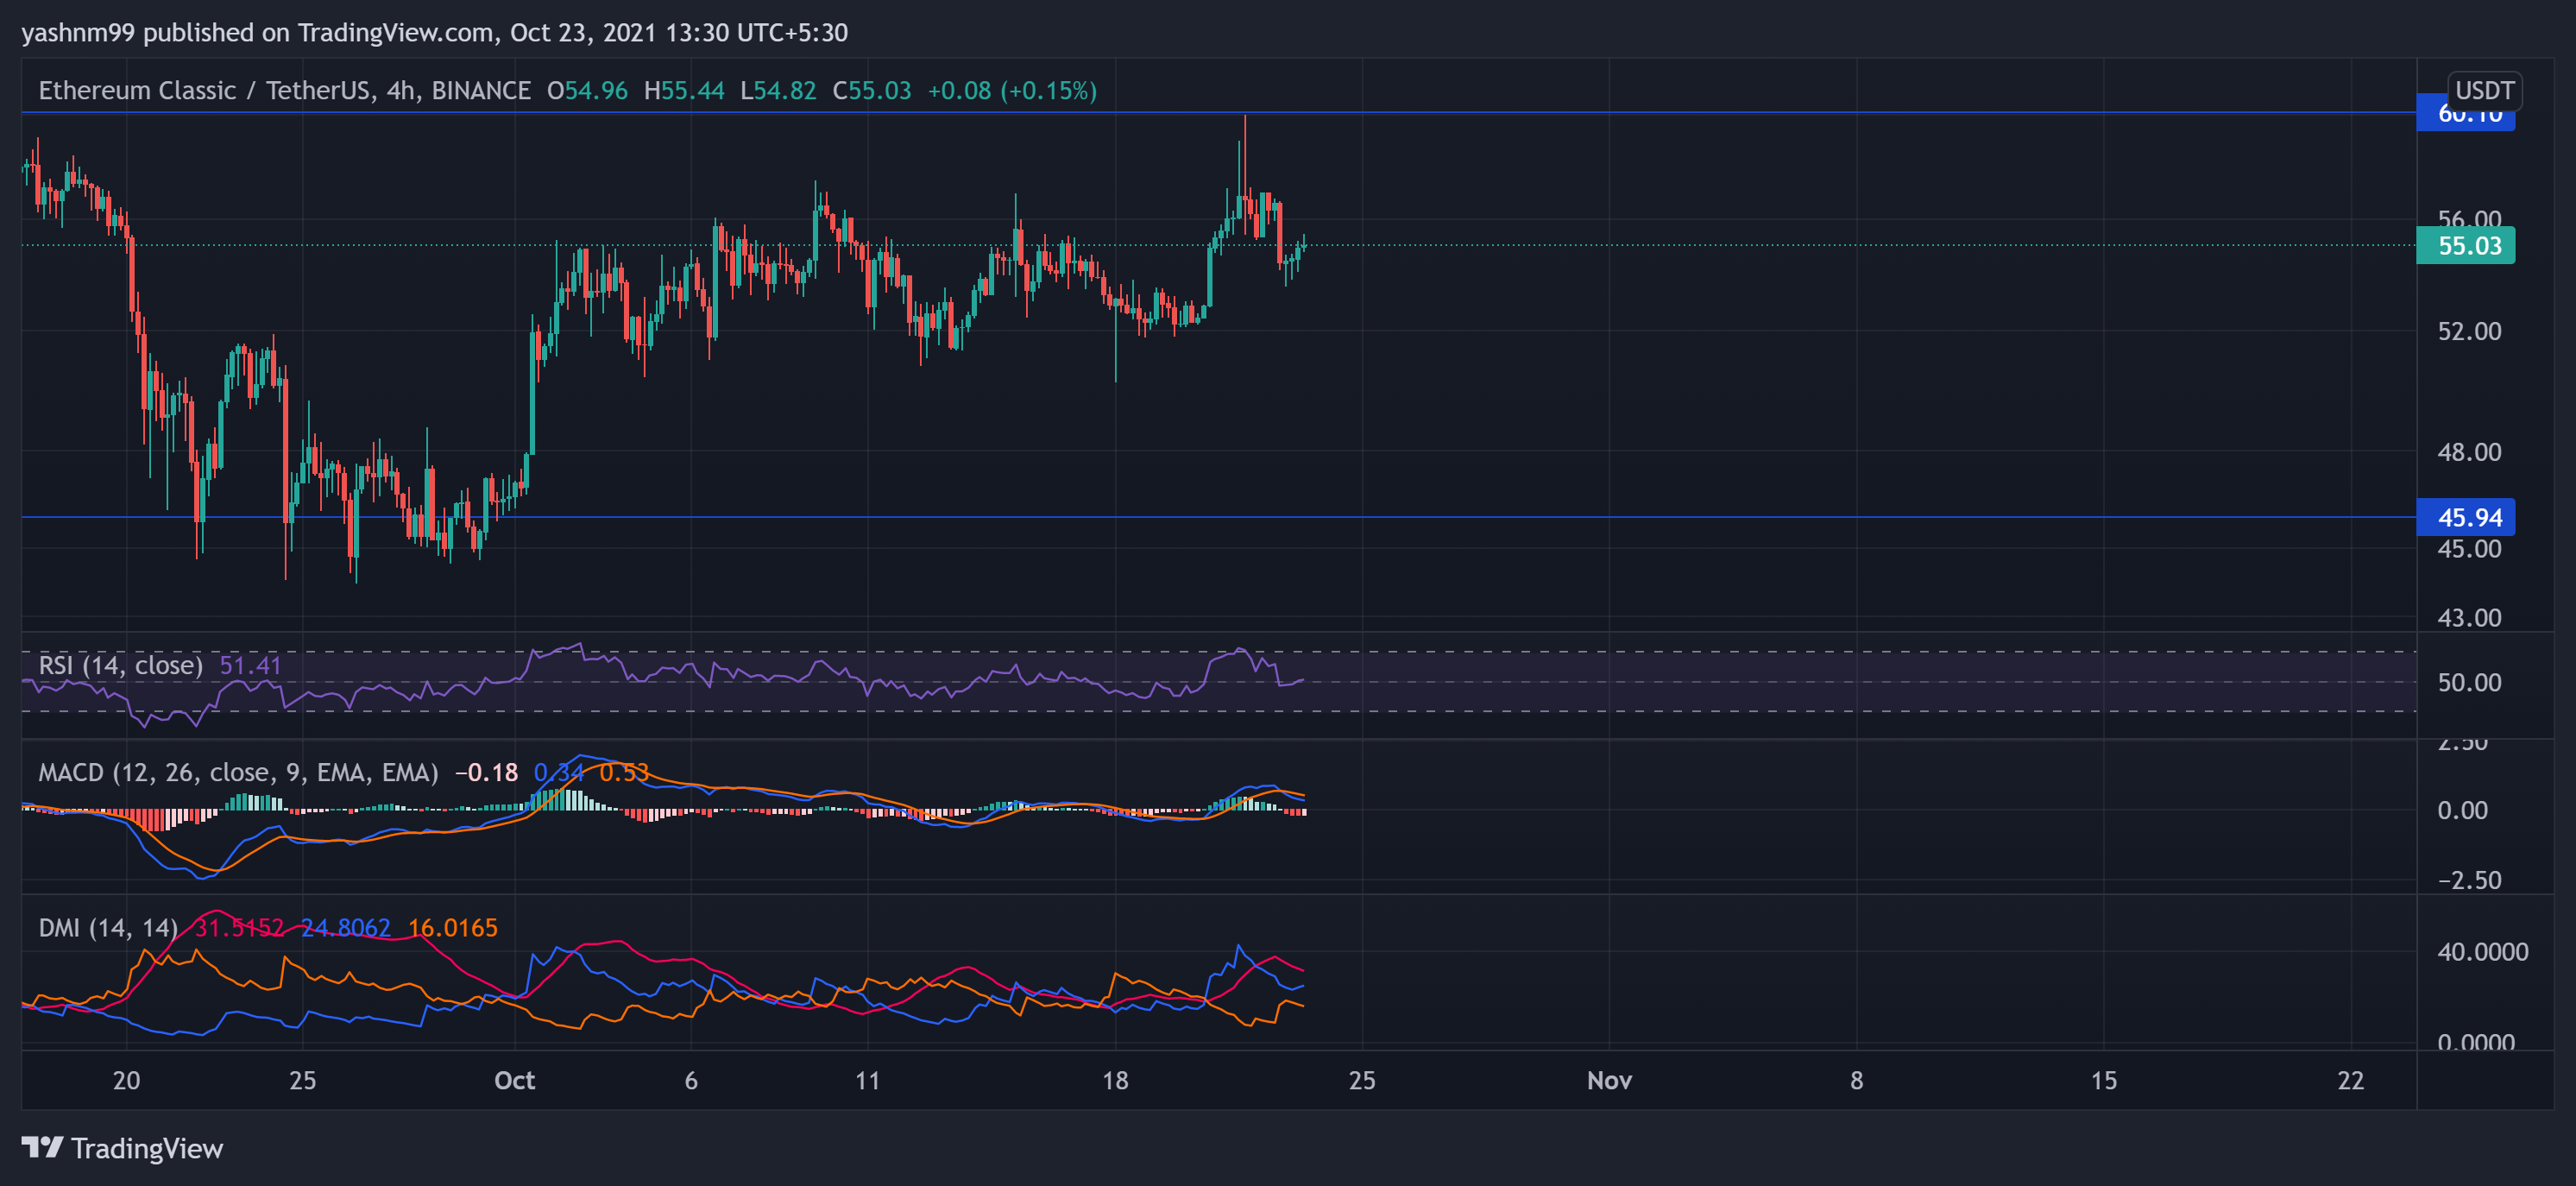
After reaching its five-week high near the resistance point that stood at the $60-mark, ETC fell by nearly 2.61% over the last day and traded at $55.03. The support level stood at $45.94. Key technicals pointed towards increasing bearish power.
The Relative Strength Index witnessed a dip of 13 points below the midline over the last day. However, it was able to find momentum towards the half-line at the 51-mark. Also, The MACD was below the signal line with the MACD histogram flashing red signal bars.
This reading visibly pointed at the decreasing buying pressure. Nevertheless, after a sharp plunge, the +DI Line seemed to find its ground with the -DI Line looking to head south.


