Dogecoin, Chainlink, EOS Price Analysis: 19 December
While fear sentiment had deeply seeped in, it became tougher for the bulls to gather trend-altering volumes. As Dogecoin and EOS continued their bearish streak, Chainlink kept the near-term revival hopes alive for the bulls.
Dogecoin (DOGE)
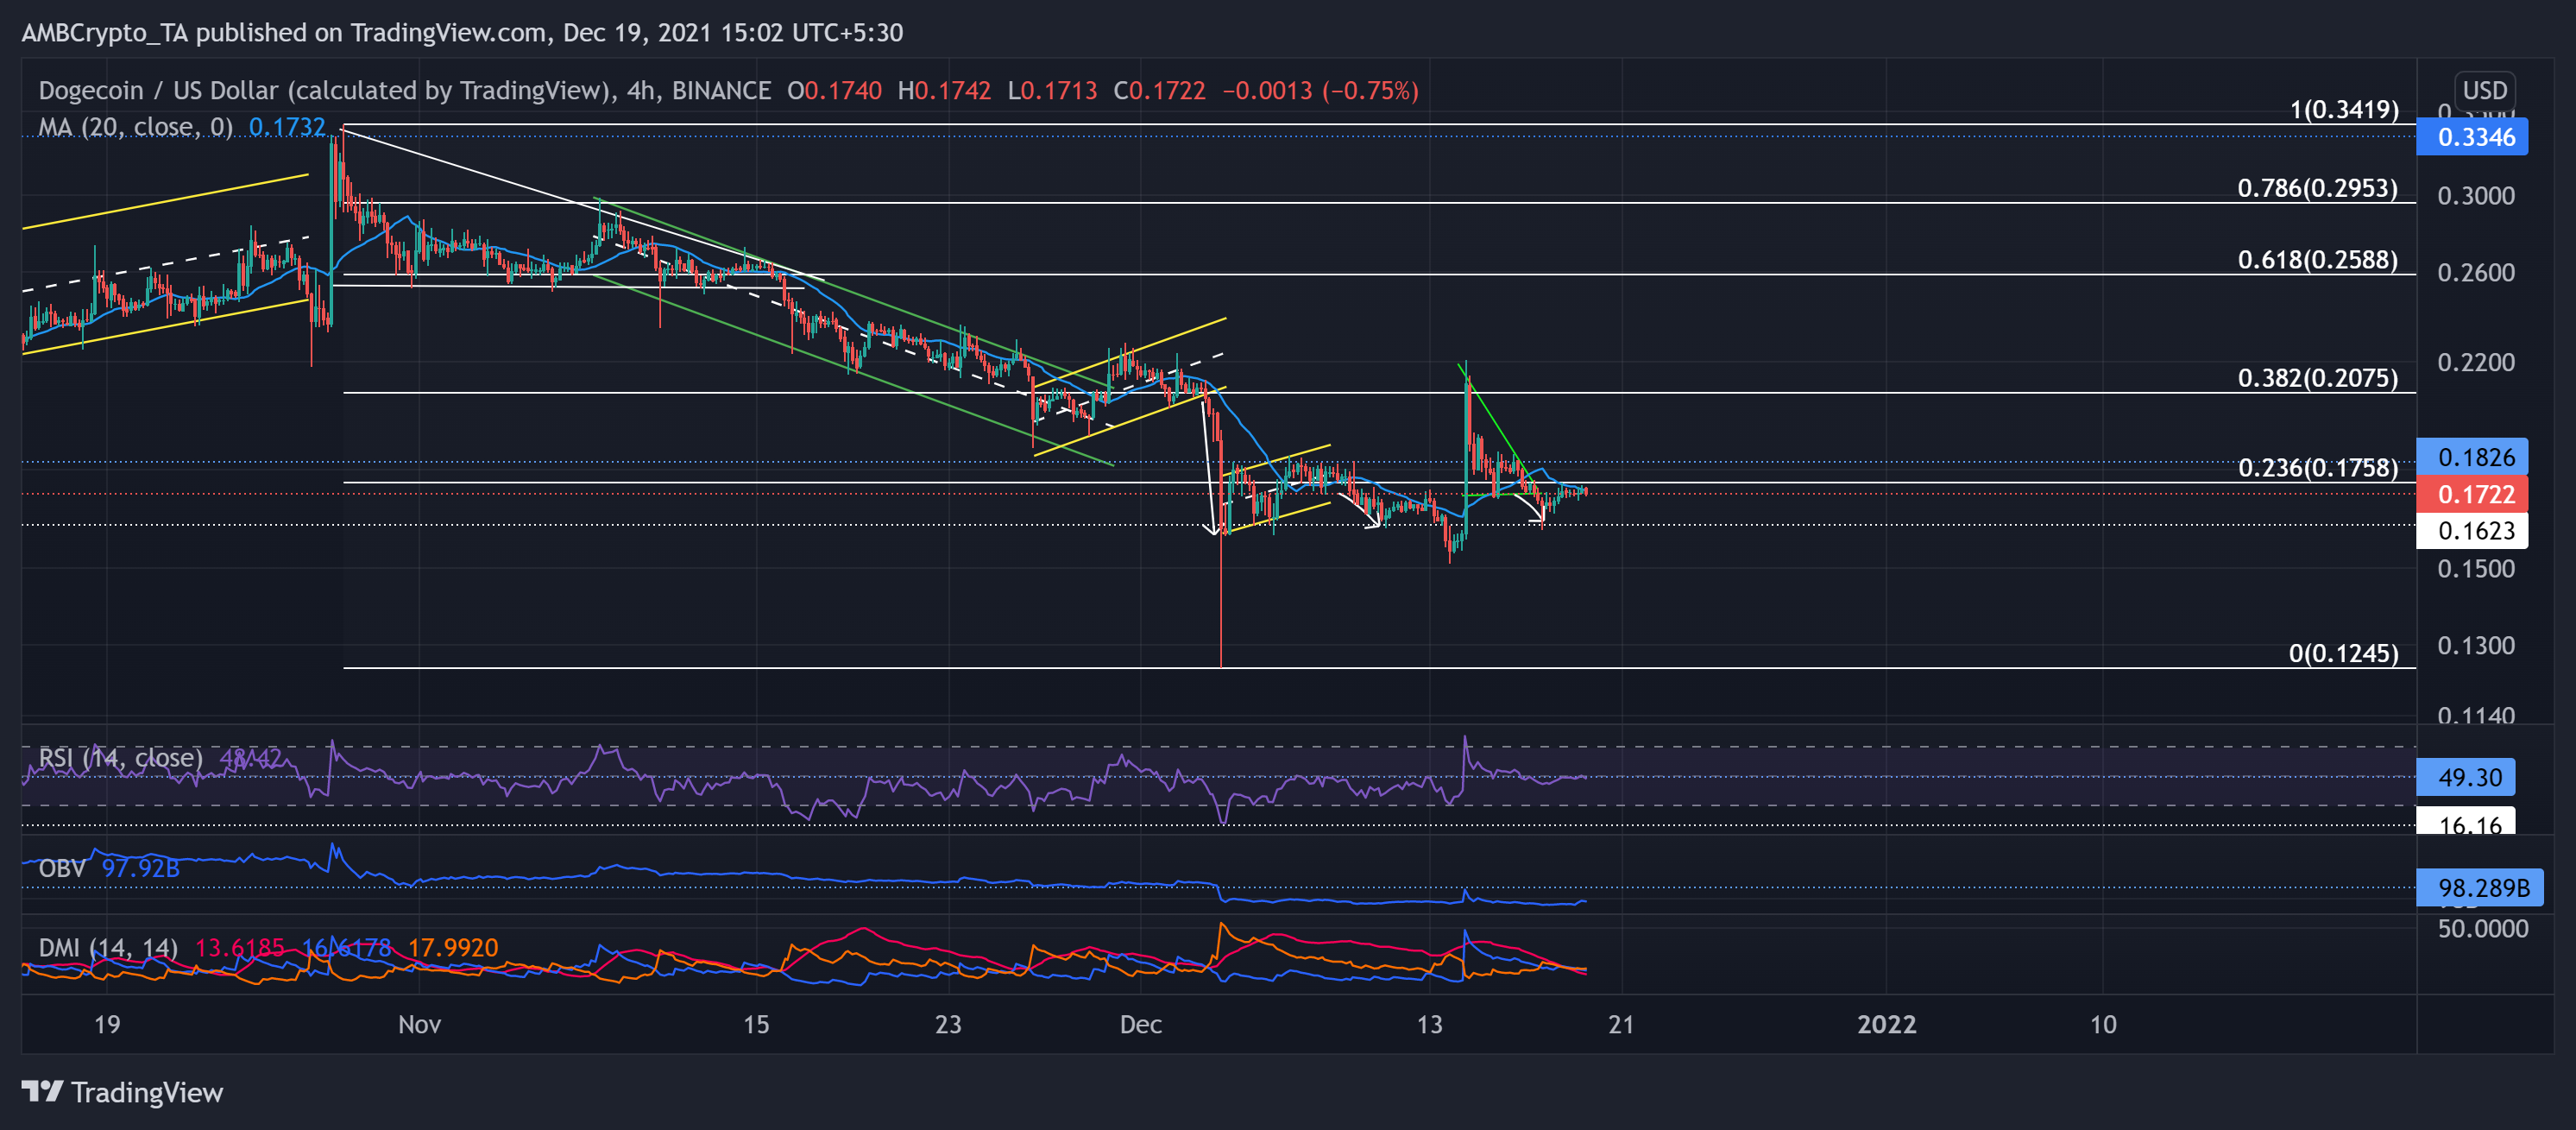
DOGE retraced most of its previous gain by noting a 21.9% fall in the last five days. This pullout ensured the 23.6% Fibonacci resistance as the price struggled to leap the $0.175-level. Moreover, the 20-SMA (blue) stood just below the above mark and ensured an immediate testing point for bulls.
The fall below the 23.6% level pushed the OBV below its 12-week OBV support (previous). After a descending triangle (green) breakout, the bulls found immediate support at the $0.162-mark.
At press time, DOGE traded at $0.1722. The RSI dipped below the 49-mark, depicting a selling bias. Although the DMI displayed a marginal bearish bias, the ADX was substantially weak.
Chainlink (LINK)
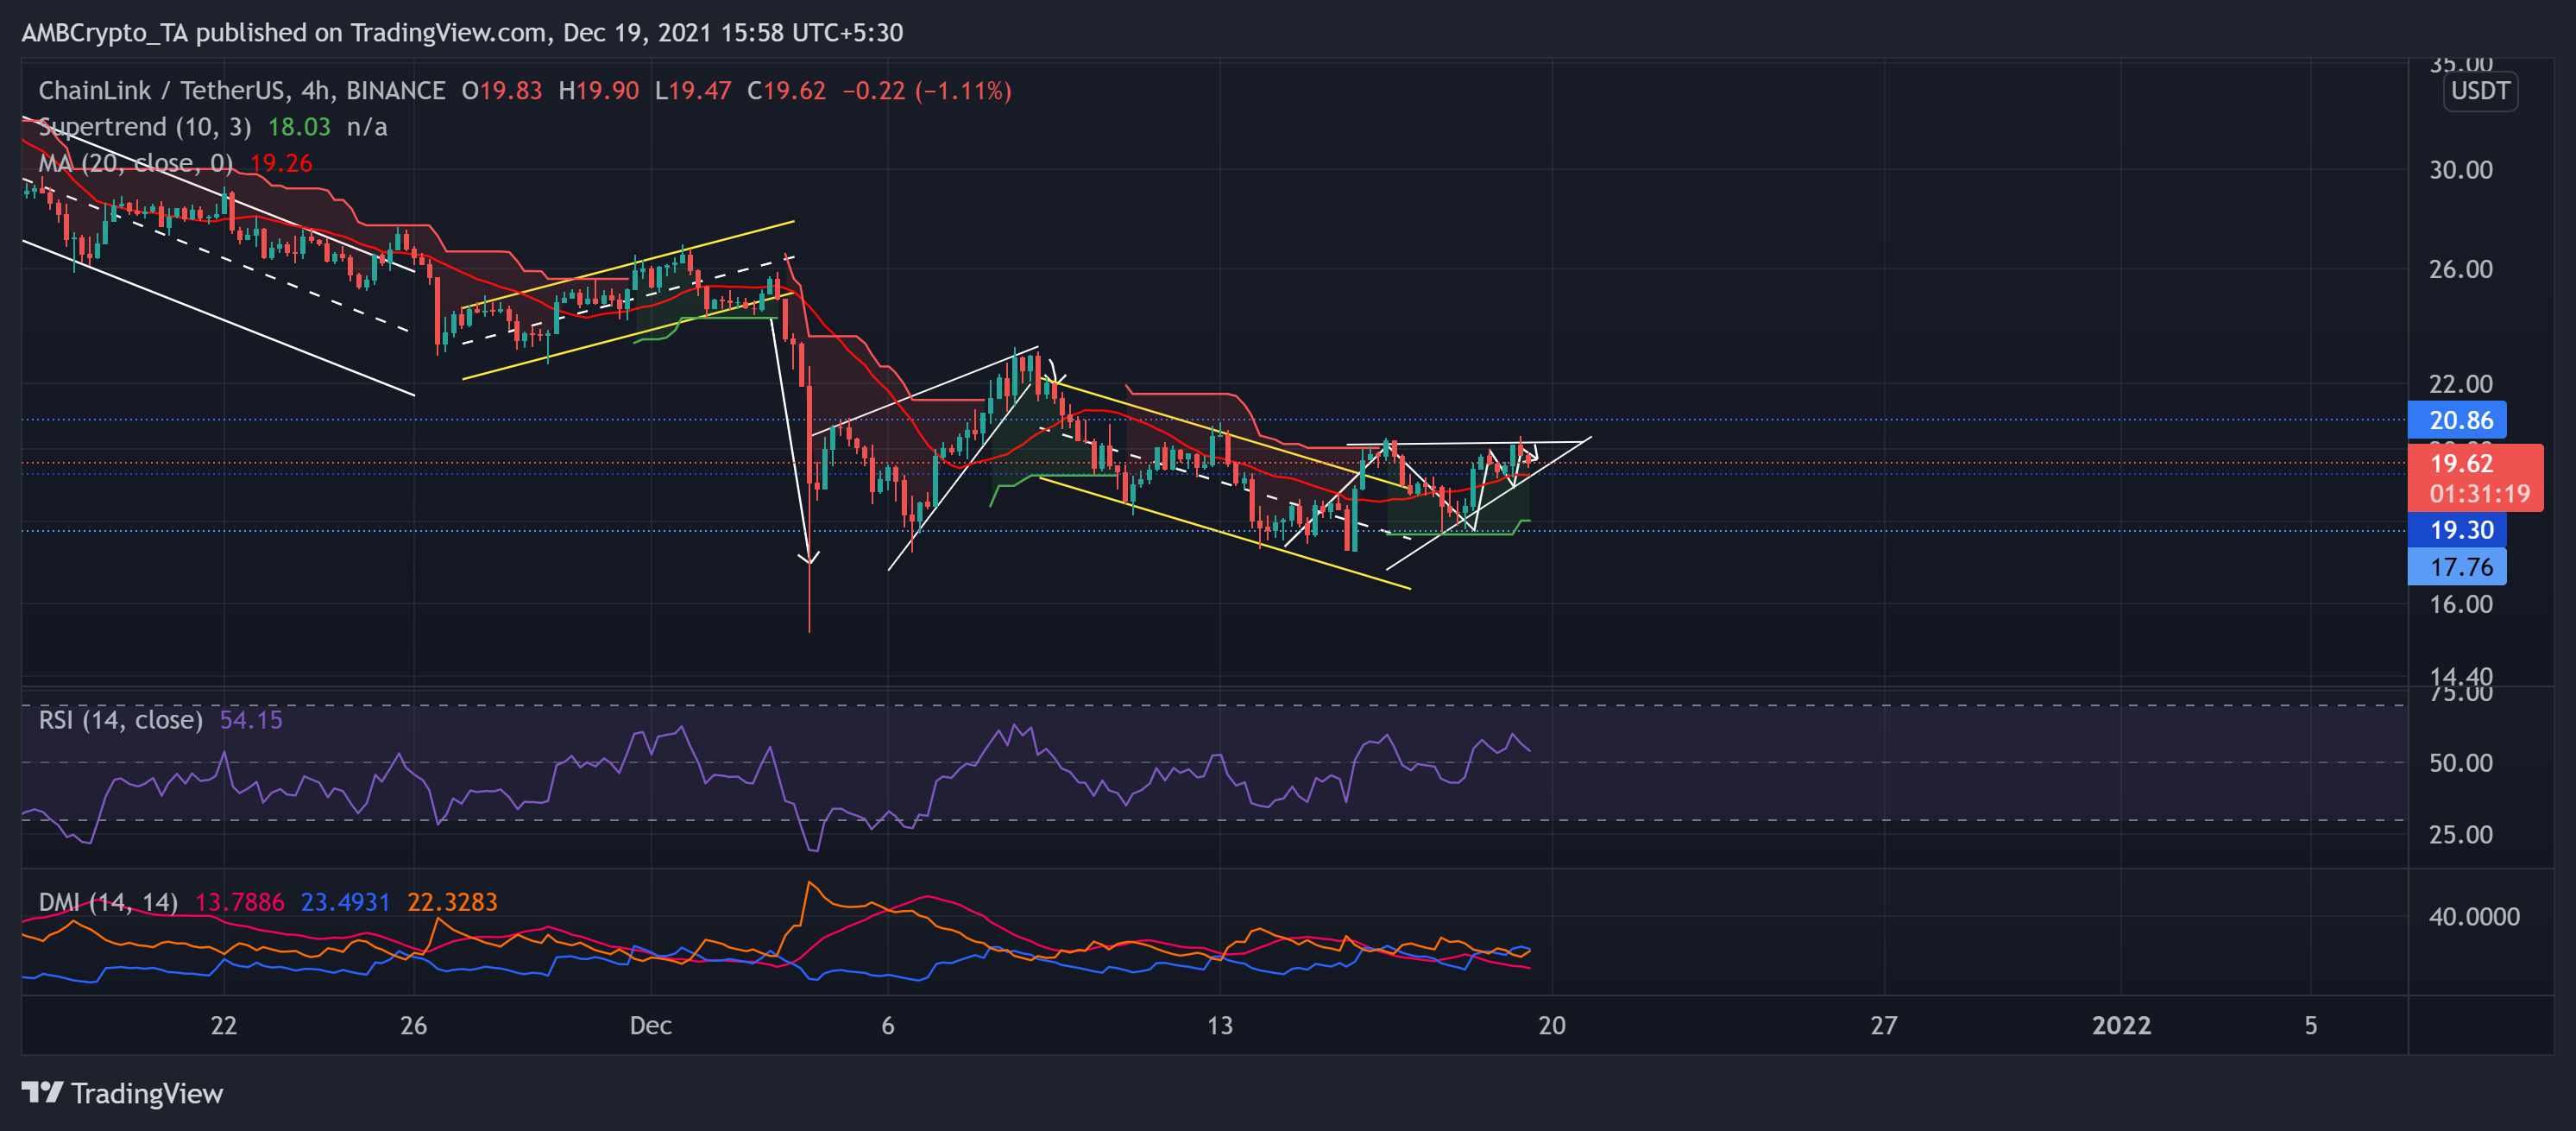
After witnessing a rising wedge breakdown on 9 December, the price action transposed in a down-channel and tested the immediate support at $17.7 nearly five times in the last eight days. This fall pushed the price action below its four-month-long resistance at the $19.3-mark.
However, the altcoin marked a 15.2% incline from the 15 December low over the past four days. Now, LINK formed an ascending triangle on its 4-hour chart as the bulls increased their pressure. Accordingly, the Supertrend flashed buy signals.
At press time, LINK traded at $19.62. The RSI swayed above the half-line, hinting at a bullish preference but seemed to head towards the midline. Also, the DMI preferred the bulls while showing a slight increase in bearish power.
EOS

Over the past eight days, EOS managed to form a descending triangle after a down-channel breakdown on its 4-hour chart. Also, after poking its 6-week low on 3 December, the alt saw an upturn above the 38.2% Fibonacci resistance but failed to sustain that level. Thus, the price plunged below that level after marking an over 17.78% loss in the past ten days.
At press time, EOS traded at $3.224. Now, the bears will again try to retest the lower trendline (green). The near-term technical indications for the coin skewed toward the bears.
The RSI was below the half-line but showed slackening signs. Additionally, the DMI and AO displayed a bearish inclination. Nonetheless, the ADX depicted a weak directional trend for EOS.


