Dogecoin: Despite a bullish divergence, why a short position may be key

Disclaimer: The findings of the following analysis are the sole opinions of the writer and should not be considered investment advice.
Dogecoin has been on a downtrend since last November. The price did appear to form a bottom in March and rallied quite hard from the $0.11 lows to reach $0.18, but the sentiment behind Dogecoin, as well as much of the rest of the crypto market, shifted toward fear once again in April.
Bitcoin appeared weak on the charts and looked set to post a ninth straight weekly red candle. This relentless downward pressure could have a large impact on DOGE prices too.
DOGE- 12 Hour Chart
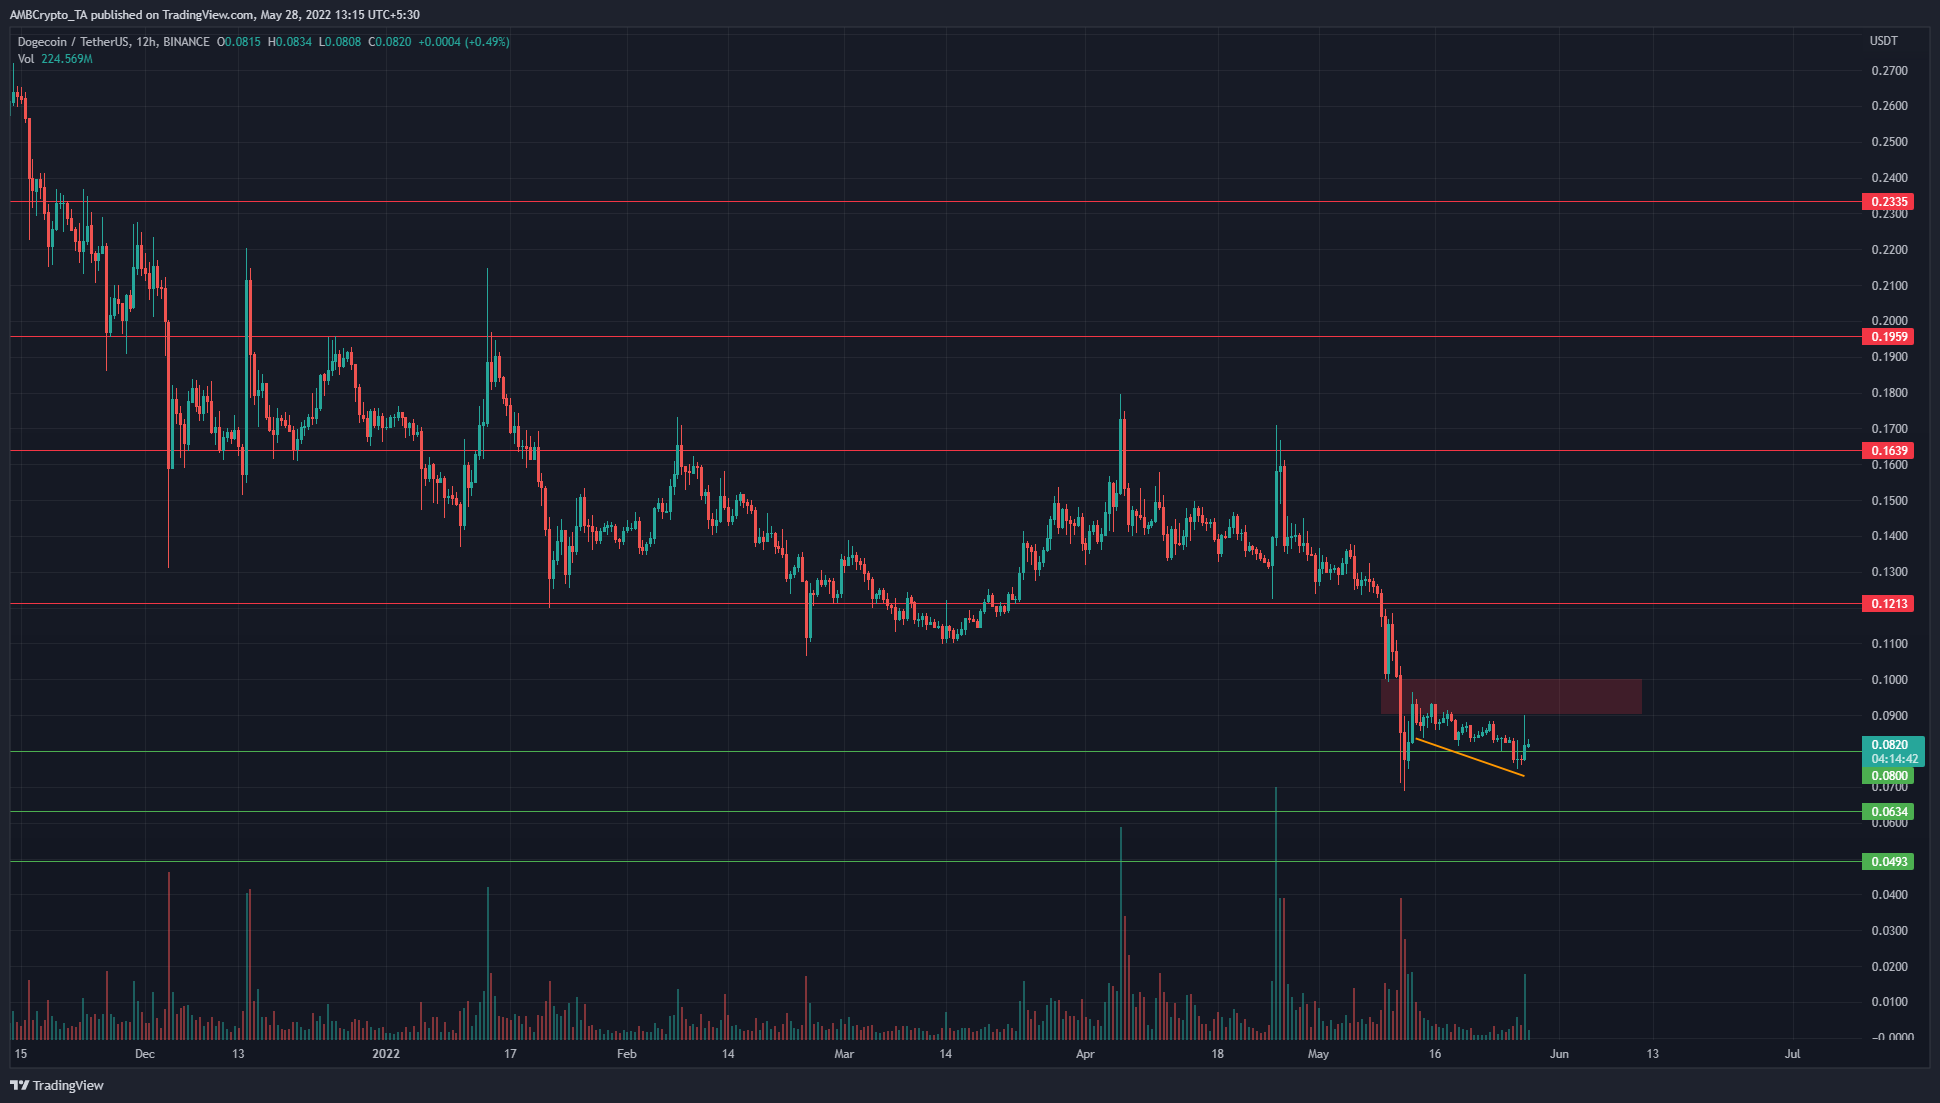
On the price charts, it can be seen that the price has set a series of lower highs and lower lows. There were a few days toward the end of March, when the rally to $0.18 appeared to break the previously bearish market structure and flip it to bullish. however, the price was unable to the $0.14 support.
In May, the $0.14 area was retested as resistance, and the price proceeded to drop brutally quickly to the $0.07 mark before bouncing back to the $0.09 level. Therefore, the sellers have been overwhelmingly strong in May, and the $0.8-$0.1 area is the resistance for the bulls to beat.
A bullish divergence appeared to be in development, but would a pump in prices ensue? More pressingly, would such a pump provide exit liquidity for long-term holders in the form of new, excited buyers, or can a authentic uptrend begin?
Rationale
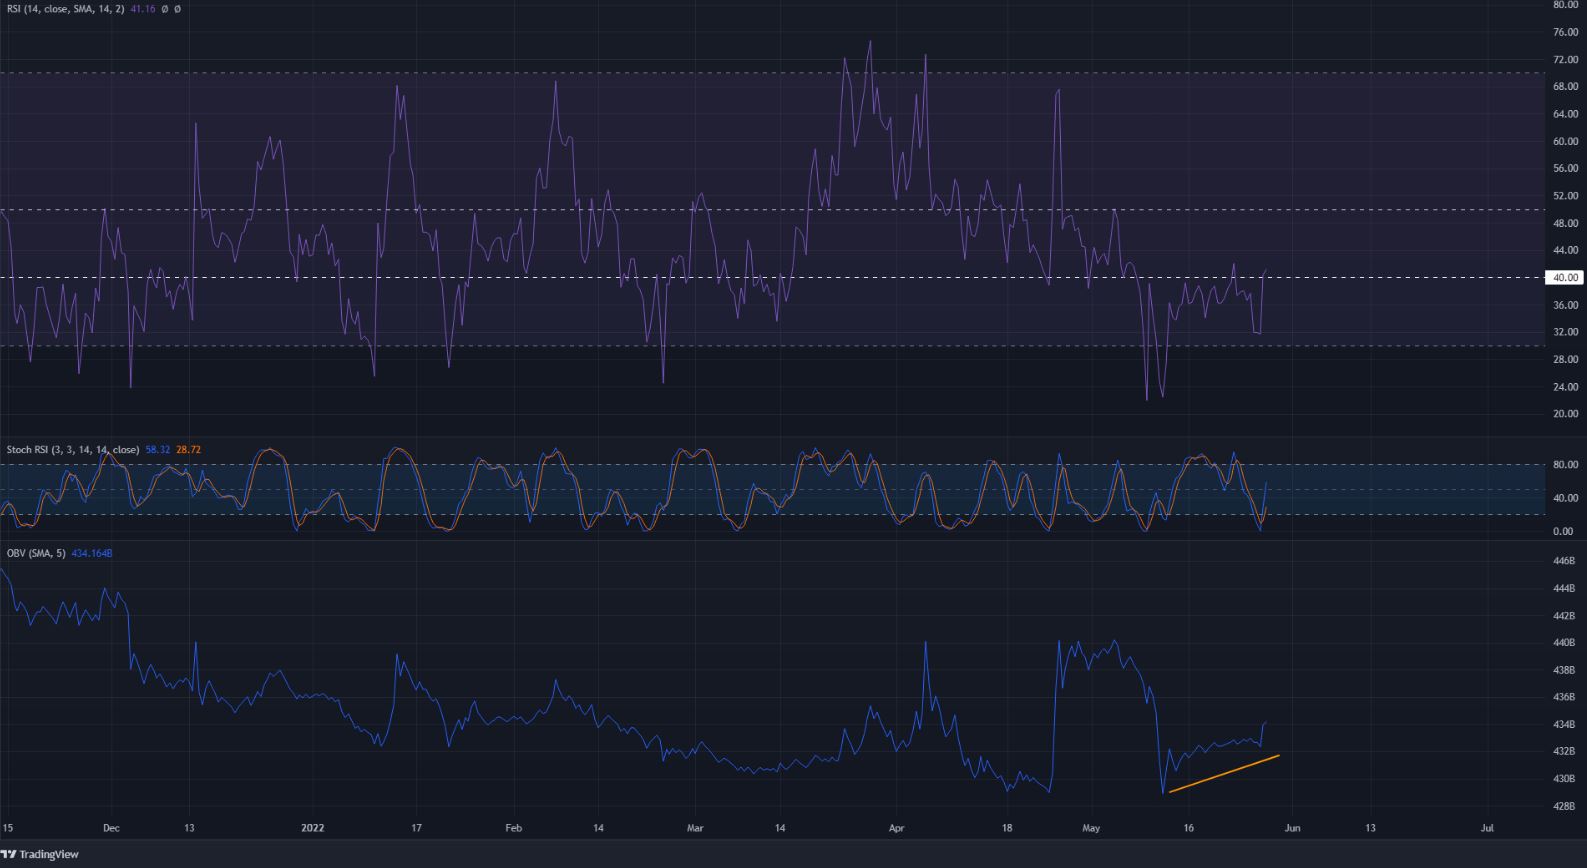
The RSI was at 41.16 at press time, and just above the 40 mark to show that the strong bearish momentum could be weakening. It can also be seen that the 40 mark has acted as support and resistance in the past, hence a move above 40 is encouraging for the bulls. The Stochastic RSI was climbing upwards as well.
The OBV has made higher lows in the past two weeks, even as the price made lower lows (orange). Similarly, the RSI too made higher lows. This is a bullish divergence and is a signal that a bounce in prices could be around the corner.
Conclusion
The divergence alone does not dictate a bounce, and if such a move upwards arrives, it could still be days away. Since the market structure remains overwhelmingly bearish, rather than looking to buy the bullish breakout, a trader can look to short DOGE in the $0.1 region. A stop-loss could be set above the $0.11 mark.


