Dogecoin, Litecoin, Chainlink Price Analysis: 27 April

Bitcoin has snapped from $38.2k to $40.6k and is back again at the $38k range in the past couple of days. This volatility has seen the altcoin market weave on the price charts as well. Dogecoin saw a sharp rally after multiple days of accumulation within a range. Litecoin, as well as Chainlink, continued to trend downward.
Dogecoin (DOGE)
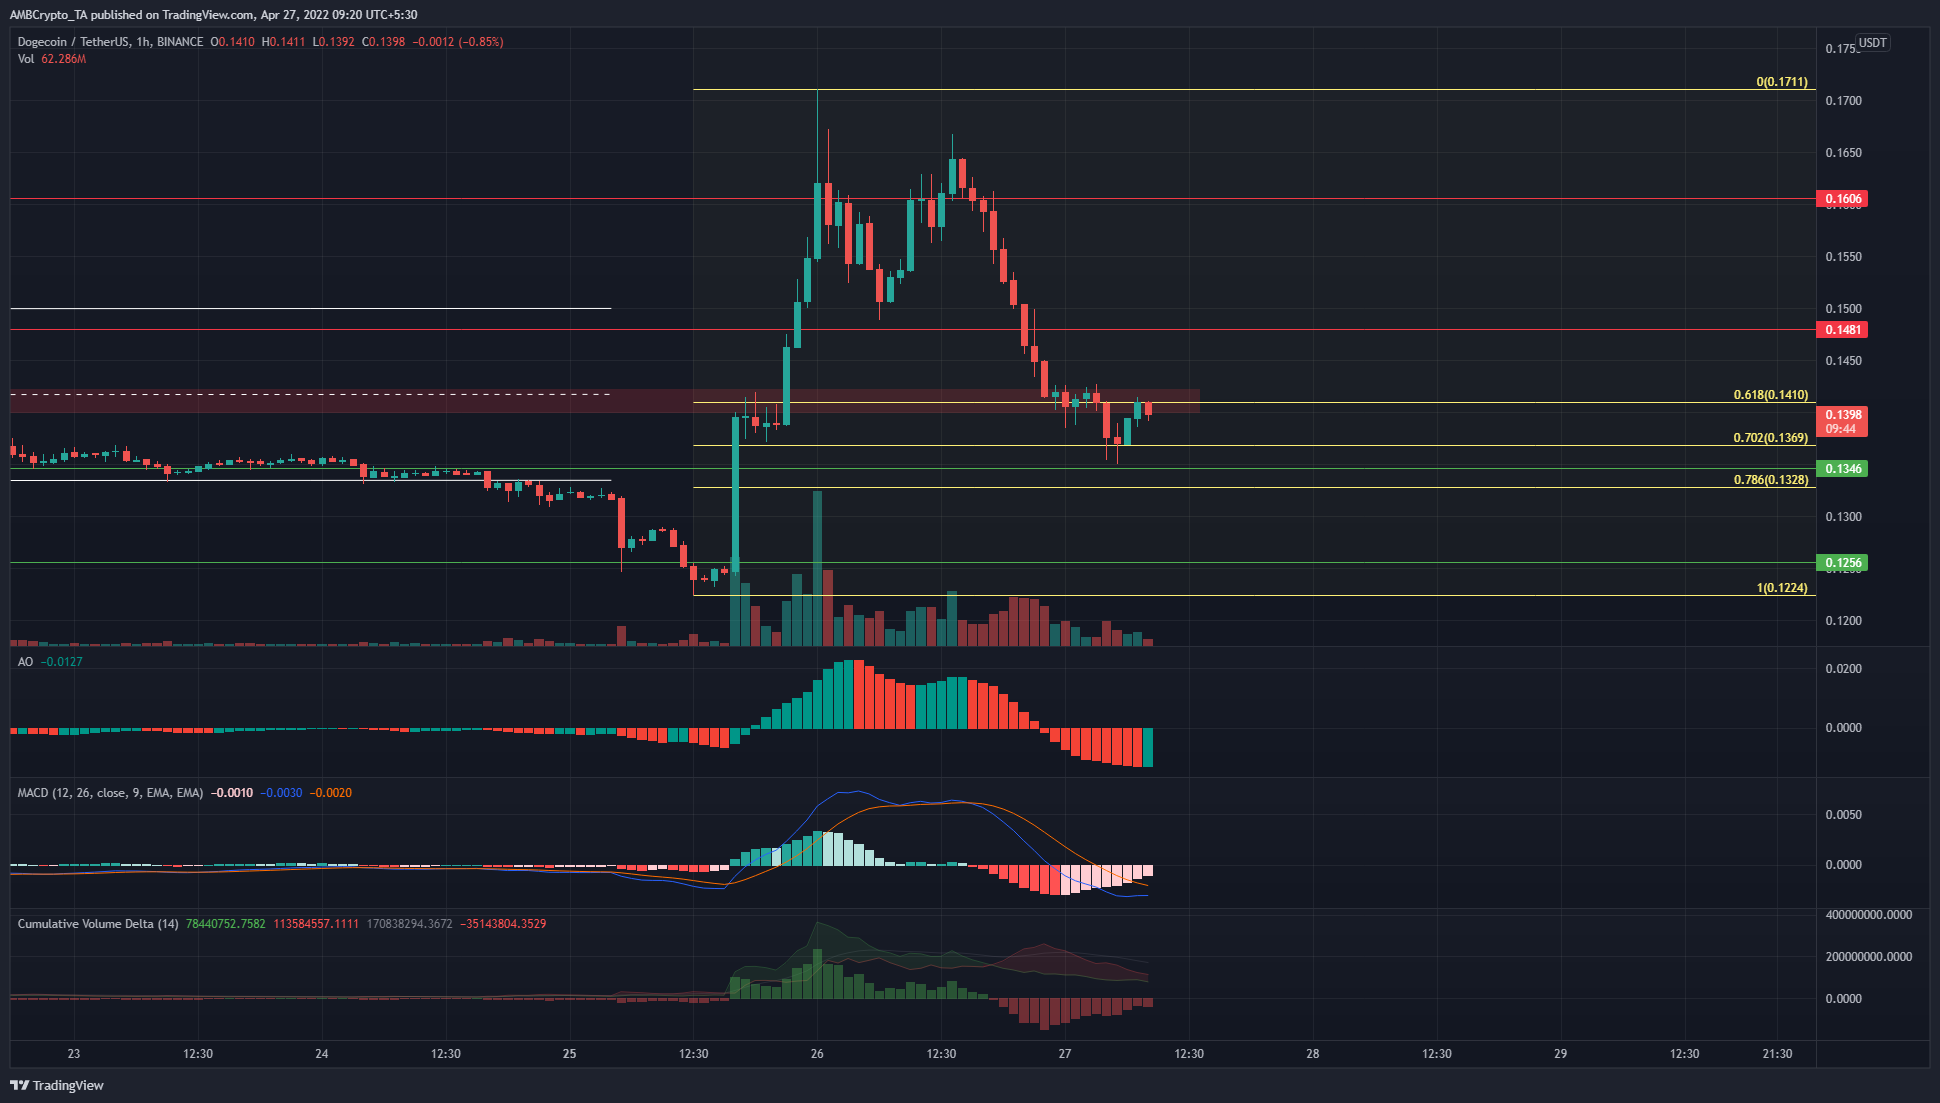
DOGE pumped from $0.122 to $0.171, and based on these swing lows and highs a set of Fibonacci retracement levels (yellow) were plotted. The previous day saw DOGE slip beneath the $0.14 zone of supply as well.
However, the price has found some support near the $0.134 support level. The momentum indicators showed bearishness, as the Awesome Oscillator and the MACD dived beneath the zero line. The CVD also showed strong selling pressure. Hence, the confluence of the $0.14 resistance zone and the retracement level will need to be beaten in order to make a case for the bulls.
Litecoin (LTC)
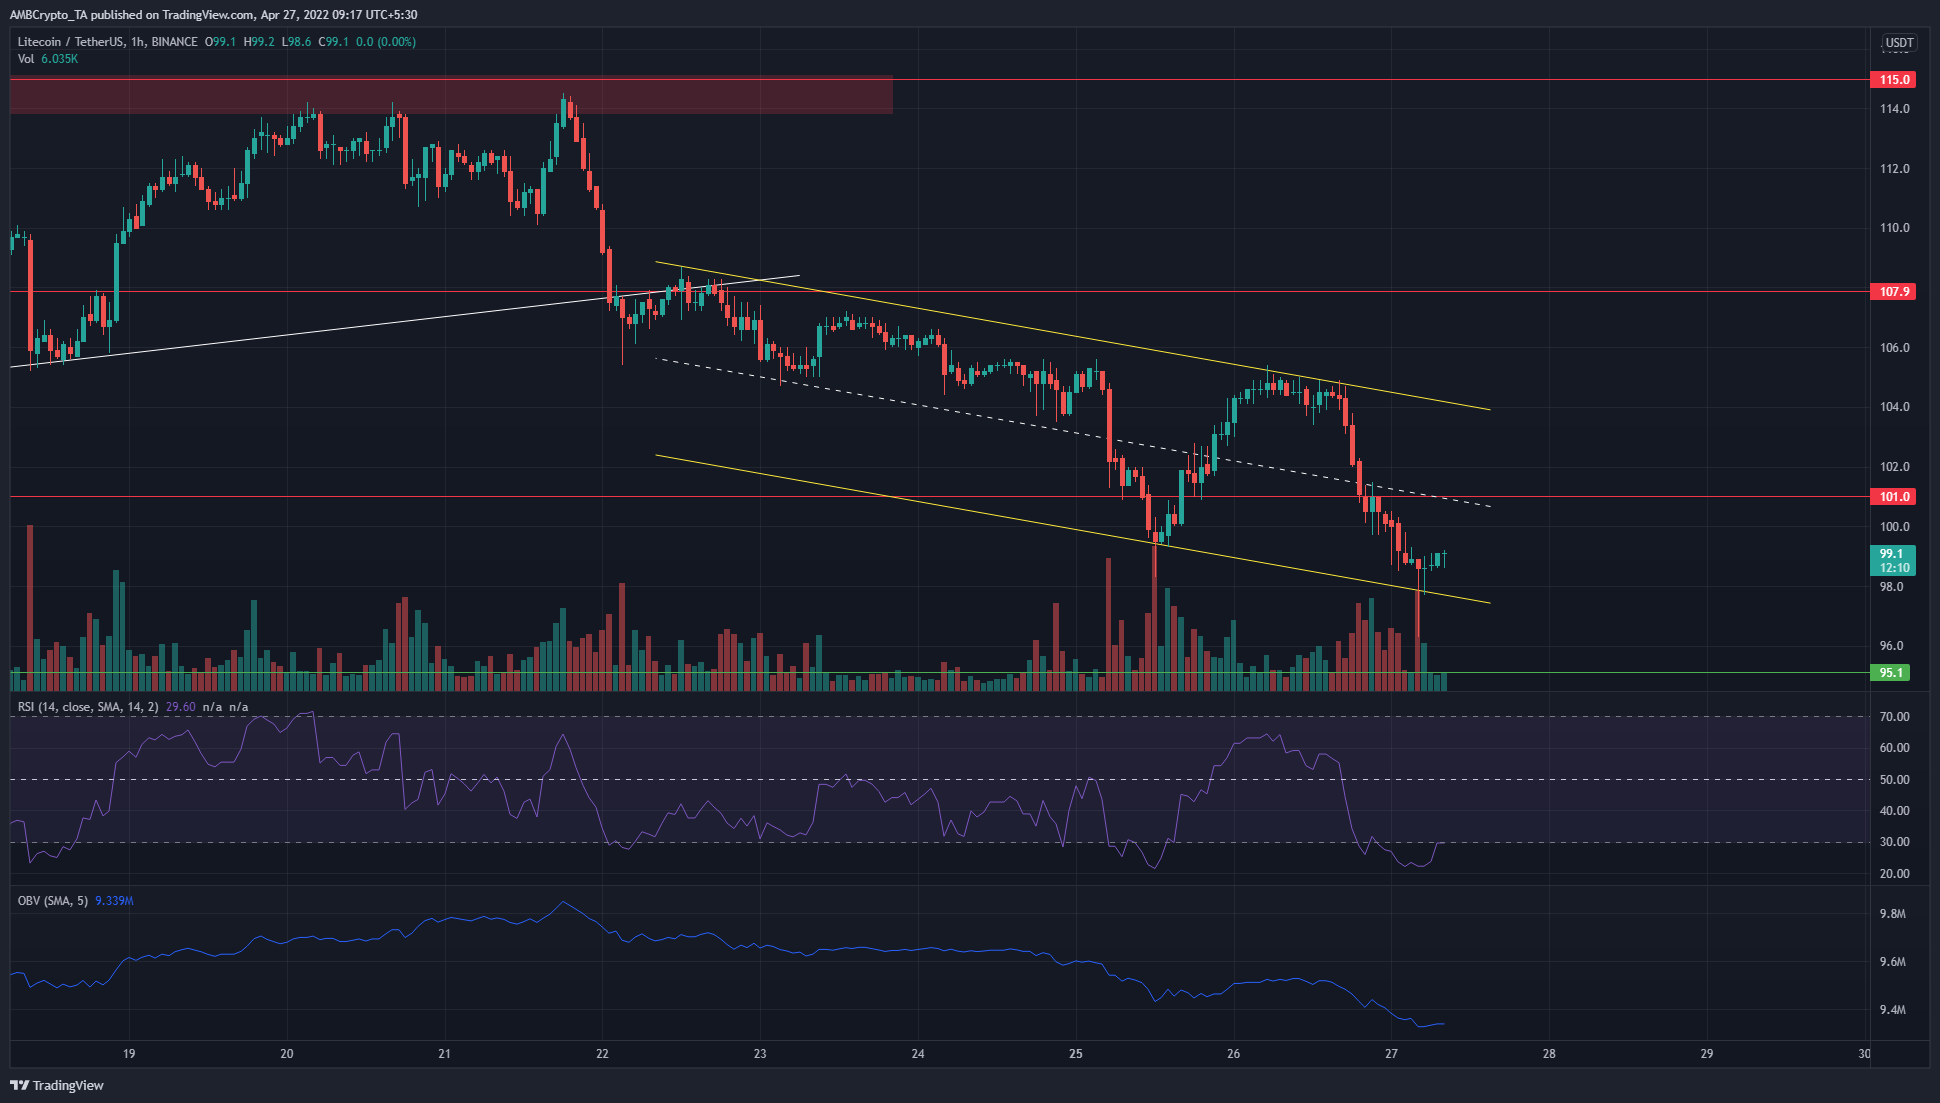
LTC was trading within a descending channel (yellow) in the past few days. To the north, $101 and the $104 levels are likely to be strong resistance levels, as they represent the mid-point and the highs of the channel respectively.
The RSI was at 29.6 and inside the oversold territory. This could see the price bounce and recover slightly before more downside. The OBV has been on a steady downtrend, which meant that the selling volume has been greater than the buying volume in the past few days.
Therefore, a bounce toward $100 before another drop was the likely scenario for LTC in the next couple of days.
Chainlink (LINK)

Like Litecoin, Chainlink has also been on a downtrend in the past week. The A/R has been descending steadily, which showed steady selling pressure. This confirmed the downtrend to be backed by genuine selling. The RSI was at 36 to show strong bearish momentum.
The DMI also showed a strong downtrend, as the ADX (yellow) and the -DI (red) were well above the 20 mark. The price has also slipped beneath the $13.58 resistance level and has formed a series of lower highs and lower lows.